Profit & Loss Analysis The Trader's Ultimate Guide
A profit & loss analysis is the process of digging into your trading income and expenses to figure out not just if you're profitable, but why. It goes way beyond a simple win-loss record to show you the true financial health of your trading strategy. Think of it as the foundation for making smart, data-driven decisions instead of emotional ones.
Your Trading Cockpit: Why P&L Analysis Matters Most
Imagine a pilot trying to fly a 747 just by looking out the window. No gauges, no dials, no flight computer—just pure instinct. It sounds insane, right? Yet, a trader operating without a rigorous profit & loss analysis is doing the exact same thing. They're flying blind in a world governed by hard numbers.
Your P&L statement isn't just some boring accounting document; it's the central dashboard in your trading cockpit. It provides the critical feedback loop you need to navigate volatile markets, manage risk effectively, and steer your account toward consistent growth.
Beyond Winning and Losing
So many traders fall into the trap of obsessing over their win rate. But a high win rate means absolutely nothing if a few catastrophic losses can wipe out weeks of small gains. This is precisely where a detailed P&L analysis becomes your most powerful tool. It forces you to ask the questions that actually matter:
- Are my winning trades significantly bigger than my losing ones?
- How much are commissions and slippage really costing me?
- Does my strategy perform better under certain market conditions?
- Am I cutting my winners short and letting my losers run?
Answering these questions shifts your whole perspective. You stop thinking like someone just trying to win or lose and start operating like you're managing a sophisticated trading business. A great first step is to get a handle on some accounting basics, including profit and loss reports.
A profit & loss analysis transforms raw trading data into actionable intelligence. It’s the bridge between what you think is happening in your account and what the numbers prove is actually happening.
Ultimately, this entire process moves you from a reactive, hope-based approach to a proactive, evidence-based one. The story your P&L tells—through your revenue, costs, and net profit—is the unfiltered truth about your strategy's effectiveness. By learning to read that story, you set the stage for long-term success, turning every single trade into a valuable data point on your journey to becoming a more disciplined and profitable trader.
Breaking Down Your P&L Statement Line by Line
To really get a handle on your trading performance, you have to master the P&L statement. Think of it less like some scary financial document and more like a story that unfolds line by line. It tells you exactly how your trades generated a profit or a loss over a certain period. It starts at the top with your total wins, then methodically strips away every single cost until you’re left with the final number—the truth.
This is no different from running a small business. A coffee shop owner wouldn't just count the cash in the register at the end of the day. They'd subtract the cost of beans, milk, cups, and wages to find their real profit. As a trader, you need that same disciplined mindset.
This flow chart gives you a bird's-eye view of that journey, from your total gains, through your costs, and down to your final profit.
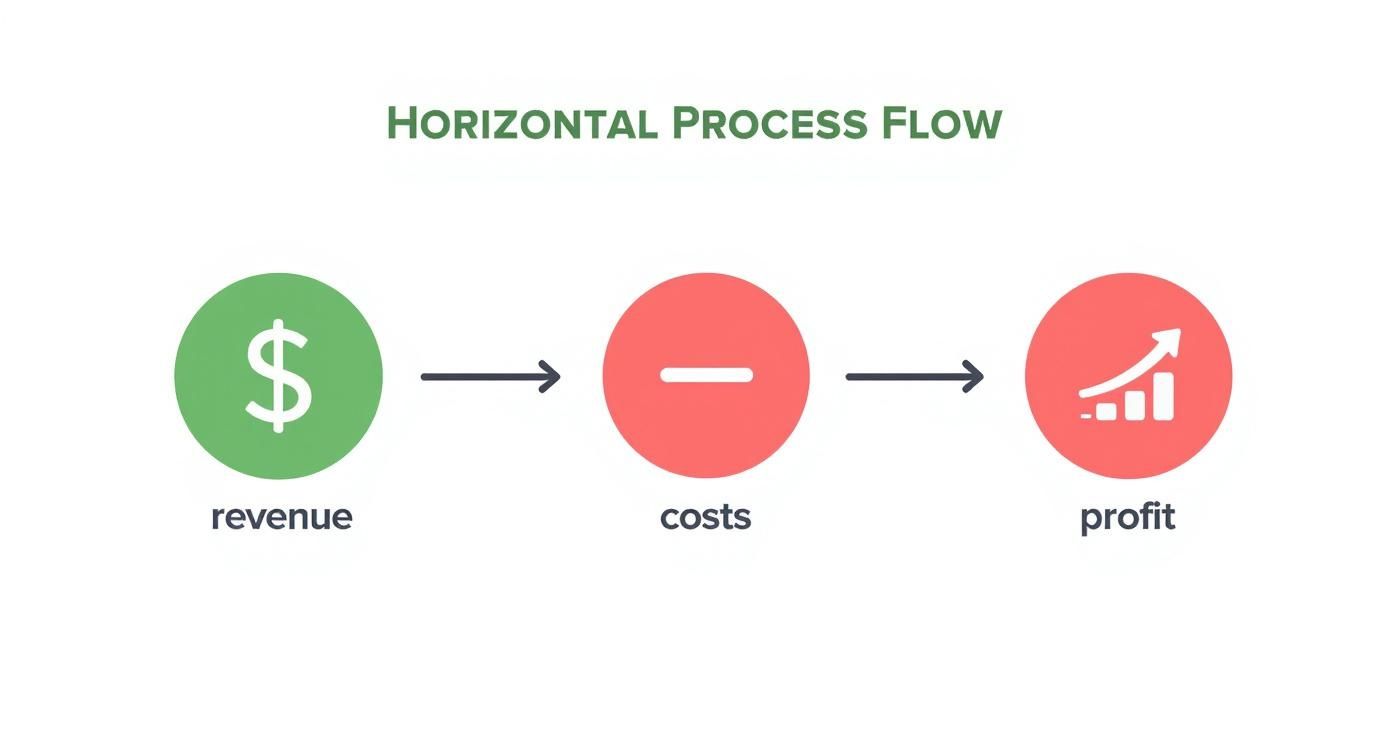
This visual boils it all down to the fundamental equation of profitability, showing how costs directly chip away at your gross earnings to reveal what you actually kept.
Understanding Gross Profit
The first major checkpoint on your P&L statement is Gross Profit. This is your top-line figure, representing the total profits from all your winning trades combined. It’s a simple sum of every successful trade before a single expense is taken out.
But here's the catch: while a high Gross Profit feels great, it's a vanity metric on its own. It tells you what you made, but it offers zero insight into what you kept. A trader can have a massive gross profit and still end up in the red once the costs of doing business are factored in. That's why we have to immediately move down the statement.
To get a clear picture, let's look at a simplified example of how these numbers flow together.
Anatomy of a Trading P&L Statement
| Line Item | Description | Example Amount |
|---|---|---|
| Gross Profit | Total gains from all winning trades during the period. | $1,500 |
| Total Losses | Sum of all losses from losing trades. | ($700) |
| Commissions & Fees | Brokerage charges for executing trades and other platform fees. | ($125) |
| Slippage | The 'hidden' cost from the difference between expected and actual execution prices. | ($50) |
| Net Profit / (Loss) | The final bottom-line figure after all costs and losses are subtracted. | $625 |
As you can see, the journey from that initial $1,500 gross profit to the $625 net profit is a story of deductions. Each cost plays a role in defining your true performance.
Accounting for the Costs of Trading
This is where the real analysis begins. Trading isn't free, and every expense, no matter how small, eats into your gross profits. These costs are usually broken down so you can see exactly where your money is going.
Key trading costs include:
- Commissions: These are the fees your broker charges to execute each trade. They might seem tiny on their own, but for an active trader, they add up faster than you'd think.
- Fees: This is a catch-all for other charges, like platform access fees, data feed subscriptions, or regulatory fees passed on to you.
- Slippage: This is a sneaky but significant cost. Slippage is the difference between the price you thought you’d get and the price where your trade actually filled.
A successful profit & loss analysis demands ruthless honesty. You have to account for every single cent that leaves your account, from the most obvious commission to the most subtle slippage cost.
Getting this level of detail right is crucial. Even on a macro scale, profitability can swing wildly. For instance, the securities industry on Wall Street saw its profits fluctuate dramatically over the decades. In 2023, NYSE brokers and dealers reported around $26.3 billion in profits, a figure that looks small next to the $44.5 billion peak in 2020. You can explore more data on industry profitability and see just how much market conditions can impact the bottom line.
Calculating Your Net Profit
After you’ve meticulously listed all your gains and subtracted every single cost, you arrive at the most important number on the entire statement: Net Profit. This is the ultimate scorecard for your trading.
Net Profit = (Total Gains from Winning Trades) - (Total Losses from Losing Trades) - (All Trading Costs)
This is your bottom line. It's the actual cash you earned after accounting for every win, every loss, and every expense. It’s not an estimate or a feel-good number; it's the definitive, non-negotiable result of your strategy and execution. Understanding this final number is the first step toward real performance improvement.
The Trading Metrics That Truly Define Success
Your P&L statement is the raw material. But the real gold—the insights that make you a better trader—is in the metrics you pull from it.
Just knowing your net profit is like knowing the final score of a football game without watching any of the plays. To actually improve your strategy, you have to dig into the key performance indicators (KPIs) that reveal how you won or lost.
A common trap for new traders is obsessing over their win rate. The truth is, a trader who wins only 40% of their trades can be incredibly profitable, while someone winning 70% of the time can bleed money. It's never just about how often you win; it's about how much you make when you're right versus how much you give back when you're wrong.
The Power of Profit Factor
One of the most telling metrics you can track is the Profit Factor. It's a beautifully simple number that directly answers the question: "How many dollars do I make for every dollar I lose?" It’s a pure measure of your strategy's efficiency.
The formula couldn’t be easier:
Profit Factor = Gross Profit (Total Winnings) / Gross Loss (Total Losses)
A Profit Factor over 1.0 means you're in the green. A score of 2.0, for instance, tells you that you make $2 for every $1 you lose—a very healthy edge. Most professional traders aim for a Profit Factor of 1.75 or higher. Anything below 1.0 is a clear signal that your strategy is losing money.
Average Win vs. Average Loss
This comparison gets right to the heart of your risk management. It pits the average size of your winners against the average size of your losers, telling you whether your strategy relies on many small wins or a few big ones. More importantly, it shows how well you’re cutting your losses.
Calculating it is simple:
- Average Win: Total profits from winning trades / Number of winning trades
- Average Loss: Total losses from losing trades / Number of losing trades
Imagine your Average Win is $300 and your Average Loss is $100. You've got a fantastic 3:1 ratio. This means you only need to be right more than 25% of the time just to break even, giving you a massive statistical cushion.
Now, flip it. If your Average Win is $50 and your Average Loss is $150, you’d need to win three out of every four trades just to stay afloat. That’s a high-pressure, exhausting way to trade.
Your primary goal as a trader isn't just to be right; it's to make significant money when you're right and lose very little when you're wrong. The relationship between your average win and average loss is the mathematical proof of this principle in action.
Understanding Your Trading Expectancy
If there's one "holy grail" metric, it's Expectancy. This number tells you exactly what you can expect to make—or lose—on average, for every single trade you take. It is the literal definition of having a statistical edge in the market.
The formula ties your win rate and reward/risk profile together:
Expectancy = (Win Rate x Average Win) – (Loss Rate x Average Loss)
Let's look at a trader with these stats:
- Win Rate: 45% (0.45)
- Loss Rate: 55% (0.55)
- Average Win: $500
- Average Loss: $200
Let's plug those numbers in: (0.45 x $500) - (0.55 x $200) = $225 - $110 = $115
This trader has a positive expectancy of $115 per trade. Even though they lose more often than they win, over the long run, they can expect to earn an average of $115 every time they put on a trade. This is the mathematical bedrock of a sustainable trading career.
Key Trading Performance Metrics from Your P&L
To make this easier to digest, here’s a quick-reference table summarizing the core metrics you should be tracking. These numbers will turn your raw P&L data into a powerful feedback loop for improving your trading.
| Metric | Formula | What It Tells You |
|---|---|---|
| Profit Factor | Gross Profit / Gross Loss | Measures the overall profitability and efficiency of your system. A value above 1.75 is considered strong. |
| Average Win | Total Winning Profits / # of Wins | Shows the typical size of your winning trades. Essential for understanding your reward potential. |
| Average Loss | Total Losing Losses / # of Losses | Reveals the typical size of your losing trades. Critical for evaluating your risk management. |
| Win/Loss Ratio | Average Win / Average Loss | Compares the size of your average winner to your average loser. A ratio above 2:1 is a healthy target. |
| Expectancy | (Win Rate x Avg. Win) – (Loss Rate x Avg. Loss) | The ultimate metric. It’s the average dollar amount you can expect to earn (or lose) per trade. |
By consistently calculating these KPIs, you move beyond guesswork and start treating your trading like a business. It's this deep dive into the numbers that separates amateur speculation from professional, data-driven trading.
For an even more in-depth look, check out our complete guide to master trading performance metrics for success.
Uncovering Hidden Patterns in Your Trading Data
Your trading history is a goldmine, but just knowing your total profit or loss is like knowing only the final score of a game—it doesn't tell you how you won or lost. To really level up, you need to move beyond a simple P&L statement and start slicing up your data. This is where you learn to read the map your own trading creates.
Think of your overall P&L as a satellite image. It shows you the big picture, the forests and the deserts. But to find the real treasure, you have to zoom in and examine the terrain. This means breaking your trading data into smaller, more meaningful buckets to see the patterns that are quietly driving your success or failure.
Slicing the Data for Deeper Insights
Segmentation is just a fancy word for breaking down your performance by different variables. Instead of asking, "Am I profitable?" you start asking much smarter questions. This is how you find your unique edge and, just as importantly, spot the specific habits that are bleeding your account dry.
Some of the most powerful ways to segment your P&L data include:
- By Time of Day: Do you crush it during the market open but give back all your gains in the slow afternoon chop? Your most profitable hours might surprise you.
- By Day of the Week: Lots of traders have a "bogey day." For many, it's Friday, when the pressure to end the week green leads to bad decisions.
- By Market Condition: How does your strategy hold up when volatility spikes? Comparing your P&L against an indicator like the VIX can be a huge eye-opener.
- By Asset or Sector: Are you a wizard with tech stocks but consistently lose money on energy? Knowing this helps you focus your firepower where it counts.
This kind of detailed breakdown turns your trading journal from a simple logbook into a serious diagnostic tool. If you need a place to start, our ultimate trading journal template excel guide is structured to help you perform this kind of deep-dive analysis.
From Observation to Actionable Rules
Finding a pattern is cool, but it's useless until you turn that insight into a hard-and-fast rule. This is the critical jump from being a passive analyst to an active strategist. It’s about letting the cold, hard evidence of your performance guide you, not gut feelings or market noise.
For example, if you discover you consistently lose money on Fridays after 2 PM, the solution is simple. You create a rule: "No new trades initiated after 2 PM on Fridays." This isn't a guess; it's a data-backed decision designed to protect your capital.
The whole point of a segmented P&L analysis is to build a personal trading playbook based on what your results prove actually works for you. It’s the ultimate form of data-driven self-awareness.
This process is also fantastic for spotting behavioral flaws. A classic discovery is when a trader's average loss is way bigger than their average win. That's the textbook sign of cutting winners short and letting losers run—a psychological leak that segmentation makes impossible to ignore. Seeing it in black and white is often the push you need to finally respect your stop-losses. Ultimately, good analysis should inform better choices, and digging into data-driven decision making strategies can completely reshape how you approach the markets.
Remember, the market itself is a beast of averages and extremes. Since 1928, the S&P 500 has averaged an annual return of 8.55%, but that smooth number hides incredible chaos. The index rocketed 30.88% in 1999, only to lose 23.78% in 2002 and then crater 36.61% in 2008. By finding the patterns in your own trading, you learn how to better navigate these wild market tides instead of being tossed around by them.
Profit & Loss Analysis in the Real World
Theory is great, but seeing a profit & loss analysis in action is where the lightbulb moments happen. To really bring these concepts to life, let’s get into the trenches with two very different traders. Their stories will show you how the exact same data can paint two completely opposite pictures of success and failure.
We're going to dissect their performance, pinpoint why they're getting the results they are, and lay out a clear, actionable game plan. This is the real power of a P&L review—it turns a confusing mess of numbers into a roadmap for getting better.
Trader A: The High Win-Rate Illusion
First, meet Trader A. On the surface, they look like a rockstar. They proudly point to a 75% win rate, and most days, their screen is filled with more green trades than red ones. But there's a huge problem: despite all the winning, their account is slowly bleeding out. They’re stuck on a frustrating treadmill, working hard but going nowhere.
A quick look at their P&L tells the whole story.
- Average Win: $80
- Average Loss: $400
- Win Rate: 75%
- Loss Rate: 25%
Let’s run the numbers and calculate their Expectancy per trade:
(0.75 x $80) – (0.25 x $400) = $60 – $100 = -$40
Even though they win three out of every four trades, Trader A has a negative expectancy of $40. This means that over the long run, every time they click the buy or sell button, they are statistically set up to lose $40. Their P&L uncovers a fatal flaw in their approach: they snatch profits way too early on their winners but let their losers run wild, praying for a comeback.
The numbers don't lie. For Trader A, a high win rate is a pure vanity metric. Just one catastrophic loss wipes out five of their hard-earned wins, making consistent profitability a mathematical impossibility.
The diagnosis couldn't be clearer. Trader A doesn't have a bad strategy for finding trades; they have a complete breakdown in risk management. The data is screaming at them to implement strict stop-losses and give their winning trades some room to breathe. Their entire focus needs to shift from the ego-boost of being right to the business of making money.
Trader B: Profitable While Being Wrong More Than Right
Now, let's turn to Trader B. If you just glanced at their win rate, you'd probably write them off as a mediocre trader at best. They only win 45% of the time, meaning they're wrong more often than they're right. Yet, against all odds, Trader B is consistently profitable, and their account is growing month after month.
Their P&L reveals a completely different, and much healthier, reality.
- Average Win: $500
- Average Loss: $200
- Win Rate: 45%
- Loss Rate: 55%
Let's do the same Expectancy calculation for them:
(0.45 x $500) – (0.55 x $200) = $225 – $110 = +$115
Trader B has an incredible positive expectancy of $115 on every single trade. Even though they lose more often, their disciplined approach ensures that when they win, they win big—far bigger than their losses. Their Profit Factor is a very healthy 2.05 (calculated from $9,000 in total wins / $4,400 in total losses, assuming 20 trades).
The lesson from Trader B is all about the immense power of a great risk-to-reward ratio. They've mastered the art of cutting losses without mercy and letting winners run. They understand a fundamental truth of trading: a few well-managed home runs will easily pay for the inevitable string of small, controlled strikeouts.
The Diagnostic Power of Comparison
Putting these two traders side-by-side really drives home the value of a proper profit & loss analysis. It elevates the conversation from the simple question of "Am I winning?" to the much more critical question of "Why?"
| Metric | Trader A (Unprofitable) | Trader B (Profitable) |
|---|---|---|
| Win Rate | 75% (Deceptively high) | 45% (Seemingly low) |
| Avg. Win / Avg. Loss | 1:5 (Catastrophic) | 2.5:1 (Excellent) |
| Expectancy | -$40 per trade | +$115 per trade |
| Core Issue | Poor risk management | N/A (Disciplined) |
Trader A's data is a five-alarm fire demanding an immediate overhaul of their exit strategy and risk controls. Trader B's data validates their disciplined approach, giving them the confidence to stick to their plan. Both conclusions are drawn not from gut feelings or what the market did yesterday, but from the cold, hard evidence of their own performance. This is how you build a sustainable career in trading.
Common P&L Analysis Mistakes to Avoid
Even the most perfect data is useless if it leads you to the wrong conclusions. A profit and loss analysis is an incredibly powerful tool for any trader, but only if you use it correctly. Too many traders, especially when they're starting out, fall into predictable traps that completely sabotage their efforts to improve.
Steering clear of these common mistakes is the first step toward building a truly objective, data-driven mindset.
One of the most frequent errors I see is an obsession with the win/loss ratio. Look, it feels good to win often, but this metric means almost nothing without context. A trader can win 80% of their trades and still bleed money if their few losses are catastrophic blow-ups. The real story is always told by the relationship between your average win and your average loss.
Another critical oversight is ignoring the "invisible" costs of trading. Commissions are obvious, but the impact of slippage—the gap between the price you thought you'd get and the price you actually got—can be a silent account killer. Failing to track these expenses gives you an inflated sense of profitability and masks how your strategy is truly performing.
Drawing Conclusions from Small Sample Sizes
Perhaps the most dangerous mistake is making huge strategic changes based on a small handful of trades. A winning streak over ten trades feels fantastic, but it's not statistically significant. It could easily be a run of good luck rather than proof of a brilliant new edge.
Drawing firm conclusions from a small, statistically insignificant sample of trades is one of the fastest ways to engage in costly self-deception. You need a large enough data set—often 100 trades or more—before patterns become reliable.
Without a substantial sample size, you risk abandoning a sound strategy after a completely normal losing streak. Even worse, you might double down on a flawed strategy that just got lucky. Patience is a non-negotiable part of effective P&L analysis.
Letting Emotions Drive Interpretation
Finally, traders constantly fall prey to recency bias, letting the outcome of their last few trades disproportionately color their mood and decisions. A big loss can make you gun-shy and overly timid, while a big win can lead to overconfidence and sloppy execution on the very next trade. Your P&L analysis should be a tool for objective review, not an emotional rollercoaster.
To combat these pitfalls, you have to approach your data like a scientist:
- Focus on a large data set: Wait until you have enough trades to actually trust the patterns you're seeing.
- Account for every single cost: Include commissions, fees, and estimated slippage to find your true net profit.
- Prioritize the right metrics: Value metrics like Profit Factor and Expectancy over a simple win rate.
History shows us that markets have always been defined by dramatic swings. Over the last century, global stock markets have delivered positive real returns but have also been rocked by severe downturns. During the Great Depression, for example, the U.S. market lost a staggering 79% of its value. You can discover more about these historic market shifts to really grasp why a long-term, data-driven perspective is so essential.
Avoiding these common mistakes ensures your analysis reflects reality, not just your emotions or random chance.
Common Questions About P&L Analysis
As you start digging into your profit & loss statements, a few practical questions always pop up. It's totally normal. Getting these sorted out early helps you build a solid, repeatable routine for checking in on your performance. Let’s tackle the ones I hear most often from traders.
One of the first things people wonder is how frequently they should be doing a full-blown P&L review. There’s no magic number, but balance is everything. For most active traders, a weekly review hits the sweet spot. It’s often enough to catch problems before they snowball but not so frequent that you’re just reacting to the market's daily mood swings. A deeper, more strategic monthly analysis is then perfect for spotting the bigger-picture trends in your trading.
Realized vs. Unrealized P&L
Getting your head around the difference between realized and unrealized P&L is non-negotiable for an accurate analysis. It's actually pretty simple.
- Realized P&L: This is the money in the bank (or out of it). It’s the final score from trades you’ve already closed. The profit or loss is locked in, and it's reflected in your account balance.
- Unrealized P&L: Think of this as "paper" profit or loss. It’s the fluctuating value of your open positions. This number changes with every tick of the market and means nothing until you actually close the trade.
When you sit down to do a formal P&L analysis, you should only ever look at your realized P&L. Getting bogged down in unrealized figures is a classic rookie mistake that leads to emotional decisions, like cutting a good trade short just to lock in a small gain. That kind of thinking completely skews your ability to judge your strategy.
Choosing the Right Tools for the Job
The tools you use can make or break your analysis. What’s right for you really depends on how often you trade and just how deep you want to go.
If you're just starting out or don't trade too often, a simple spreadsheet can get the job done. You can log your trades manually and use basic formulas to track key metrics like your Profit Factor and Expectancy. It's a fantastic way to learn the nuts and bolts of performance tracking.
But if you're serious about this, dedicated trading journal software is a much smarter move. These platforms automate all the tedious data entry, calculate dozens of performance stats in a flash, and let you filter your results in powerful ways. You can slice and dice your data by time of day, by asset, or by strategy, saving you a massive amount of time and uncovering patterns you'd never see in a spreadsheet.
Ready to upgrade your trading toolkit? ChartsWatcher delivers the professional-grade scanning and analysis features you need to find better opportunities and track your performance like a pro. Discover how ChartsWatcher can sharpen your trading edge.
