Pivot Point Trading: Your Complete Guide to Market Success
What Pivot Points Really Mean for Your Trading
Imagine a busy intersection in a city. The traffic lights—red, yellow, and green—don't have magical powers, but they work because every driver agrees to follow the same rules. Pivot points in trading operate on a similar principle. They are specific price levels that a huge number of traders are watching at the same time, from individual day traders to large institutional firms.
Their power comes from a simple but potent concept: the self-fulfilling prophecy. When everyone anticipates a certain price level will act as a barrier (resistance) or a floor (support), their collective actions—selling at resistance, buying at support—create the very market behavior they expected. This is the foundation of pivot point trading. These price zones act like magnets for buying and selling pressure, helping to shape a stock's movement.
The Psychology Behind the Lines
At its core, a stock chart is a visual story of the constant tug-of-war between buyers (bulls) and sellers (bears). Pivot points give us a framework to understand this battle. They are calculated from the previous day's high, low, and closing prices, creating a psychological reference point for the current trading session.
For instance, as a stock's price climbs toward a resistance level like R1, traders who bought lower might see it as a perfect opportunity to lock in profits, which adds to the selling pressure. At the same time, traders who are bearish might view it as an ideal entry for a short sale. This shared mindset is what gives these simple mathematical lines their real-world influence on the market.
How Are They Determined?
One of the great things about pivot points is that they are calculated objectively, taking emotion out of the initial analysis. They are mathematically derived price levels that traders use to map out potential areas of support and resistance.
The most common method, the five-point system, starts by finding the central Pivot Point (PP). This is done by averaging the high, low, and closing prices from the prior trading day. From this central pivot, additional support (S1, S2) and resistance (R1, R2) levels are projected outwards. You can learn more about the formulas behind this type of predictive analysis on Investopedia.com.
To help clarify what each of these levels means, the table below breaks down the five key components and how traders typically interpret them.
Pivot Point Components and Their Market Significance
A breakdown of the five key pivot point levels and their typical trader interpretations
| Level | Calculation Method | Trading Significance | Typical Price Action |
|---|---|---|---|
| Pivot Point (PP) | (Previous High + Low + Close) / 3 | The central balance point for the day. It gauges overall sentiment. | Price action above the PP is generally seen as bullish, while trading below it suggests bearish control. |
| Resistance 1 (R1) | (2 * PP) - Previous Low | The first major ceiling the price must break through to move higher. | Sellers often become active here, which can cause the price to stall, pull back, or reverse. |
| Resistance 2 (R2) | PP + (Previous High - Previous Low) | A secondary, stronger resistance level if R1 is convincingly broken. | This level often represents a point where bullish momentum could become exhausted. |
| Support 1 (S1) | (2 * PP) - Previous High | The first major floor that could stop a price decline. | Buyers tend to step in around S1, potentially causing the price to bounce higher. |
| Support 2 (S2) | PP - (Previous High - Previous Low) | A secondary, stronger support level if S1 fails to hold. | A critical area where a significant sell-off might finally find its bottom. |
Ultimately, successful pivot point trading isn't just about drawing lines on a chart. It’s about learning to read the market's story as it interacts with these important price levels.
Calculating Pivot Points That Actually Matter
To get the most out of pivot point trading, we need to move from theory to practice and look at how these levels are calculated. The formulas might look a bit complex at first, but they are surprisingly simple. The idea is to use yesterday's price data—the high, low, and close—to create a reliable map for today's trading session.
Think of it like this: you're using three key landmarks from yesterday's journey (the highest point, the lowest point, and where you ended up) to forecast today's most likely resting spots and turning points.
Let's use a real-world example. Suppose a stock had the following prices yesterday:
- High: $110
- Low: $100
- Close: $105
The first and most crucial calculation is for the central Pivot Point (PP). This level serves as the day's primary balance point. The formula is a simple average of the three key prices:
PP = (High + Low + Close) / 3
Using our numbers, the calculation is: PP = ($110 + $100 + $105) / 3 = $105.
This central pivot acts as the foundation from which all other support and resistance levels are built. The infographic below shows how this calculation transforms raw price data into actionable levels for a trader's daily prep.
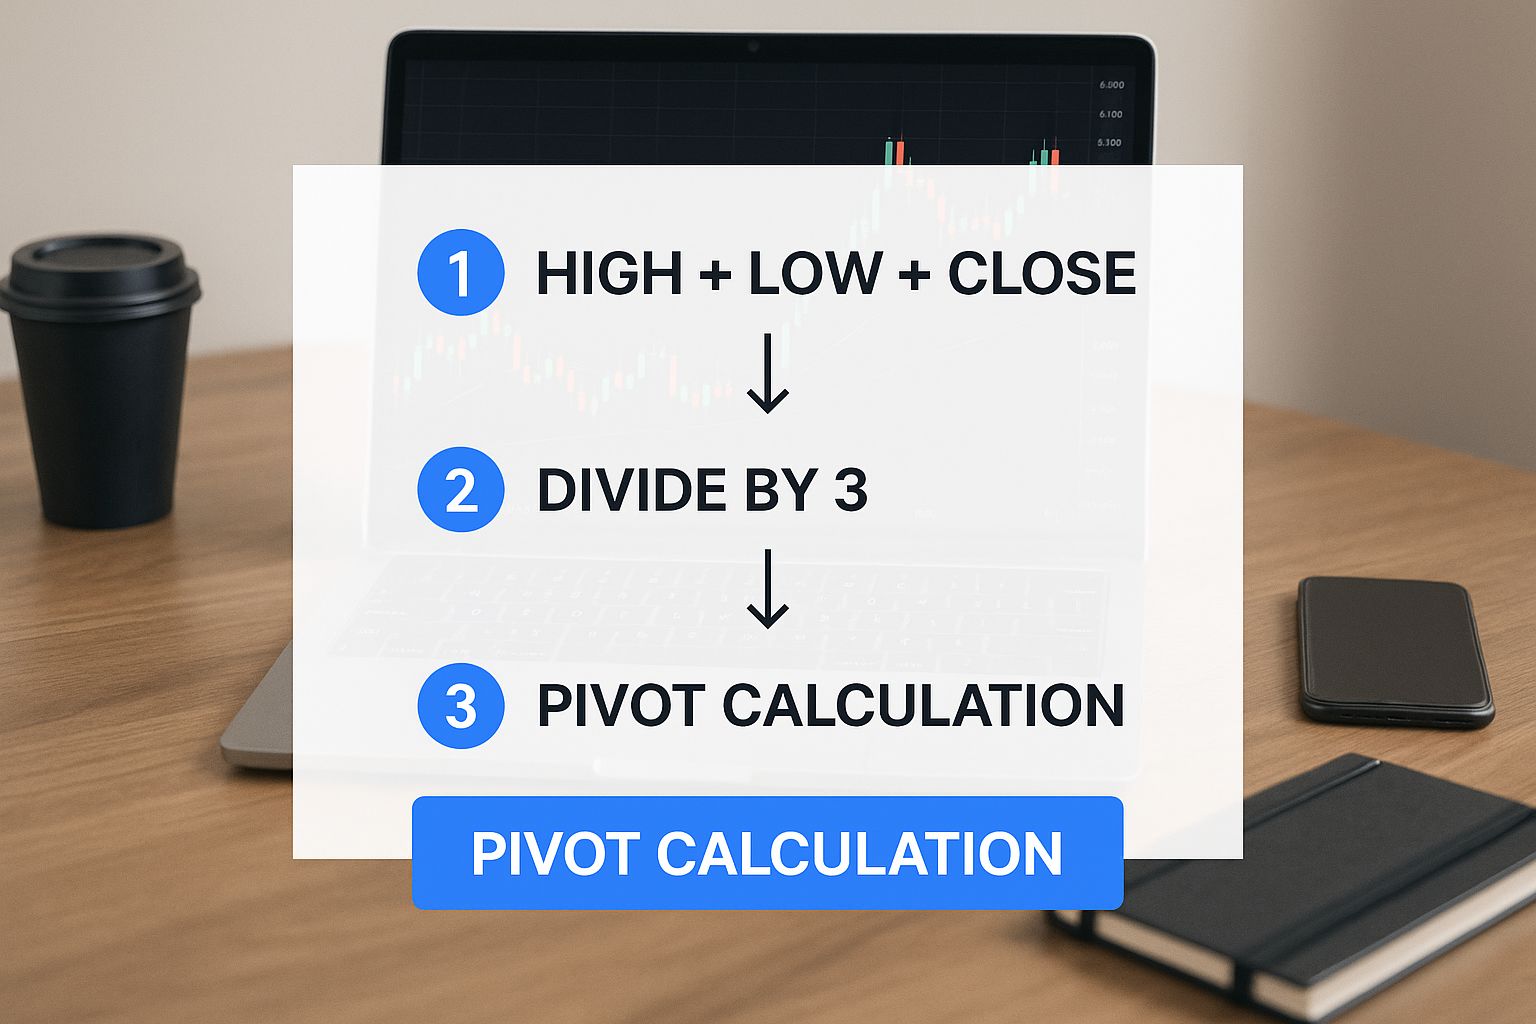
As the image shows, a trader's workflow involves taking historical data, applying formulas, and projecting key zones for the upcoming session. From the central pivot, traders calculate support and resistance levels. You can find more details on these predictive calculations and their applications on Investopedia.
To give you a clearer picture, here's a detailed walkthrough of the complete calculation process using our example data.
| Step-by-Step Pivot Point Calculation Example |
|---|
| Complete calculation walkthrough using real market data to demonstrate the formula in action |
| Step |
| 1. Calculate Pivot Point (PP) |
| 2. Calculate Resistance 1 (R1) |
| 3. Calculate Support 1 (S1) |
| 4. Calculate Resistance 2 (R2) |
| 5. Calculate Support 2 (S2) |
This table shows how just three pieces of data can generate five distinct, actionable price levels for the current trading day, providing a clear and objective framework for making decisions.
Timing Conventions and Calculation Periods
What often separates experienced pivot traders is their understanding of timing conventions. The high, low, and close values you use are not universal; they depend on the market you're trading. For example, the New York Stock Exchange (NYSE) has an official close at 4:00 PM EST. In contrast, the 24-hour forex market has no single "official" close, so many traders adopt 5:00 PM EST as the standard.
These seemingly small differences are important because they affect the pivot levels that the majority of market participants are watching. If your pivot points are calculated using a different closing time, your levels will be slightly off, making your analysis less aligned with the market consensus.
Equally important is choosing the right calculation period for your trading style.
- Daily Pivots: Calculated from the previous day's data, these are the standard for day traders looking for short-term opportunities. They provide a fresh set of levels for each new trading session.
- Weekly Pivots: Calculated from the prior week's high, low, and close, these are great for swing traders. They offer a wider view of the market structure and help identify more significant, longer-term support and resistance zones.
By understanding both the "how" of the calculation and the "why" of the timing, you can generate pivot levels that are truly meaningful and aligned with broader market activity.
From Jesse Livermore to Today’s Trading Floors
To understand the lasting power of pivot points, we need to travel back more than a century to meet one of history’s most famous traders: Jesse Livermore. Long before computers crunched numbers, Livermore observed a pattern in the market. He saw that certain price levels acted like invisible tripwires, often sparking big moves in a stock's direction. He famously called these areas "pivotal points," and his talent for spotting them became legendary.
The core idea Livermore uncovered through keen observation is the same one that powers modern pivot point trading. The market seems to have a memory, where yesterday's significant price action sets the stage for today's trading. It's a principle that has proven its worth time and again.
The Evolution of a Timeless Concept
The technique's origins date back to Livermore's work in the early 20th century. He realized that major trend changes often kicked off right after a stock hit one of these critical price zones. You can learn more about these historical beginnings of pivot analysis on TraderLion.com. This simple but powerful insight not only survived the chaos of the 1929 market crash but also adapted to new trading eras.
Jump ahead to the loud, energetic trading pits of the 1980s. Floor traders, equipped with just pocket calculators and notepads, relied heavily on daily pivot calculations to make sense of the fast-paced environment. These levels provided a quick, objective guide to the day's likely high and low points.
From Trading Pits to Algorithmic Systems
Today, this classic technique is more relevant than ever. What began as Livermore's intuitive "pivotal points" has evolved into precise mathematical formulas built into charting platforms everywhere. Yet, the central concept is unchanged:
- Yesterday’s price action draws today’s lines in the sand.
- Specific, calculated levels tend to attract focused buying and selling pressure.
- These levels act as a shared map for millions of traders and investors.
Even today's complex algorithmic trading systems and high-frequency trading firms build pivot point logic into their models. They capitalize on the self-fulfilling prophecy these levels create. When a huge number of market participants—both human and machine—are all watching the same prices, those prices become incredibly significant. This journey from a trader's gut feeling to a staple of modern financial technology shows why pivot point trading remains a key strategy for traders.
Pivot Point Strategies That Actually Work
Theory is one thing, but putting it into practice is where you truly make strides in pivot point trading. The real skill is knowing which strategy to use for the current market environment. It's not about finding a single secret formula, but rather having a flexible toolkit ready for whatever the market decides to do.
The Pivot Bounce Strategy
Picture a tennis ball being volleyed back and forth. That's the essence of a ranging market, where the price bounces between clear support and resistance levels. The pivot bounce strategy is built for these sideways movements. The aim is straightforward: buy near a support level (like S1 or S2) and sell near a resistance level (like R1 or R2).
The core concept is simple:
- Entry: When the price drops to a support level like S1 and shows signs of turning around (for instance, by forming a bullish candlestick pattern), a trader might open a long position.
- Exit: The profit target is usually set at the next resistance level up, which could be the central pivot point (PP) or R1.
This strategy works best in predictable, stable markets. However, its success depends entirely on correctly identifying a market that is genuinely range-bound and not just taking a breather before a big move. The most common mistake is misreading the market's condition. A great way to confirm is to see if the price has consistently respected previous pivot levels during the trading session.
The Pivot Breakout Strategy
Now, imagine a powerful river bursting through a dam. This is what a breakout looks like in a trending market. The pivot breakout strategy is for those moments when price momentum is so strong it smashes through a support or resistance level, signaling that the trend is likely to continue.
Here’s how a typical trade might be set up:
- Entry: A trader might go long when the price decisively breaks above a resistance level like R1. A "decisive" break often means the move happens on high volume and a full candle closes above the level.
- Exit: The profit target is generally the next pivot level in the direction of the trend, such as R2.
The biggest hurdle with this approach is dodging false breakouts—when the price pokes through a level for a moment, only to quickly reverse. To improve their chances, experienced traders often wait for confirmation. This could mean waiting for the price to pull back and retest the broken level as new support before jumping in. Using volume analysis can also help filter out weak breakouts, as real moves are usually backed by a significant increase in trading activity.
By understanding both the bounce and breakout strategies, you can adapt your approach whether the market is calmly ranging or moving with powerful momentum.
Protecting Your Capital in Pivot Point Trading
Even the sharpest pivot point trading strategy will have its share of losing trades. It's a tough pill to swallow, but markets are unpredictable. Without a disciplined approach to managing risk, just a few bad trades can wipe out weeks of carefully earned profits.
Successful traders operate on a simple principle: protect your capital first, and profits will follow. Guarding your trading account isn't just a good idea; it's the absolute foundation for a lasting career in the markets.
Setting Intelligent Stop-Losses
Think of a stop-loss as your safety net. Where you place it is critical. Set it too close to your entry, and you risk getting knocked out by normal market "noise" before the trade has room to breathe. Set it too far, and you're opening the door to a massive loss. Pivot points provide a logical map for placing these safety nets.
For instance, if you decide to buy a stock as it bounces off the S1 support level, a sensible spot for your stop-loss would be just underneath S1. This placement is tied directly to your trade's logic: you're betting that S1 will act as a floor. If that floor breaks, the reason for your trade is gone, and it’s time to get out. This approach connects your risk directly to the market structure outlined by the pivot levels.
Position Sizing and Pivot Levels
How much you risk on any single trade is just as vital as your entry and exit points. A frequent error is to trade a fixed number of shares every single time, no matter what the setup looks like. A much more effective method is to adjust your position size based on the distance between pivot levels.
Here’s how you can do it:
- Decide Your Risk: First, choose a fixed percentage of your account you're willing to risk on one trade. A common standard is 1%.
- Figure Out the Stop Distance: Next, measure the dollar amount between your entry point and your stop-loss. For example, if you enter at S1 and your stop is just below it, calculate that difference.
- Calculate Your Position Size: Finally, divide your maximum risk amount (your 1%) by the per-share risk (the stop distance).
This method ensures you risk the same percentage of your capital on every setup, which helps you withstand the inevitable losing streaks that all traders experience. For a deeper dive into building a solid risk framework, our guide on mastering day trading risk management offers more detailed strategies.
By weaving risk management directly into your pivot point trading analysis, you build a durable system that can handle market swings and protect your capital for the long run.
The Truth About Pivot Point Performance
It's tempting to search for a "perfect" trading indicator, but we need to have an honest conversation about how pivot point trading actually holds up in real markets. While these levels are popular and offer a solid framework for viewing price action, their effectiveness isn't a sure thing. A closer look reveals a more complex picture where performance shifts based on the market's mood.
Despite their common use, backtesting of pivot point strategies across major markets like the S&P 500, Nasdaq, and the USD/CHF forex pair has raised questions about their ability to be profitable on their own. A 2024 study that examined six different pivot point strategies showed that none of them generated reliable, repeatable trading gains across these varied markets. You can read the full research about these pivot point strategy findings to dig into the data yourself.
This doesn't make pivot points worthless; it just confirms they aren't a magic wand. Their dependability is heavily tied to the current market environment.
Favorable vs. Unfavorable Market Conditions
Knowing when to trust pivot points is the key to using them well.
-
When They Work Best: Pivot points shine in quiet, range-bound markets. In these conditions, where prices drift without a strong directional push, they often bounce predictably between support (S1, S2) and resistance (R1, R2) levels. This is when the self-fulfilling prophecy is strongest, as many traders are watching the same levels without major news to disrupt the pattern.
-
When They Often Fail: During strong, trending markets or periods of high volatility driven by major economic news, pivot points become far less reliable. A powerful trend can slice through multiple pivot levels without even slowing down. In these situations, using pivots to spot breakout trades might work, but counting on them for bounces can lead to substantial losses.
The Takeaway for Smart Traders
The reality is that successful pivot point trading is about more than just drawing lines on a chart. It requires context. The best traders never use pivots in a vacuum. Instead, they combine them with other types of analysis—such as volume, candlestick patterns, or moving averages—to confirm or reject a potential trade.
This layered approach helps build a more durable strategy that can adjust to changing market dynamics. It's how you separate the high-probability setups from the costly traps.
Advanced Pivot Point Techniques for Serious Traders
Moving beyond basic bounce and breakout strategies is what separates consistent traders from the crowd. To gain a real edge, you need to layer multiple sources of information to build a stronger case for each trade.
One of the most powerful combinations is pairing pivot levels with volume analysis. Think of it like this: if a stock approaches a key support level and a huge wave of buying volume comes in, it's a strong signal that big players are defending that price. This makes a reversal much more likely. On the flip side, a breakout on very low volume is often a red flag, signaling a potential fake-out.
Another professional technique is multi-timeframe analysis. A day trader might see a stock nearing its daily R1 resistance. By also plotting the weekly and even monthly pivot points, they can spot areas of confluence—where multiple pivot levels from different timeframes cluster together. For example, if the daily R1 at $105 also happens to be the weekly pivot point, that price level gains enormous significance. It becomes a much tougher barrier for the price to break through.
Asset-Specific Adjustments
Not all assets dance around pivot points in the same way. It's vital to adapt your approach based on what you're trading:
- Large-Cap Stocks: These often show more predictable behavior around pivot levels. Why? High liquidity and a massive number of institutional traders are all watching the same key levels.
- Forex Majors: Currency pairs are driven by the 24-hour news cycle and session overlaps (like London/New York). This can make their interaction with pivot points more dynamic and fast-moving.
- Commodities: Assets like oil and gold often have more respect for longer-term weekly and monthly pivots, as they are swayed by broader supply and demand fundamentals rather than just daily noise.
The chart below shows how daily pivot levels can provide a clear roadmap for intraday price action.
Here, you can see how the price interacts with the calculated pivot (P), support (S1), and resistance (R1) levels throughout the trading day. These levels offer clear potential zones for entries and exits.
For serious traders looking to deepen their analytical toolkit, exploring predictive models like LSTM time series forecasting can offer another layer of insight, complementing traditional pivot point calculations. Before you commit real money to these advanced methods, it's essential to prove their effectiveness. You can find a complete guide on how to backtest a trading strategy to ensure your system is solid under historical market conditions.
Ready to find high-probability setups across the market? ChartsWatcher’s advanced scanners can help you pinpoint assets interacting with key pivot levels in real-time. Start your free trial today and gain a professional edge.
