Oversold Stock Meaning A Professional Trader's Guide
When you hear a stock is oversold, what comes to mind? Many traders mistakenly think it means the stock is "cheap" or a bargain hiding in plain sight. That's not quite right.
An oversold stock is simply one that has been hammered by intense, relentless selling. The price has dropped so far, so fast, that the sellers are likely running out of steam.
Think of it like stretching a rubber band. The further you pull it, the more tension builds, and the more powerful the inevitable snap-back will be. An oversold signal is the technical equivalent of that rubber band being stretched to its absolute limit.
What An Oversold Signal Truly Means
Let's be clear: an oversold condition is a technical signal, not a judgment on the company's value. It's all about momentum. When a stock becomes oversold, it's a sign that the selling pressure has become excessive and is probably unsustainable. This creates a high-probability setup for a short-term price reversal or at least a relief rally.
This isn't about perfectly timing the bottom—that's a fool's errand. Instead, it’s about using data to spot moments when the selling momentum is statistically overextended. Traders lean on specific technical indicators to pinpoint these moments with a much higher degree of confidence.
The Data Behind the Bounce
Trading oversold signals isn't just wishful thinking; it's a strategy with a historical edge. Indicators like the Relative Strength Index (RSI) are classic tools for this, flagging a stock as oversold when the reading dips below 30.
But let's look at some hard numbers. Backtests on the S&P 500 have shown that when its 3-day RSI falls below 20—a sign of truly extreme selling—the market often rebounds sharply. A simple strategy built around this signal produced a 75% win rate and a compound annual growth rate of 7.6% over hundreds of trades.
An oversold condition represents an opportunity where the risk-to-reward ratio for a bullish trade becomes favorable, not because the company is suddenly better, but because the selling has likely gone too far.
Of course, if you're just getting your feet wet in the markets, diving into technical indicators can feel overwhelming. Before you get too deep into chart analysis, it's wise to get the basics down. This excellent beginner's guide to stock market investing is a great place to build that solid foundation. Understanding the bigger picture is key to putting technical signals like these into the right context.
The Trader's Toolkit For Spotting Oversold Conditions
Finding a genuinely oversold stock takes more than just a gut feeling. It requires a specific set of tools designed to measure just how stretched a stock's price has become. Think of these technical indicators as your dashboard, giving you data-driven clues that the sellers might finally be running out of gas.
No single indicator is a magic bullet, but when you see several of them flashing the same signal, you start to build a powerful case. A solid toolkit also means having a good grasp of the market environment, like understanding stock volatility, which gives you the context needed to read these signals correctly. The goal is to spot high-probability setups where the risk-to-reward ratio is tilted heavily in your favor.
The Relative Strength Index (RSI)
The Relative Strength Index, better known as RSI, is a classic momentum oscillator you’ll find in almost every trader's arsenal. It measures the speed and magnitude of recent price changes on a simple scale from 0 to 100. You can think of it as a stock's internal power gauge.
The traditional rule of thumb is that an RSI reading below 30 signals an oversold condition. Now, this isn't a blind "buy" signal. It's more of a heads-up that the recent downtrend has been so sharp that sellers might be getting exhausted, making a bounce more probable.
The Stochastic Oscillator
The Stochastic Oscillator is another momentum indicator that serves a similar purpose to the RSI but gets there in a different way. It compares a stock's closing price to its price range over a set period, also on a scale of 0 to 100.
For the Stochastic, a reading below 20 suggests the stock is trading near the very bottom of its recent range and could be oversold. It’s another clue that the downward push is losing its force. If you want to go deeper, check out our guide on using oversold and overbought indicators to time your trades.
The core idea behind both RSI and Stochastics is that a stock's price can only fall so far, so fast, before it becomes statistically likely to experience a rebound, even if it's only a temporary one.
Bollinger Bands and Price Extremes
Bollinger Bands are a fantastic visual tool. They consist of three lines on a price chart: a middle band (usually a 20-period moving average) and two outer bands that represent how far the price has strayed from that average. The bands expand when things get volatile and contract when the market is quiet.
An oversold signal pops up when the price hits or, even better, dips below the lower Bollinger Band. This tells you the price has moved a statistically significant distance from its recent average and might be due for a snap-back toward the middle. It’s a clean, visual way to spot price extremes.
Spotting Bullish Divergence
This is one of the most powerful signals in a technical trader's playbook: bullish divergence. This pattern appears when the stock's price makes a new low, but a momentum indicator like the RSI or Stochastic Oscillator fails to follow suit. Instead, the indicator prints a higher low.
This "divergence" between the price action and the underlying momentum is a strong hint that selling pressure is quietly drying up. Even as the price chart looks weak, the engine driving the trend is starting to sputter and turn. It’s a subtle but critical signal that the pros are always watching for.
How To Avoid The Most Common Trading Traps
An oversold signal can feel like an invitation to print money. In reality, it's often a siren's call luring you straight into a costly mistake. The most dangerous pitfall here is the classic value trap—a stock that looks incredibly cheap and oversold but just keeps on falling. To really understand what an "oversold stock" means, you have to look beyond a single indicator and see the whole picture.
Let's be clear: not every oversold signal is the same. A stock that plummets into oversold territory after a disastrous earnings report is worlds apart from one that's simply pulling back during a healthy, established uptrend. The first scenario is a trap. The second is a potential opportunity. It all comes down to context.
Look For Confirmation Before You Leap
Jumping into a trade the moment RSI dips below 30 is a rookie move and a recipe for disaster. Experienced traders know better. They layer multiple pieces of evidence to build a strong, convincing case for a reversal before they even think about clicking the "buy" button.
Think of it as being a detective. You wouldn't close a case based on one clue, would you? You need to find confirmation from other sources to validate that buying pressure is actually returning to the stock. Without that, you’re not trading; you’re just gambling on a hunch.
Here are the essential confirmation signals to look for:
- Bullish Price Action: Don't just trust the indicator; wait for the price itself to show you signs of life. This could be a bullish candlestick pattern, like a hammer or an engulfing candle, which is a clear visual sign that buyers are stepping in to defend a price level.
- A Spike in Volume: A sudden jump in buying volume is a huge tell. It suggests that institutional money might be flowing in, adding serious conviction to the potential reversal. Bounces that happen on low volume are often weak, flimsy, and untrustworthy.
- Alignment with a Support Level: Where is this oversold signal happening on the chart? If it lines up with a historically significant support level—a price floor that has held up in the past—the signal becomes far more reliable than one that just appears in the middle of nowhere.
A confirmed signal is one where price action, volume, and location on the chart all tell the same story. An oversold reading without these supporting elements is just noise, not a high-probability setup.
The Critical Role Of Multi-Timeframe Analysis
One of the easiest traps for new traders to fall into is getting tunnel vision on a single timeframe. A stock might look like a screaming buy on the 15-minute chart, but if you zoom out to the daily chart, you might see it’s just started a massive, powerful downtrend.
Trying to catch that tiny bounce is like trying to stop a freight train with a fishing net. It’s not going to end well.
Always, always check the higher timeframes to get a handle on the dominant, underlying trend. An oversold signal carries so much more weight when it aligns with the primary market direction. A perfect example is seeing an oversold reading on the hourly chart during a pullback within a strong daily uptrend. That’s a classic, high-probability setup.
This disciplined, multi-layered approach is what separates consistently profitable traders from those who get burned by every false signal.
Finding Oversold Stocks With A Professional Scanner
Knowing what an oversold stock is and actually finding one in the wild are two very different things. Let's be honest, manually sifting through thousands of tickers is a fool's errand. This is where a professional-grade scanner like ChartsWatcher comes in, turning your theoretical knowledge into a practical, automated edge.
Instead of hunting for setups one chart at a time, you can build a custom scan that does all the heavy lifting for you. It filters the entire market in real time for stocks that meet your exact oversold criteria, handing you a clean, actionable watchlist in seconds.
Building A Custom Oversold Scan
Let's walk through a practical example. A really powerful oversold scan might combine two key indicators to boost the signal's reliability. The goal here isn't just to find stocks that have been sold off, but to pinpoint those that are at a point of statistical price extension—where the rubber band is stretched tight.
You could set up a scan with these specific rules:
- RSI (14) is below 25: This first filter immediately narrows the universe of stocks down to only those facing intense, recent selling pressure.
- Price is touching or below the Lower Bollinger Band (20,2): This second layer acts as confirmation. It flags stocks that have strayed a statistically significant distance from their recent average price.
Running this scan finds stocks where selling momentum is likely exhausted and the price is stretched to a potential snapping point. This dual-filter approach helps weed out weaker signals, focusing your attention on the highest-probability reversal candidates. Once the scan is built, you can set up real-time alerts so you never miss a setup. To dive deeper into this, check out our trader's guide to real-time stock scanning.
To refine your process even more, this visual flow shows the key steps: first, spot a signal; next, seek out confirmation; and finally, always check the overarching trend.
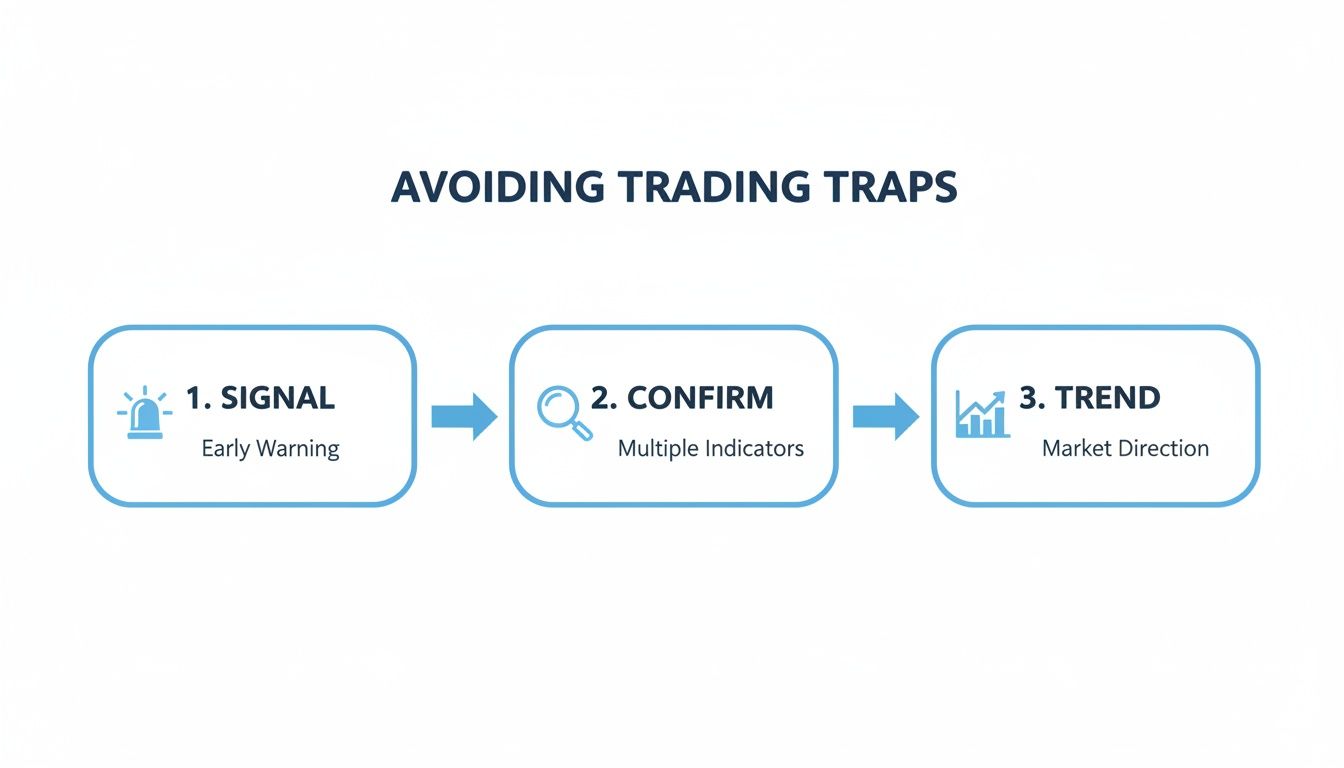
This simple three-step process—Signal, Confirm, Trend—is a powerful mental model for sidestepping common trading traps and making sure you only act on the most robust setups.
Validating Your Strategy With Backtesting
So, how do you know if your custom scan actually works? This is where you separate speculation from data-driven confidence. The most critical feature of any professional platform is the ability to backtest your strategy against historical data.
This is where the magic happens. A backtesting tool lets you see exactly how your oversold strategy would have performed in the past, giving you a crystal-clear picture of its historical win rate, profitability, and drawdown.
By running your criteria through a backtest, you can answer crucial questions like, "How did this strategy hold up during the last market correction?" or "What was the average profit per trade?" This is how you validate your approach before you risk a single dollar of your capital.
A strategy without a positive backtest is just an unproven hypothesis. Data-driven validation is what separates professional trading from guesswork.
For instance, our own backtesting shows that scanning for an RSI below 20 on S&P 500 stocks has historically produced significant returns, especially in volatile markets. In the post-2020 recovery periods, these setups often preceded major rallies and demonstrated impressive performance metrics, offering a real, quantifiable edge.
Executing Trades With A Clear Risk Management Plan
Finding a promising oversold setup is a great skill to have, but honestly, it’s only half the battle. The real gap between amateur speculation and professional trading is what you do after you enter the trade. A solid plan for execution and risk management is what turns a good signal into consistent profit.
Without clear rules for getting in, getting out, and protecting your capital, even the most brilliant technical analysis will fall flat. The framework you build around your analysis is what truly dictates your success in the long run. This is how you move from making a reactive guess to executing a repeatable, strategic process.
Smart Entry Tactics
One of the biggest mistakes I see traders make is jumping in the second an indicator like the RSI flashes "oversold." That's the classic definition of trying to catch a falling knife. Instead, the pros wait for the price action itself to confirm that buyers are actually showing up and the downward slide has at least paused.
Patience is your greatest asset at the entry point. An oversold signal is the alert, not the command to buy. Wait for the market to prove your thesis right before committing capital.
Look for a concrete sign of a reversal before you pull the trigger. This could be something like a bullish engulfing pattern, where a big green candle completely swallows the previous red one. Or maybe a hammer candlestick forming right at a key support level. These patterns are the market's way of telling you that buying pressure is starting to win, giving you a much safer entry.
Defining Your Risk With A Stop Loss
Every single trade you take—no exceptions—needs a clearly defined exit plan in case you're wrong. Your stop-loss order is your ultimate safety net. It's the non-negotiable line in the sand that protects your trading account from a devastating loss.
When you're trading an oversold bounce, the most logical place for your stop-loss is just below the recent swing low—the very bottom of the dip that triggered the signal in the first place. This gives the stock a little room to wiggle but gets you out fast if the downtrend suddenly kicks back in. Always remember, the goal is to risk a small, predefined amount for a potentially much larger gain. A good rule of thumb is to never risk more than 1-2% of your trading capital on any single idea.
Strategies For Taking Profit
Knowing when to get out of a losing trade is critical, but knowing when to cash in on a winner is just as important. A simple and effective strategy is to set your first profit target at the nearest major resistance level. This is an area on the chart where the stock has previously struggled to break through.
Another powerful technique is to use a trailing stop. This is a type of order that automatically moves your stop-loss up as the stock's price rises. It's a fantastic way to lock in profits while still giving the trade room to run higher. This method helps you squeeze the most out of a strong reversal without giving everything back if the trend suddenly turns against you.
Wrapping It Up: Mastering The Art Of Oversold Trading
If there’s one thing to take away, it’s this: understanding what an “oversold stock” truly means is about seeing the market in terms of probabilities, not certainties.
We've walked through how indicators like RSI and Bollinger Bands aren't magic bullets. Instead, they're essential tools for spotting moments when selling pressure might be completely exhausted. By now, you should have a feel for how to tell the difference between a high-probability bounce and a dangerous value trap that just keeps falling.
It should also be crystal clear that a solid risk management plan isn’t optional—it’s the foundation of every single trade. This is the framework that protects your capital and keeps you in the game long enough for your strategies to actually work. The final piece of the puzzle is applying these concepts with unwavering discipline.
Moving From Reacting To Strategizing
Using a powerful tool like ChartsWatcher lets you build, test, and execute your trading ideas with a quantifiable, data-driven edge. This is the critical leap every serious trader eventually has to make.
Stop reacting to market noise and start capitalizing on its predictable, repeatable patterns. This is the core principle that separates consistently profitable traders from the crowd.
This systematic approach is what pulls emotion and guesswork out of your decision-making. It’s what allows you to trade with confidence, knowing every action is backed by historical data and a clear, repeatable plan.
Answering Your Top Questions About Oversold Stocks
Let's tackle some of the most common questions that pop up when traders start working with oversold signals. Getting these concepts straight is key to avoiding some classic rookie mistakes.
How Long Can a Stock Stay Oversold?
Longer than you think. Seriously.
A stock can get pinned in oversold territory—like an RSI below 30—and just stay there for a surprisingly long time. This is classic behavior during a brutal, news-driven downtrend where sellers are just relentless. It's the exact reason why blindly buying a stock just because an indicator says "oversold" is a recipe for disaster.
Think of an oversold signal not as a "buy" button, but as a yellow flag. Experienced traders see it and get interested, but they don't act. They patiently wait for confirmation that the selling pressure is actually letting up. That could be a powerful bullish candlestick pattern or, better yet, the price actually starting to tick higher. You need proof that buyers are finally stepping back in.
Is an Oversold Stock the Same Thing as an Undervalued One?
Absolutely not, and getting this wrong is a costly mistake. The two ideas come from completely different universes of stock analysis.
- Oversold is a pure technical reading. It’s all about the math of a recent price drop—how fast and how far it fell. It says nothing about the company itself.
- Undervalued is a fundamental opinion. This is when you believe the company's actual business (its earnings, assets, and growth prospects) is worth more than its current stock price reflects.
A truly terrible, failing company can become technically oversold over and over again on its long slide to zero. Remember: a cheap stock can always get cheaper. Don't confuse a temporary price condition with a genuine bargain.
What's the Best Timeframe for Finding Oversold Stocks?
The "best" timeframe is the one that matches your trading style. There's no single magic answer here; it all comes down to how long you plan to be in a trade.
A day trader hunting for quick scalps might be staring at a 5-minute chart, looking for tiny oversold bounces that last less than an hour. They're in and out before lunch.
On the other hand, a swing trader who holds positions for days or weeks will get much more meaningful signals from the daily or 4-hour charts. These longer-term signals tend to lead to more powerful, sustained moves. A popular pro-level technique is to use multiple timeframes together. You might spot a great oversold setup on the daily chart, then zoom into the hourly chart to pinpoint the perfect, low-risk entry.
Ready to stop hunting and start finding? ChartsWatcher provides the professional-grade scanning and backtesting tools you need to build and validate your trading strategies with data, not guesswork. Find your edge today at chartswatcher.com.
