Overbought vs Oversold Trading Guide
The core difference in the overbought vs oversold debate is pretty simple. An overbought market is one where a relentless stream of buying has pushed prices to levels that just don't feel sustainable, hinting that a correction could be just around the corner. On the flip side, an oversold market is where panicked selling has hammered prices down so far, so fast, that a rebound feels almost inevitable.
At their heart, these terms are all about capturing the emotional extremes of the market, giving us a heads-up that a reversal might be brewing.
What Are Overbought and Oversold Conditions
When you hear traders talking about overbought or oversold levels, what they're really talking about is market psychology. Think of it like a rubber band. The further you stretch it in one direction, the more powerful the snapback will be when it's finally released. These conditions are not a crystal ball—they don't guarantee a price reversal—but they're strong clues that the current momentum might be running out of gas.
An overbought market gets that way from excessive, sustained buying pressure. This often kicks in after a string of good news or a wave of positive sentiment sends prices rocketing up. At this point, the asset is often seen as trading far above what it's truly worth, and savvy traders start thinking it’s due for a drop as people begin to take profits off the table.
In contrast, an oversold market is born from extreme, prolonged selling. This is usually triggered by bad news or widespread panic, which shoves prices to levels that look unjustifiably cheap. In this scenario, the asset is trading well below its perceived value. The selling pressure is seen as exhausted, setting the stage for a potential rally as bargain hunters step in.
The Foundation of Market Extremes
The whole idea of spotting these market extremes isn't new; it's rooted in technical analysis principles from the mid-20th century. It really gained traction with the creation of indicators like the Relative Strength Index (RSI), introduced by the legendary J. Welles Wilder back in 1978.
RSI works by measuring the speed and change of price movements on a simple 0-to-100 scale. As a rule of thumb, a reading above 70 often signals overbought conditions, while a reading below 30 suggests the market is oversold. You can find more great insights on RSI and its origins over at TheTradingAnalyst.com.
Key Takeaway: Treat an overbought or oversold signal as a warning, not a command. It’s the market’s way of telling you the current trend might be losing steam, which should prompt you to dig deeper before pulling the trigger on a trade.
Overbought vs Oversold at a Glance
To make things clearer, let's break down the key differences between these two market states. This table gives you a quick side-by-side comparison of their core characteristics.
| Attribute | Overbought Condition | Oversold Condition |
|---|---|---|
| Market Psychology | Greed and euphoria dominate. | Fear and panic are prevalent. |
| Price Action | Sharp, rapid price increases. | Steep, rapid price declines. |
| Potential Outcome | Price pullback or reversal downwards. | Price bounce or reversal upwards. |
| Typical RSI Reading | Above 70. | Below 30. |
| Associated Action | Potential shorting or profit-taking. | Potential buying or covering shorts. |
Ultimately, understanding the personality of each condition helps you contextualize price action and anticipate potential shifts in momentum before they happen.
Of course. Here is the rewritten section, crafted to sound completely human-written and natural, following the specified style and formatting requirements.
How to Identify Overbought and Oversold Levels
Knowing what overbought and oversold means is one thing, but actually spotting these conditions on a live chart is where the real skill comes in. For this, traders turn to a specific family of technical tools called momentum oscillators. These indicators are usually plotted just below your main price chart, and they work by measuring the speed and strength of price changes, crunching that data into a simple scale.
The big three you'll hear about most often are the Relative Strength Index (RSI), the Stochastic Oscillator, and the Money Flow Index (MFI). While they all have the same goal—to tell you when buying or selling pressure might be getting exhausted—they each have their own unique formula. Think of them as different lenses for viewing market momentum.
Using Standard Oscillator Thresholds
The most direct way to use these tools is to watch for when the indicator crosses into specific, pre-set zones. These levels are the industry standard and act as your first heads-up that a market might be stretched too thin.
-
Relative Strength Index (RSI): This is probably the most popular momentum indicator out there, and it runs on a simple 0 to 100 scale. A reading above 70 is the classic signal for an overbought market, suggesting the buying frenzy might be on its last legs. On the flip side, a reading below 30 is considered oversold, hinting that sellers are running out of steam.
-
Stochastic Oscillator: The Stochastic also uses a 0 to 100 scale, but its trigger points are a bit different. Here, you're looking for a reading above 80 to signal an overbought condition and a reading below 20 to flag an oversold one.
Another key tool, especially in major global markets, is the Moving Average Convergence Divergence (MACD) histogram. When the bars on the histogram get unusually tall on the positive side, it can hint at an overbought market. Deep negative bars suggest the market is oversold. If you want to dive deeper into how these work on a chart, check out our guide on the top overbought and oversold indicators for traders.
Here's a critical piece of wisdom: these levels aren't magic buy or sell buttons. In a monster uptrend, the RSI can hover above 70 for what feels like an eternity. Context is everything. These signals are far more reliable when a market is chopping sideways or stuck in a defined range.
The chart below shows the RSI in action. You can see how it flags the overbought (above 70) and oversold (below 30) zones.
Notice how the price often reacts after the RSI crosses these lines, but it's not always an immediate, picture-perfect reversal.
Looking for Divergence Signals
For a more nuanced—and often more powerful—signal, you need to learn how to spot divergence. This happens when the price of an asset and your momentum indicator start telling two different stories. It's a massive warning sign that the momentum driving the trend is starting to crumble.
-
Bearish Divergence: You see the price push up to make a new high, but your RSI or Stochastic fails to do the same. This is a classic tell. Even as the price inches higher, the underlying buying power is fading, which often happens right before a drop.
-
Bullish Divergence: The price chart shows a new low, but the oscillator is making a higher low. This is a great sign for bulls. It suggests that despite the lower price, the selling pressure is easing up, and a bounce or even a full-blown reversal could be just around the corner.
Divergence adds that much-needed layer of confirmation. It helps you filter out the noise and make smarter decisions when trying to figure out if a market is truly overbought or just getting started.
Comparing the RSI and Stochastic Oscillator
When you're trying to spot overbought vs oversold conditions, the Relative Strength Index (RSI) and the Stochastic Oscillator are the two heavyweights most traders have in their corner. They both show up as oscillators on a 0-100 scale, but they get to their conclusions in fundamentally different ways. Nailing down how they're calculated is the key to knowing which one to pull out of the toolbox and when.
The RSI is all about the speed and size of price moves. It’s essentially a tug-of-war between the average gains on up-days and the average losses on down-days. This creates a smoother, less jumpy line that’s a fantastic gauge of sustained momentum.
On the other hand, the Stochastic Oscillator couldn't care less about how fast the price is moving. Instead, it measures where a security’s last closing price sits in relation to its high-low range over a certain period. This makes it incredibly sensitive to where the price is at this very moment within its recent trading channel.
Key Insight: Think of it like this: The RSI is a momentum-based indicator, while the Stochastic is a location-based one. The RSI asks, "How fast is the price moving?" The Stochastic asks, "Where is the price closing relative to its recent range?"
Calculation and Sensitivity Differences
This core difference in their formulas directly shapes how each indicator looks and feels on your chart. The Stochastic Oscillator, being much more sensitive to the latest price action, will throw out signals far more often. You'll see its line dart from overbought to oversold and back again more frequently, even on minor price wiggles.
This hair-trigger sensitivity makes it a go-to for short-term traders and scalpers who live off those smaller, more frequent price swings. But there's a catch: this can also lead to more false signals. This is especially true in a strong trend, where the Stochastic might scream "overbought" multiple times while the price just keeps marching higher.
The RSI is the calmer of the two. Its smoother line means it generates fewer signals and is less likely to get you whipsawed by market noise. This makes it a better fit for swing traders or anyone looking to confirm the real strength behind a broader trend. An RSI that hangs out above 70 for a while isn't always a sell signal—it can be a sign of a seriously powerful uptrend.
This infographic lays out the standard "danger zones" for both indicators.
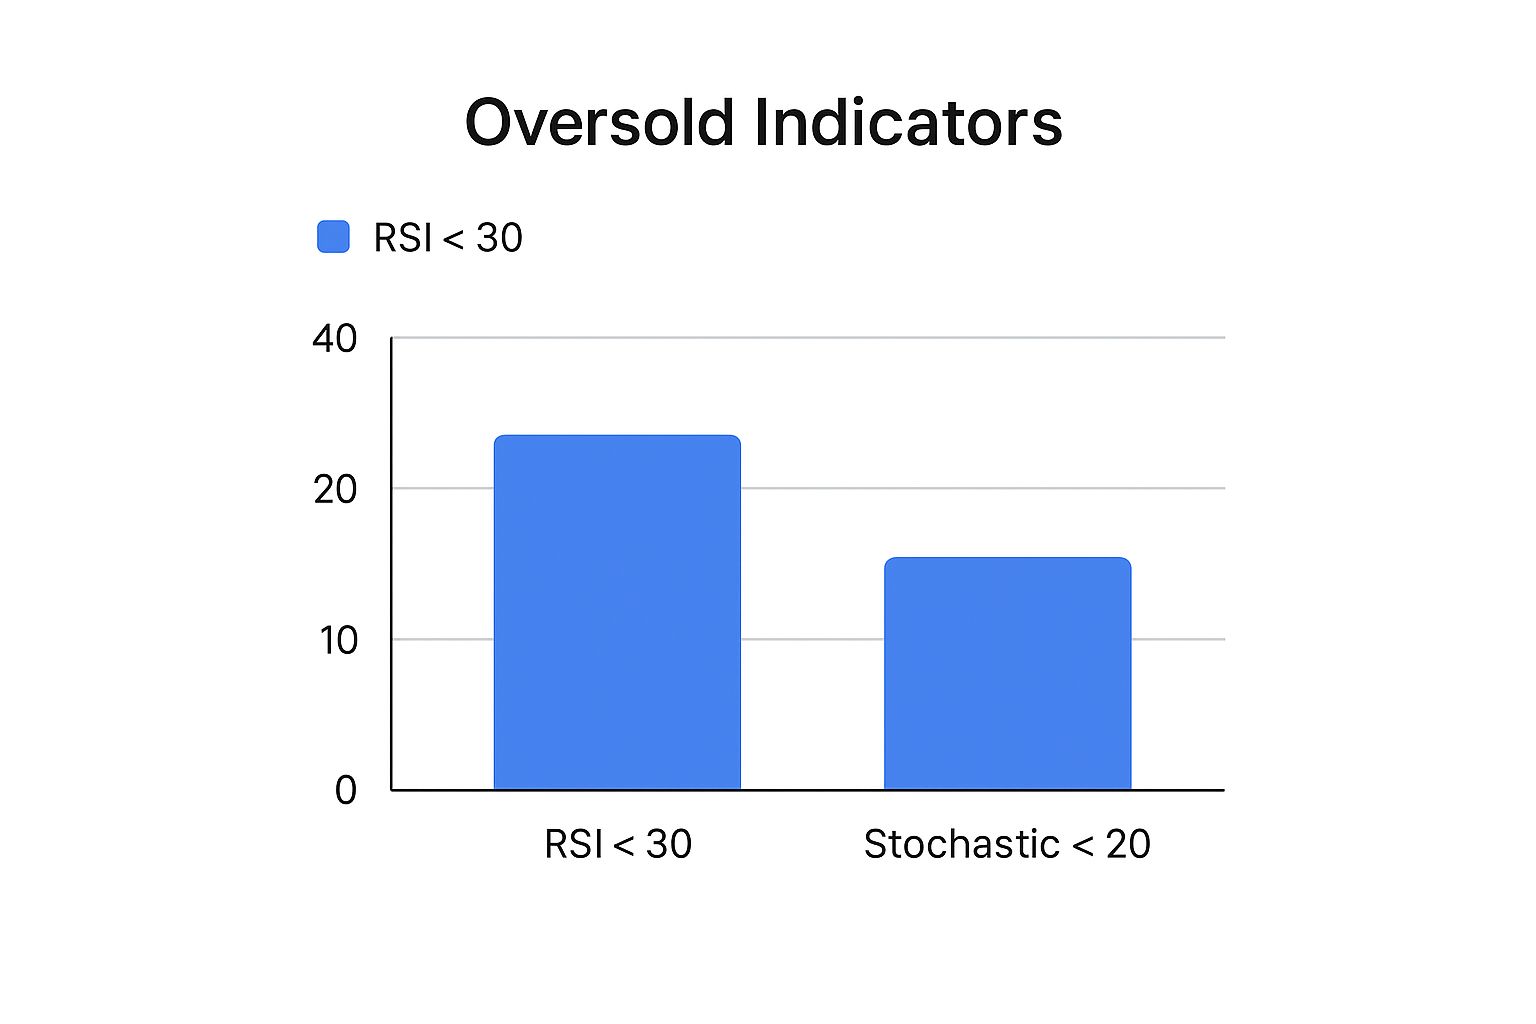
As you can see, the thresholds are a bit different. Traders typically set the Stochastic's trigger points lower because its hyper-sensitive nature means it will hit those extremes more easily.
To break it down even further, here’s a head-to-head comparison.
RSI vs Stochastic Oscillator Key Differences
The table below provides a detailed analysis of how the RSI and Stochastic Oscillators differ in their calculation, sensitivity, and ideal use cases, helping you decide which tool fits your strategy best.
| Aspect | Relative Strength Index (RSI) | Stochastic Oscillator |
|---|---|---|
| Core Concept | Measures the speed and magnitude of price changes (momentum-based). | Compares the closing price to its recent price range (location-based). |
| Calculation | Compares average gains on up periods vs. average losses on down periods. | Calculates where the current close is relative to the high-low range over a set period. |
| Sensitivity | Lower sensitivity, produces a smoother line with fewer, but often more reliable, signals. | Higher sensitivity, generates more frequent signals and is prone to whipsaws. |
| Best For | Trending markets to gauge trend strength and spot major divergences. | Ranging (sideways) markets to identify tops and bottoms between support/resistance. |
| Ideal Trader | Swing traders, position traders, and those analyzing longer timeframes (daily, weekly). | Day traders, scalpers, and those looking for quick entries on shorter timeframes. |
| Key Signal | Divergence is often considered a stronger signal for potential major trend reversals. | Crossovers of its %K and %D lines are primary signals for entry/exit. |
Ultimately, choosing the right indicator is all about context. The RSI provides a big-picture view of momentum, while the Stochastic gives you a high-definition look at the current price action.
Ideal Use Cases and Recommendations
So, which one should you use? The answer almost always comes down to your trading style and what the market is doing right now. Neither is flat-out "better" than the other, but each one definitely shines in specific scenarios.
When to Use the Stochastic Oscillator:
- Ranging or Sideways Markets: It’s a rockstar at picking tops and bottoms when the price is just bouncing between clear support and resistance levels.
- Short-Term Trading: Its rapid-fire signals are perfect for day traders who need to get in and out of trades quickly.
- Identifying Pullbacks: Its sensitivity can help you nail the entry for a minor pullback within a larger, established trend.
When to Use the Relative Strength Index (RSI):
- Trending Markets: The RSI is more dependable for confirming how strong a trend is and identifying when it might be running out of gas through divergence.
- Longer-Term Analysis: Its smooth nature filters out the day-to-day market noise, making it incredibly useful for swing traders or anyone looking at daily or weekly charts.
- Confirming Major Reversals: RSI divergence is widely seen as a more powerful signal that a major, long-term trend change could be on the horizon.
For many experienced traders, the real magic happens when you stop trying to pick one and start using them together. For example, you might wait for the slow-and-steady RSI to hit the overbought zone, then use a bearish crossover on the fast-moving Stochastic as your pinpoint trigger to enter a short trade. In a platform like ChartsWatcher, you can layer both indicators on a single chart to get a much more complete and nuanced picture of market momentum.
Actionable Trading Strategies for Market Extremes
Knowing the theory behind overbought vs oversold conditions is one thing. Actually turning that knowledge into a profitable trading plan is something else entirely. Most successful traders I know rely on two core strategies when these extremes pop up, but they apply them very differently depending on the market's bigger picture.
Let's get past just spotting these levels on a chart. The real goal is to build a repeatable, concrete plan so you're making informed decisions, not just reacting to a flashing indicator.
Strategy 1: The Mean Reversion Approach
The most intuitive way to trade these levels is with a mean reversion strategy. At its core, this is the simple idea that prices, after a big, sharp move, tend to snap back toward their average. So, an oversold signal becomes a potential buying opportunity, and an overbought signal is your cue to consider selling or shorting.
But here’s the catch: trading against momentum is inherently risky. You can’t just blindly buy every oversold dip. The key is to only apply this strategy when it aligns with the larger, dominant trend.
- Buying the Dip: In a strong, established uptrend, look for short-term oversold readings on an indicator like the RSI or Stochastic. This isn't a sign the trend is over; it’s a temporary pullback, offering a much lower-risk entry point to jump back into the primary bull move.
- Selling the Rally: On the flip side, during a broader downtrend, an overbought signal can pinpoint the very peak of a relief rally. This gives you an ideal spot to initiate a short position, betting that the main bearish trend will soon resume.
This isn't just wishful thinking; historical data backs it up. Statistical studies show that markets often have strong mean-reversion tendencies in the short term. One backtest, for example, found that when markets get deeply oversold after a big drop, the returns over the next few days and weeks are often quite positive. It makes sense—panic selling creates prime buying opportunities. You can dig into the numbers in this analysis of oversold market behavior.
Strategy 2: The Trend Confirmation Approach
Now for a more counterintuitive—but incredibly powerful—strategy. Instead of seeing extreme readings as reversal signals, you view them as trend confirmation. This approach works exceptionally well in powerful, momentum-fueled markets where prices can stay "overbought" or "oversold" for what feels like an eternity.
Rather than fighting the trend, you’re using the indicator to tell you just how strong it is.
Key Insight: A sustained overbought reading in a bull market isn't a red flag; it's a sign of immense buying pressure and powerful momentum. The same is true for sustained oversold readings in a bear market—it’s a sign of aggressive selling.
Here’s how you can put this into practice:
- Identify a Strong Trend: First, make sure the market is in a clear, directional move. Use tools like moving averages or simple price structure analysis to confirm it.
- Look for Sustained Extremes: When the RSI pushes above 70 and stays there, it’s a signal that the bulls are firmly in charge. This isn't a signal to sell. It's a signal to hold on tight or even look to add to your position on any minor dips.
- Use the Exit as a Warning: The real warning signal in this strategy comes when the indicator finally leaves the extreme zone. For instance, if the RSI has been glued above 70 for weeks and then finally drops back below it, that's your cue. Momentum is likely fading, and it might be time to start taking profits.
Common Mistakes When Trading Overbought and Oversold Signals
Navigating the extremes of overbought vs oversold markets feels like it should be a straight shot to easy profits, but it's a minefield of costly traps. I’ve seen countless traders stumble here, not because the indicators are broken, but because of how they use them. The first step to getting this right is knowing what goes wrong.
Easily the most expensive mistake is taking an indicator signal in a vacuum. Just because the RSI screams "overbought" doesn't automatically mean you should slam the sell button. An oversold Stochastic reading isn't a direct command to buy. Think of these as warnings, not gospel.
Ignoring the Broader Market Context
A runaway trend can—and often will—keep an asset pinned in "overbought" or "oversold" territory far longer than you think is possible. When a stock is ripping higher on strong fundamental news, it can stay above an RSI of 70 for weeks, steamrolling anyone who tries to short the first overbought signal.
Context is everything. You absolutely have to ask these questions before placing a trade:
- What's the primary trend on the daily or weekly chart?
- Is the market trending hard, or is it chopping sideways in a range?
- Is there a big news event or economic report fueling this move?
An overbought signal in a raging bull market is usually just a sign of incredible strength, not a sign of a top. On the flip side, an oversold signal becomes much more potent when it lines up with a major historical support level.
Disregarding Confirmation and Divergence
Another classic blunder is jumping the gun without waiting for confirmation. An indicator poking into an extreme zone is just the first clue, not the whole story. A much more powerful signal is divergence—this happens when the price grinds to a new high, but the indicator makes a lower high.
Key Takeaway: Ignoring divergence is like driving with your eyes closed. It's one of the most reliable clues that the momentum behind a trend is sputtering out, and it often shows up right before a major reversal. Acting without it is just plain gambling.
Patience pays off here. Wait for the indicator to not only hit the extreme zone but also show signs of hooking back toward neutral. For a deeper look at this, our guide on using oversold and overbought indicators to time your trades lays out more detailed strategies.
Failing to Manage Risk
This one is unforgivable: trading without a protective stop-loss. No matter how perfect a setup looks, you are going to be wrong sometimes. The whole point of trading these levels is to find high-probability reversal spots, not crystal-ball certainties.
Without a stop-loss, a single trade where a "screaming buy" signal just keeps getting more and more oversold can blow a huge hole in your account. Define your maximum pain point—your exit—before you ever click "buy." This non-negotiable rule is what separates disciplined traders from hopeful gamblers and ensures you'll be around to trade tomorrow.
Frequently Asked Questions
When you start digging into overbought vs oversold conditions, a few common questions always pop up. Let's get them answered so you can start applying these concepts with more confidence.
Can a Stock Keep Rising if It Is Overbought?
Yes, absolutely. This is a critical point that trips up a lot of traders, both new and experienced.
When a stock is in a powerful uptrend—driven by something like blowout earnings or intense market hype—it can stay in overbought territory (think RSI above 70) for a surprisingly long time. Instead of being an automatic "sell" signal, a sustained overbought reading can actually confirm just how strong the bullish momentum is. Trying to short that stock can feel like stepping in front of a freight train.
The real signal often isn't the entry into the overbought zone, but the exit. When the indicator finally drops back below that threshold, it can be a more reliable sign that the momentum is finally fizzling out.
What Is the Single Best Indicator for Market Extremes?
There's no magic bullet here. The "best" indicator really comes down to your personal trading style and what the market is doing at the moment. That said, the two heavy hitters are the RSI and the Stochastic Oscillator, and they each shine in different situations.
- RSI (Relative Strength Index): This one is great for gauging the strength of major trends. Its smoother calculation helps you spot significant momentum shifts and divergences, making it a favorite for swing traders who need to see the bigger picture.
- Stochastic Oscillator: This indicator is much more sensitive, which makes it a fantastic tool for pinpointing entries and exits in choppy, sideways markets. Its quick reaction time is why scalpers and other short-term traders often lean on it.
The most effective approach is often using them together. For example, you could use the RSI to confirm the primary trend is healthy and then use the Stochastic to time a lower-risk entry on a small dip.
How Do I Confirm an Overbought or Oversold Signal?
You should never, ever trade on an indicator signal alone. That's a recipe for disaster. Real confirmation comes from building a case for the trade by seeing if other technical factors agree with the signal.
First, look at the price chart itself. Is the oversold signal happening right as the price is testing a major, historical support level? That's a much more powerful setup than an indicator flashing in the middle of nowhere.
Second, check the volume. An overbought signal that appears while trading volume is drying up suggests the bulls are running out of steam. On the flip side, an oversold reading that’s met with a sudden spike in buying volume can be a huge tell that a bottom is forming.
Gain a clearer perspective on market extremes with ChartsWatcher. Our platform allows you to layer multiple indicators like RSI and Stochastics, customize alerts for overbought and oversold conditions, and analyze historical data to see how signals performed in the past. Stop guessing and start analyzing with precision at https://chartswatcher.com.
