Mastering what is vwap: A Practical Guide to Intraday Trading with VWAP
The Volume Weighted Average Price (VWAP) is really the true average price of a stock for the day, but with a critical twist—it’s weighted by trading volume. Unlike a simple moving average that treats every trade the same, VWAP gives more importance to the price levels where the big money was actually moving.
This makes it a far more accurate reflection of a stock's value during a trading session.
What Is VWAP: The True Price Benchmark for Traders
Imagine trying to find the average price of a car sold over a weekend. A simple average might just split the difference between the cheapest and most expensive models. But what if hundreds of sedans sold for $25,000 and only a handful of luxury sports cars sold for $150,000? That simple average would be seriously skewed and pretty useless.
VWAP fixes this exact problem for the stock market. It tells you the average price paid, but it gives much more weight to the price levels where huge volumes of shares changed hands. A single block trade of 100,000 shares at $50 will yank the VWAP line much more than dozens of tiny 10-share trades at $49.
This is precisely why institutional traders live and die by it.
Why Institutions Trust VWAP
Big players like hedge funds, mutual funds, and pension funds need to execute massive orders without causing huge price swings. Their primary goal is often to buy below the day's VWAP or sell above it. Doing so proves they got a "good" price relative to the market's overall activity for that day.
This institutional focus creates something of a self-fulfilling prophecy. Because so many large traders use VWAP as their main reference point, the line itself often becomes a major intraday level of support or resistance.
VWAP is the intraday volume-weighted average price that institutional desks and algorithmic traders commonly use as a benchmark. Traders at large brokerages routinely measure execution quality against intraday VWAP targets, attempting to buy more when the price is below VWAP and less when it is above. Learn more about how institutions use VWAP as their primary execution benchmark on Schwab.com.
VWAP as a Market Sentiment Indicator
Beyond being just a benchmark, VWAP offers a real-time gauge of market sentiment for a particular stock. Think of it as a dynamic "line in the sand" for the trading day.
- Price Above VWAP: When a stock is trading above its VWAP, it tells you that buyers are in control. They're willing to pay a premium over the average price where most of the day's volume has traded. This is a classic bullish intraday signal.
- Price Below VWAP: On the flip side, a stock trading below its VWAP suggests sellers are dominating. The market is trading at a discount to the day's volume-weighted average, which often signals weakness or bearish sentiment.
To really appreciate VWAP, it’s helpful to see it as a cornerstone of technical analysis in trading. It’s a foundational tool that brilliantly combines both price and volume into one insightful indicator, giving you a much clearer picture of who's winning the intraday battle: the bulls or the bears.
Calculating and Reading the VWAP Line
At first glance, the math behind VWAP can look a little intimidating, but the concept itself is surprisingly simple. Think of it this way: the indicator is just trying to answer the question, "What's the true average price of this stock today, factoring in how many shares traded at each price?"
You’ll never have to do these calculations by hand, of course. Your trading platform handles it all in a blink. But knowing how it's built gives you a much better feel for the story the VWAP line is telling on your chart. It's a cumulative process, constantly updating with every single trade that happens throughout the day.
The Step-by-Step VWAP Calculation
The formula follows three core steps that repeat for each time period—say, every minute—of the trading session. Let's break it down.
- Find the Typical Price for the Period: First, the formula needs a representative price for a small time slice (like the last minute). It gets this by averaging the high, low, and closing prices for that specific period: (High + Low + Close) / 3.
- Weight it by Volume: This is the magic ingredient. That typical price is then multiplied by the total number of shares traded during that same minute. This step gives more weight to price levels where the real action—the heavy trading—happened.
- Calculate the Cumulative Average: Finally, the indicator takes this new "price x volume" number and adds it to a running total for the day. It then divides that massive number by the total cumulative volume for the day so far. The result is the single VWAP value you see plotted on your chart.
To really get the mechanics, it helps to understand the basic principles of how to calculate weighted averages, since that’s the foundation this indicator is built on.
This diagram helps visualize how those inputs come together to create the final VWAP line.
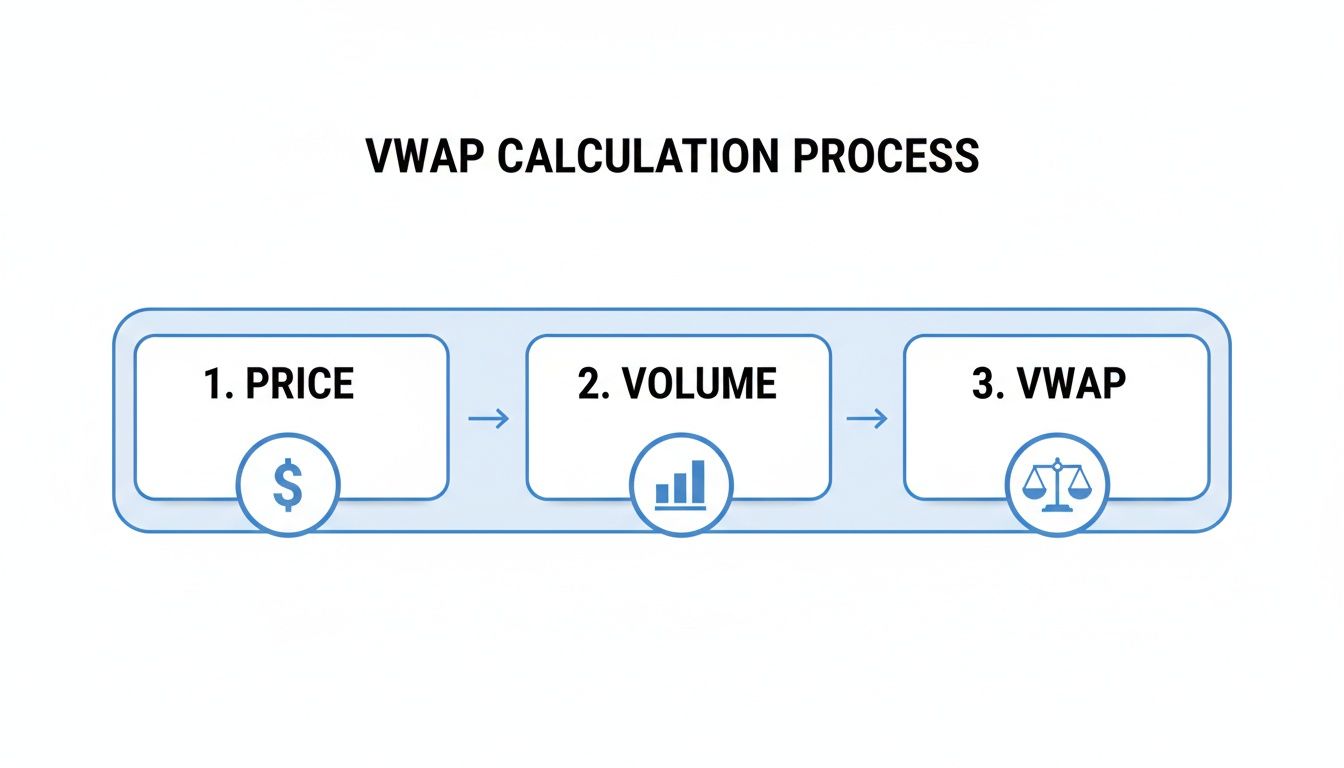
As you can see, both price and volume are essential ingredients. VWAP simply balances them to give us that volume-weighted average.
Reading the Story of the VWAP Line
Once it’s plotted on your chart, the VWAP line is more than just a calculation; it’s a dynamic benchmark for intraday value. How the current price interacts with this line is where the real insights come from.
It’s helpful to think of the VWAP line as the financial "center of gravity" for the trading day.
When the price is trading above the VWAP line, it suggests buyers are in control. They are willing to pay a premium compared to the day's average transaction price. On the flip side, when the price is below VWAP, sellers have the upper hand, and the stock is trading at a discount relative to where the bulk of the day's shares have changed hands.
This simple read gives you an instant sense of the bullish or bearish sentiment for that stock, right now. A rising VWAP line often points to a healthy uptrend with strong participation from buyers, while a falling VWAP signals sustained selling pressure. This interplay between price and the VWAP line is the foundation for a ton of effective intraday trading strategies.
Proven VWAP Trading Strategies for Day Traders
Knowing what VWAP is represents the starting line. Turning that knowledge into a profitable trading plan is where the real race begins. The VWAP line isn't just a passive benchmark on your chart; it's a dynamic zone where the daily battles between buyers and sellers get really interesting. If you learn to read these skirmishes, you can build some seriously effective strategies.
Think of VWAP as the day's "financial center of gravity." Prices will wander away from it, but more often than not, they get pulled back. The best strategies are built around these predictable behaviors—whether it's capitalizing on a snap back to the average or catching a powerful breakaway move.
The VWAP Pullback Strategy
This is one of the most reliable plays in the VWAP handbook. The pullback strategy works beautifully when a stock is already in a clear intraday trend. Instead of chasing a stock that's already run up, you patiently wait for it to take a breather and return to its value area for a low-risk entry.
Here’s how you'd play a long setup:
- Find an Uptrend: The stock is consistently holding above VWAP, and the VWAP line itself is pointing up. This is your green light—buyers are in charge.
- Wait for the Pullback: Trends don't move in straight lines. You'll often see the price dip back down to test the VWAP line. This is the moment you've been waiting for.
- Confirm the Bounce: Look for signs of life. The price needs to find support at or near VWAP and start turning back up. A bullish candle, like a hammer or an engulfing pattern, is a great confirmation signal.
- Take the Trade: Enter your long position as the price bounces. Tuck your stop-loss just below the VWAP or the recent swing low to keep your risk tight.
For a short trade, you just flip the script. You're looking for a stock in a downtrend (below a downward-sloping VWAP), and you enter when it rallies back up to test VWAP as resistance.
The VWAP Breakout Strategy
While pullbacks are about joining a trend that's already in motion, breakouts are about catching the very start of a powerful new move. This strategy zeroes in on the exact moment a stock punches through the VWAP line with a surge of volume, signaling a big shift in who's in control.
A bullish breakout happens when a stock that was stuck below VWAP suddenly rips above it. But here's the crucial part: it must be on high volume. That volume spike is your confirmation that the big players—the institutions—are likely behind the move, giving it much more credibility.
The big idea here is that a break of the day's "fair value" line, backed by real conviction (volume), tells you the entire psychology for that stock has just shifted. The sellers are exhausted, and a new, aggressive wave of buyers is taking over.
Using VWAP Bands for Mean Reversion
Many trading platforms, including TradingView, let you add upper and lower bands to your VWAP indicator. These bands are usually calculated using standard deviations, creating a channel that helps you spot when a price might be getting overstretched.
The logic is beautifully simple:
- Overbought Signal: When the price stretches way up and touches or exceeds the upper VWAP band, it might be statistically "overbought." This is a potential setup for a short trade, betting on a return trip back toward the VWAP.
- Oversold Signal: On the flip side, if the price dumps far below the lower band, it could be "oversold." This is a potential trigger for a long trade, anticipating a bounce back toward the VWAP.
Of course, VWAP bands aren't a crystal ball. A very strong trend can "ride the bands" for a long time. Still, they provide a fantastic framework for finding high-probability mean-reversion trades, especially in choppy or moderately trending markets. To go deeper on this and other methods, check out our guide on 6 powerful VWAP trading strategies for 2025.
The Power of Anchored VWAP
The standard VWAP starts fresh every day at the opening bell. Anchored VWAP (AVWAP) is its more flexible, and frankly more powerful, cousin. It lets you start the calculation from any point on the chart you choose.
This is a game-changer for analyzing price action after a specific event. You could anchor the VWAP to the exact minute of a big earnings announcement, a news headline, or a major technical breakout. The AVWAP line that appears shows you the average price paid since that specific moment, giving you a custom-made benchmark for the "new" market reality.
This adaptability is exactly why so many pros swear by it. VWAP's blend of price and volume is baked into countless institutional algorithms. In fact, many short-term quant traders watch for price deviations of ±0.5% to 1.5% from VWAP to trigger their automated trades. Because it resets daily, its relevance for intraday action is unmatched.
To give you a quick cheat sheet, here's how these strategies stack up.
Summary of VWAP Trading Strategies
| Strategy | Buy/Long Signal | Sell/Short Signal | Best For |
|---|---|---|---|
| VWAP Pullback | Price pulls back to a rising VWAP and bounces | Price rallies to a falling VWAP and gets rejected | Trending markets |
| VWAP Breakout | Price breaks above VWAP with high volume | Price breaks below VWAP with high volume | Markets with strong catalysts or shifting sentiment |
| VWAP Bands | Price hits the lower band and reverses up | Price hits the upper band and reverses down | Ranging or choppy markets |
| Anchored VWAP | Price finds support at AVWAP anchored to a key low/event | Price finds resistance at AVWAP anchored to a key high/event | Analyzing price action after a specific catalyst |
Each of these strategies offers a different way to interact with the market, but they all hinge on understanding VWAP as a dynamic level of support and resistance. Pick the one that best fits your trading style and the current market conditions.
Common VWAP Mistakes and How to Avoid Them
VWAP is an incredibly powerful tool in the right hands. But like any sharp instrument, if you don't know how to handle it, you're going to get cut. Too many traders learn the definition, slap it on a chart, and immediately fall into a few classic traps that completely undermine its value.
Getting a handle on these common pitfalls is your first step toward using VWAP like a professional and building a more disciplined, robust trading strategy.
The single biggest mistake? Treating VWAP as a standalone crystal ball. A price crossing above the line isn't an automatic "buy," and a dip below isn't a screaming "sell." Context is everything. Without it, you’re just gambling on a squiggly line.
Remember, VWAP is a reactive indicator, not a predictive one. It tells you the story of what has happened—the average price where volume has traded. A big breakout above VWAP might be the start of a massive run, or it could be a bull trap just before the floor gives out. Relying on the cross alone is a recipe for disaster.
Mistake 1: Using VWAP in Isolation
This is the big one. Seeing a price move across VWAP and immediately hitting the buy or sell button without any other evidence is a rookie move. A signal becomes infinitely more powerful when it's backed up by other factors.
The Fix: Always look for confirmation.
- Price Action: Does a bounce off VWAP also form a classic bullish candlestick pattern, like a hammer or an engulfing bar? That’s a much stronger signal.
- Volume Analysis: A breakout through VWAP on a massive surge of volume is the real deal. It shows conviction and institutional muscle. A breakout on weak, anemic volume is suspicious and often fails.
- Market Context: Is the rest of the market (think the S&P 500) moving in the same direction? Swimming with the market tide gives your trade a much higher probability of success than fighting it.
Mistake 2: Applying It to the Wrong Timeframe
This mistake can make the indicator completely useless. VWAP is, by its very nature, an intraday indicator. Its calculation starts fresh at the market open and resets every single day.
Trying to apply a daily VWAP to a weekly or monthly chart is a critical error. The data is meaningless. The average price from Monday has absolutely no statistical relationship to the average price on Tuesday. Connecting them makes no sense.
VWAP's power comes from its daily reset. It provides a clean, session-specific benchmark. For analysis spanning multiple days or weeks, traders should use tools designed for longer horizons, such as the 20, 50, or 200-day moving averages.
Mistake 3: Trusting It in Low-Volume Conditions
The "V" in VWAP is there for a reason—it's the most important part of the equation. When a stock is barely trading, the VWAP line becomes erratic and untrustworthy.
Think about pre-market hours, the dreaded lunchtime lull, or an illiquid stock that barely trades. In these low-volume environments, a handful of small trades can shove the price around and completely distort the VWAP reading, leading to a flurry of false signals. The indicator needs a healthy, steady flow of trades to provide a statistically meaningful average.
The Fix: Be skeptical of VWAP signals during periods of thin trading. The indicator is at its best when volume is at or above its average for that time of day. If the market is quiet and chopping sideways, VWAP loses its edge and is more likely to mislead you than help you.
Steering clear of these common mistakes will sharpen your analysis and help you use this indicator as the pros do—as a valuable guide, not a gospel.
Why VWAP Gives a Clearer View Than Closing Prices
A stock’s closing price gets all the headlines. It's the number you see on the news every night, but for anyone who trades for a living, it tells a very incomplete story.
Imagine trying to understand a full day's weather by only checking the temperature at 4:00 PM. You'd miss the morning chill, the midday heat, and any sudden storms that blew through. A closing price is just that—a single, final snapshot in time.
VWAP, on the other hand, is like a detailed weather report for the entire trading session. It doesn't just glance at the final price; it looks at every single trade from the opening bell to the close. More importantly, it gives more weight to the moments when the most money was changing hands. This makes it a much richer and more representative measure of a stock's "true" price for that day.
By baking volume into its calculation, VWAP naturally smooths out the random, often meaningless price spikes that can happen in the last few minutes of trading. A single, low-volume trade right at the bell can dramatically warp the closing price, but it will barely make a dent in the VWAP. That stability is exactly what you need for serious analysis.
The Impact on Risk and Volatility Models
This difference between a simple close and a volume-weighted average has huge consequences, especially for risk modeling and strategy backtesting. Volatility is a core ingredient for everything from pricing options to sizing up your positions. If that input is based on the noisy, single-point data of a closing price, your entire model can be built on a shaky foundation.
In fact, historical studies show that swapping out closing prices for daily VWAP values can significantly change volatility estimates. One analysis found that volatility calculated from a VWAP series can be around 5.4% lower than volatility derived from closing prices. This happens because VWAP captures the entire day's trading activity, providing a more stable and less erratic data point. You can dig deeper into how VWAP changes volatility calculations on InfiniteEquity.com.
For quantitative analysts, this isn't just a minor detail. Replacing daily closes with daily VWAPs in a one-year sample can alter historical standard deviation and value-at-risk estimates by several percentage points. That directly impacts how much risk a trading desk is allowed to take on.
A Professional-Grade Tool for System Development
This is precisely why quantitative developers and algorithmic traders go to great lengths to get their hands on minute-by-minute or even tick-by-tick data. They aren't just looking for the close; they need that granular data to compute an accurate daily VWAP for backtesting their automated strategies.
A system that looks profitable when tested against closing prices might show completely different results when run against the more robust benchmark of VWAP.
Think of it this way:
- Closing Price: Tells you where the market ended.
- VWAP: Shows you where the market's money actually was.
This distinction is fundamental. The big institutional execution algorithms—the ones moving massive blocks of shares—are often programmed to buy or sell relative to VWAP, not the close. So, if you want to accurately test a strategy that mimics or reacts to these large players, using VWAP-based data isn't just a preference; it's a necessity.
It gives you a much truer picture of historical market dynamics, leading to more reliable backtests and proving that VWAP is a professional-grade tool that goes far beyond simple chart analysis.
Putting VWAP into Action with ChartsWatcher
Theory is great, but the real test is applying it to a live chart. Let's walk through how to take the VWAP strategies we've just covered and put them to work inside the ChartsWatcher platform. This is where we go from knowing what VWAP is to actually using it to spot real-time opportunities.
ChartsWatcher was built for exactly this kind of practical application. It lets you do more than just see the VWAP line; you can build automated systems around it. The whole idea is to let the software do the heavy lifting—the constant market monitoring—so you can focus on making smart trades.
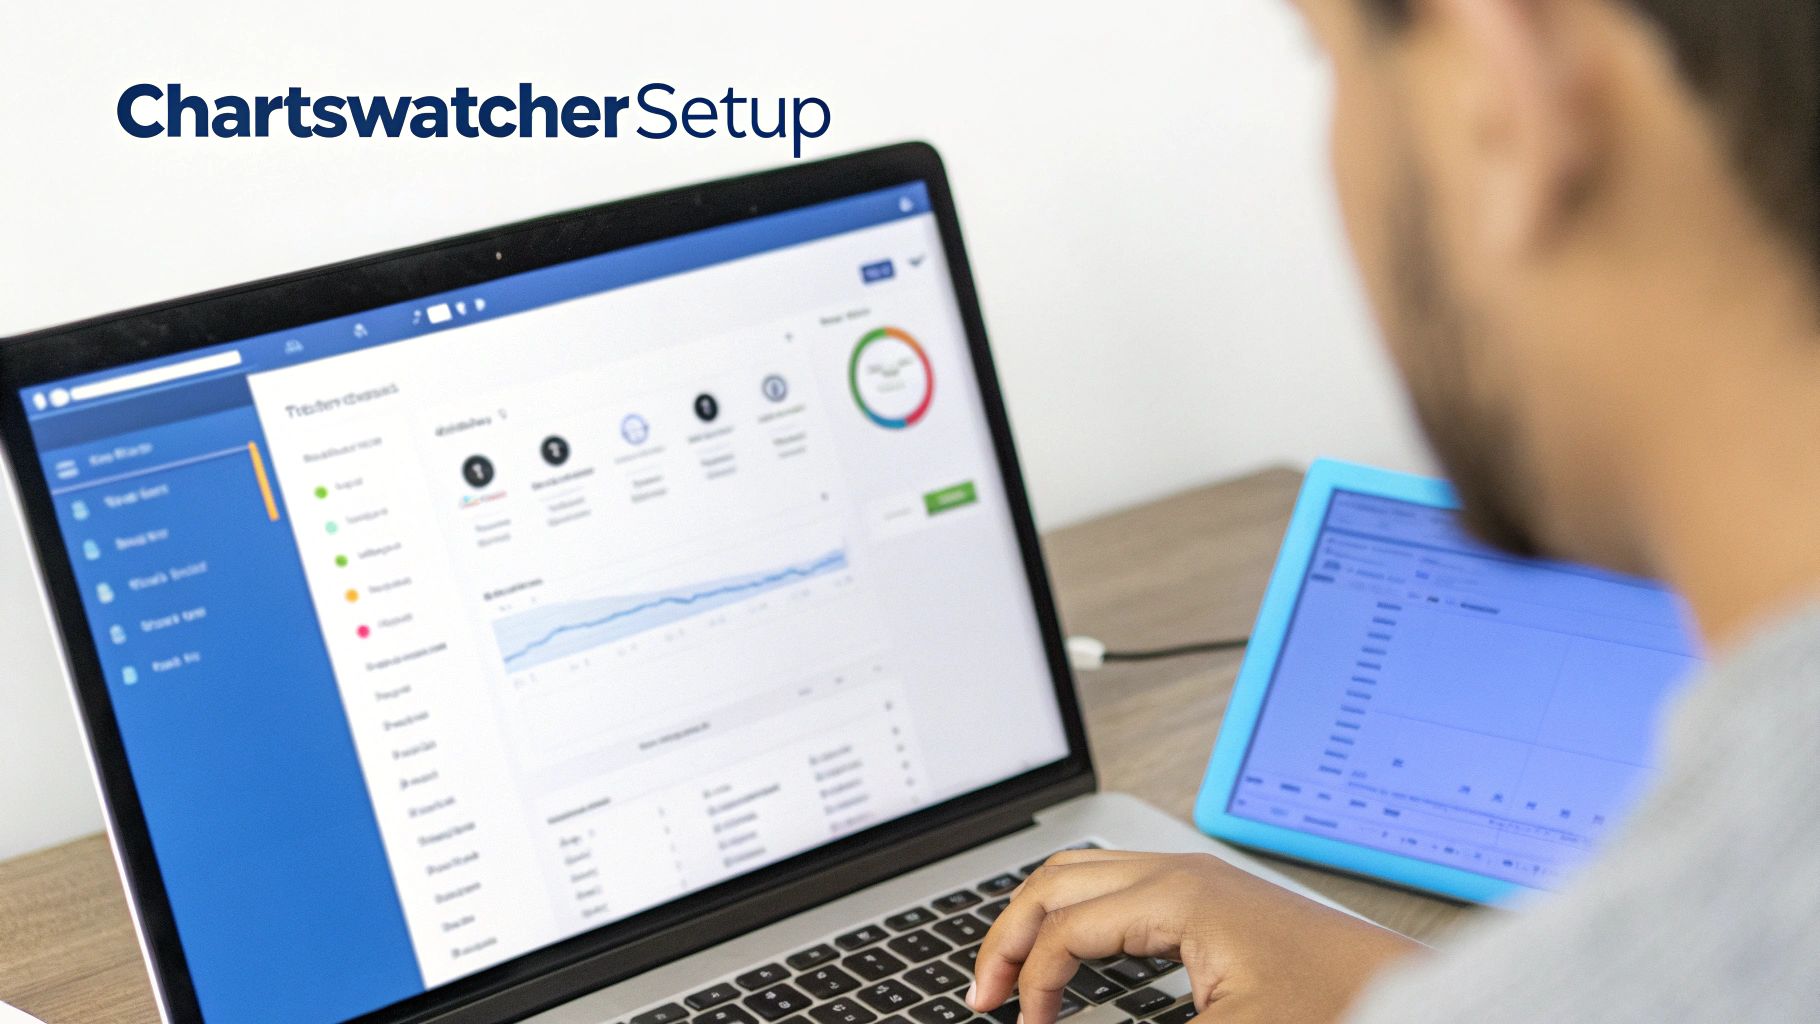
This kind of setup is all about integrating VWAP charts, alerts, and watchlists to give you a complete, actionable view of the market.
Setting Up Your VWAP Indicator and Alerts
First things first: you need to add the VWAP indicator to your charts. Inside ChartsWatcher, just select VWAP from the indicator list. You can easily customize its look and feel, including the standard deviation bands that are so critical for mean reversion plays.
But once the indicator is on your chart, the real power comes from setting up alerts. Instead of gluing your eyes to the screen waiting for a price to hit VWAP, you can create a rule that pings you the second your specific condition is met.
You can set alerts for key VWAP events, such as:
- VWAP Crossover: Get a notification the moment a stock's price punches above or drops below the VWAP line. This is your go-to signal for potential breakout or breakdown trades.
- VWAP Band Touch: Set an alert for when the price stretches out and touches the upper or lower standard deviation bands. This is your heads-up for potential overbought or oversold conditions.
- VWAP Rejection: Perfect for pullback strategies. You can build a fine-tuned alert to spot when a price touches VWAP and then bounces off, confirming it as support or resistance. For a deep dive on this setup, check out our guide on how to create a VWAP rejection scanner.
These automated triggers are your personal market watchdogs, making sure you never miss a setup that fits your trading plan.
Backtesting Your VWAP Strategies
Confidence in a trading strategy comes from data, not gut feelings. This is where ChartsWatcher's backtesting feature becomes an absolute game-changer. Before you risk a single dollar of your hard-earned capital, you can test every VWAP strategy from this guide on historical data for any stock you want.
Here’s a quick rundown of how you'd backtest a VWAP pullback strategy:
- Define Your Rules: Get specific. For example: "Buy when price pulls back to and bounces off a rising VWAP on higher-than-average volume."
- Select Your Ticker and Timeframe: Pick the stock and the historical period you want to test your strategy against.
- Run the Backtest: Let the platform do the work. It will simulate your strategy over the period you chose, showing you exactly how it would have performed.
- Analyze the Results: Dig into the metrics. Look at the win rate, profit factor, and maximum drawdown to see if the strategy actually has a statistical edge.
By backtesting, you can figure out which VWAP strategies work best for your favorite stocks and under what market conditions. This data-driven approach lets you refine your entry and exit rules, helping you build a solid trading plan based on historical performance, not emotion.
Common Questions About VWAP
Once you start getting the hang of VWAP, a few key questions almost always pop up. Let's tackle them head-on to clear up any confusion and make sure you're using this tool the right way.
Think of this as a quick debrief to solidify the core concepts we've covered.
Can I Use VWAP For Swing Trading?
Short answer: absolutely not. Standard VWAP is a day trader's tool, period. Its calculation is designed to reset every single morning at the opening bell. That means yesterday's VWAP has zero relevance to today's price action.
Its entire job is to define value within a single session. For swing trading, where you're holding for multiple days or weeks, you need to be looking at indicators built for that timeframe. Stick to tools like the 20, 50, or 200-day moving averages—they're designed to track longer-term trends. Using daily VWAP for a swing trade is like using a stopwatch to time a marathon; it's the wrong tool for the job.
What Is the Difference Between VWAP and Anchored VWAP?
This is a fantastic question, and the distinction is critical. Standard VWAP is locked in; it always starts its calculation from the current day's market open. Anchored VWAP (AVWAP) is the flexible, more powerful version because it puts you in control of the starting point.
The key difference is flexibility. Standard VWAP benchmarks the current day's trading session. Anchored VWAP allows you to benchmark price action from any specific event or moment in time you choose.
So, why does that matter? It lets you see how price has behaved relative to value since a major catalyst. You can "anchor" the VWAP calculation to a specific event—an earnings release, a Fed announcement, or a major technical breakout. This creates a custom, contextual benchmark that shows you the volume-weighted average price paid since that moment, giving you a much smarter view of market sentiment.
How Does Trading Volume Directly Impact the VWAP Line?
Volume isn't just one part of the VWAP formula; it’s the secret sauce. It's what gives the indicator its power. The VWAP line is like a magnet, and it's constantly being pulled toward the price levels where the most shares are changing hands.
Think about it: a single, massive block trade from an institution will yank the VWAP line much harder than thousands of small retail trades happening at other prices.
This is exactly why VWAP reflects the "true" average price. It cuts through the noise of low-volume price wiggles and tells you where the big money was actually put to work. It shows you the session's financial center of gravity, plain and simple.
Ready to stop missing opportunities and start trading with a data-driven edge? ChartsWatcher provides the advanced scanning, alerting, and backtesting tools you need to implement these VWAP strategies like a pro. Build your first VWAP scanner today at https://chartswatcher.com and take control of your trading.
