6 Powerful VWAP Trading Strategies for 2025
The Volume Weighted Average Price (VWAP) is far more than just another technical indicator; it's a critical benchmark used by institutional traders to gauge trade execution quality and identify fair value. For retail traders, this provides a powerful edge, offering a clear view into where the "big money" is active. Understanding how to interpret and apply VWAP can transform your approach from reactive to proactive, allowing you to align your positions with significant market participants.
This guide is designed to move you beyond basic theory. We will provide a curated list of six actionable VWAP trading strategies that you can test and integrate into your system. Each strategy is broken down into specific entry triggers, exit rules, and essential risk management principles. You won't find generic advice here, but rather a practical toolkit for leveraging this dynamic indicator. We will explore everything from mean reversion and breakout tactics to multi-timeframe analysis and opening range plays. By the end, you'll have a clear framework for using VWAP not just as a lagging line, but as a predictive tool to anticipate market movements and improve your trading precision.
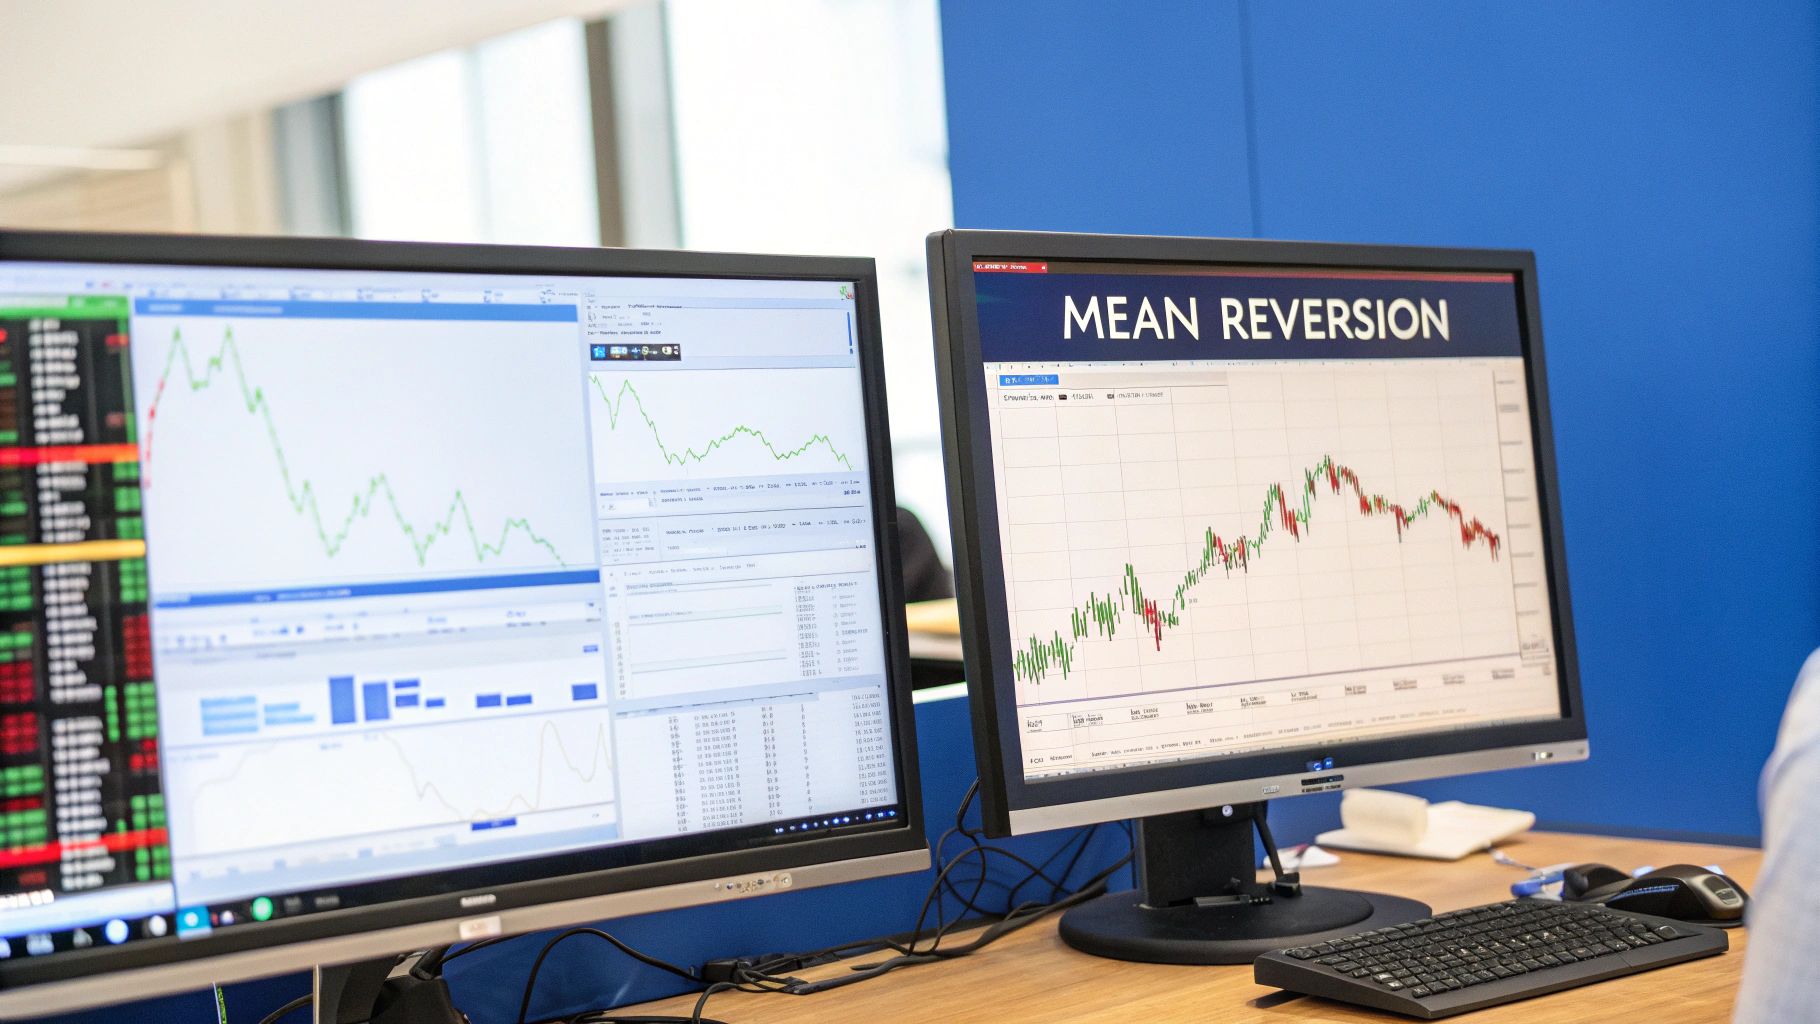
1. VWAP Mean Reversion Strategy
The VWAP Mean Reversion strategy is a cornerstone for many intraday traders and one of the most intuitive VWAP trading strategies. It operates on a simple, yet powerful, financial principle: prices may stray, but they often return to their average. In this context, the VWAP line acts as a dynamic 'center of gravity' for the day's price action. When an asset's price moves significantly above or below the VWAP, it is considered overextended, creating a high-probability opportunity for it to snap back toward this value area.
This strategy is particularly effective in markets that are consolidating or ranging, where neither bulls nor bears have definitive control. The core idea is to identify these temporary price extremes and enter a trade in the opposite direction, anticipating the reversion. For instance, if a stock price shoots up far above its VWAP without strong catalytic news, a mean reversion trader would look to initiate a short position, betting on its eventual return to the average.
How It Works: Entry and Exit Rules
Executing this strategy requires clear entry and exit points. Traders often use VWAP Standard Deviation Bands to objectively identify when a price is "too far" from the mean.
- Entry Signal (Long): Look for the price to drop significantly below the VWAP, often touching or breaching the lower standard deviation band (e.g., -2 or -3 standard deviations). A bullish reversal candlestick pattern at this level provides a strong entry confirmation.
- Entry Signal (Short): Identify when the price rallies significantly above the VWAP, touching or breaching the upper standard deviation band (e.g., +2 or +3 standard deviations). A bearish candlestick pattern, like a shooting star, signals a potential entry.
- Exit Target: The primary profit target is typically the VWAP line itself. Aggressive traders may aim for the opposite deviation band, but exiting at VWAP is the most common approach.
- Stop-Loss: Place a tight stop-loss just beyond the entry candlestick's high (for shorts) or low (for longs). A failed reversion can lead to a strong trend, so disciplined risk management is crucial.
Key Insight: The effectiveness of mean reversion relies on volume. A price deviation on low volume is more likely to revert than one driven by a high-volume breakout, which could signal the start of a new trend.
Implementation on ChartsWatcher
On the ChartsWatcher platform, you can easily implement this strategy. First, add the VWAP indicator to your chart. Then, enhance it by adding VWAP Standard Deviation Bands, setting the deviations to 2.0 and 3.0. This visual tool immediately highlights overextended areas. You can then set up alerts to notify you when the price touches these outer bands on your chosen tickers, ensuring you never miss a potential setup.
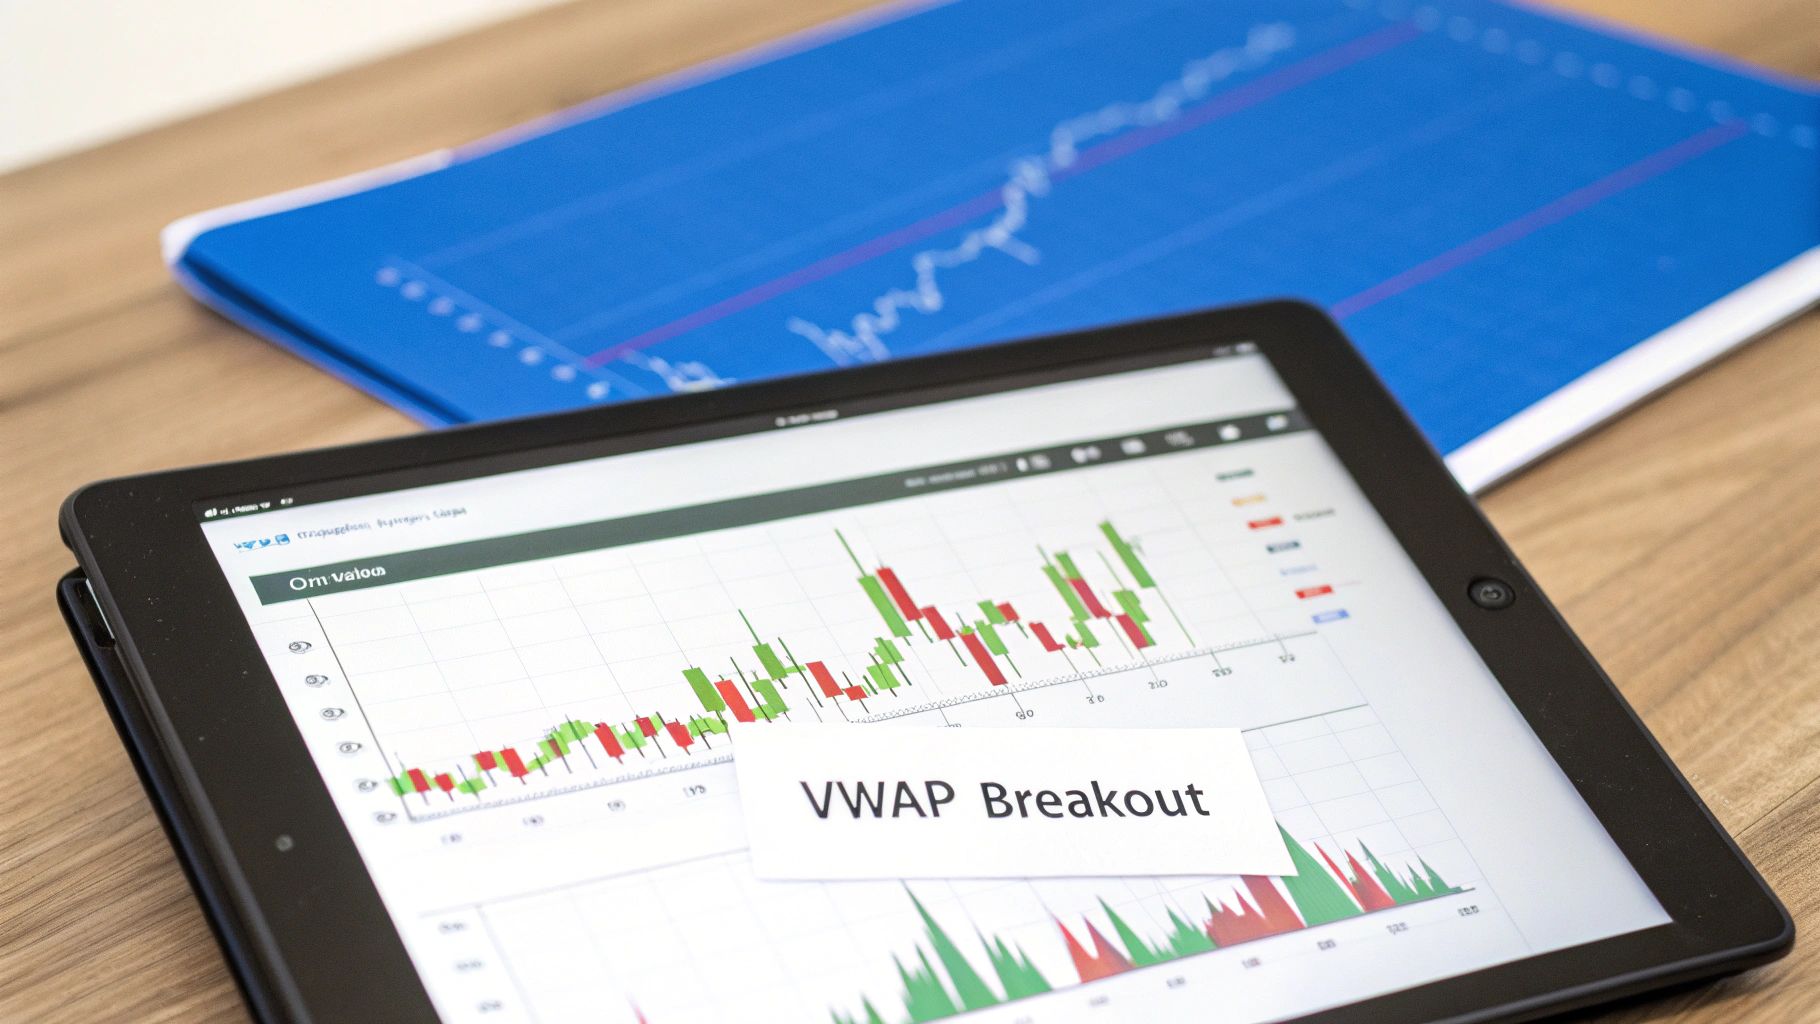
2. VWAP Breakout Strategy
While mean reversion capitalizes on prices returning to the average, the VWAP Breakout strategy does the opposite. It’s one of the most powerful VWAP trading strategies for trending markets, designed to capture strong directional moves. This approach operates on the principle that the VWAP line acts as a dynamic level of support or resistance. A decisive break of this line, especially when backed by significant volume, signals a shift in market sentiment and the potential start of a new intraday trend.
This strategy is particularly effective during the first couple of hours after the market opens when institutional order flow is highest and new trends are established. It’s a momentum-based approach where traders aren't fighting the trend, but rather joining it as it gains strength. For instance, if a stock like Tesla has been trading below VWAP and then surges above it with a massive spike in volume following positive news, a breakout trader would see this as a strong signal to go long, anticipating further upside momentum.
How It Works: Entry and Exit Rules
A successful breakout trade relies on confirmation and speed. The key is to distinguish a genuine breakout from a false one, which is where volume and candlestick analysis become critical.
- Entry Signal (Long): Wait for the price to break decisively above the VWAP line with a strong, full-bodied bullish candle. This breakout must be accompanied by a noticeable increase in volume, ideally well above its recent average.
- Entry Signal (Short): Look for the price to break down below the VWAP with a large bearish candle. The move should be confirmed by a surge in selling volume, indicating conviction from the sellers.
- Exit Target: Profit targets can be set using technical levels like previous highs/lows, pivot points, or by using a trailing stop to ride the trend for as long as it lasts. A common technique is to take partial profits at a 1:2 or 1:3 risk-reward ratio.
- Stop-Loss: A stop-loss should be placed just on the other side of the VWAP line. For a long trade, it would go slightly below the VWAP; for a short, slightly above it. This ensures you are quickly taken out of the trade if the breakout fails.
Key Insight: A true breakout often retests the VWAP line before continuing in the breakout direction. A successful retest, where the price touches the VWAP (now acting as support or resistance) and bounces off, is a very strong confirmation signal and can offer a secondary, lower-risk entry point.
Implementation on ChartsWatcher
You can effectively execute this strategy on the ChartsWatcher platform. Start by adding the VWAP indicator to your chart. To confirm the strength of the move, add the Volume indicator as well. Set up alerts to trigger when the price crosses the VWAP line on your selected stocks. You can further refine this by creating a custom scan in the screener to find stocks that are crossing their VWAP with a volume surge of over 200% of the average, delivering high-probability breakout candidates directly to you.
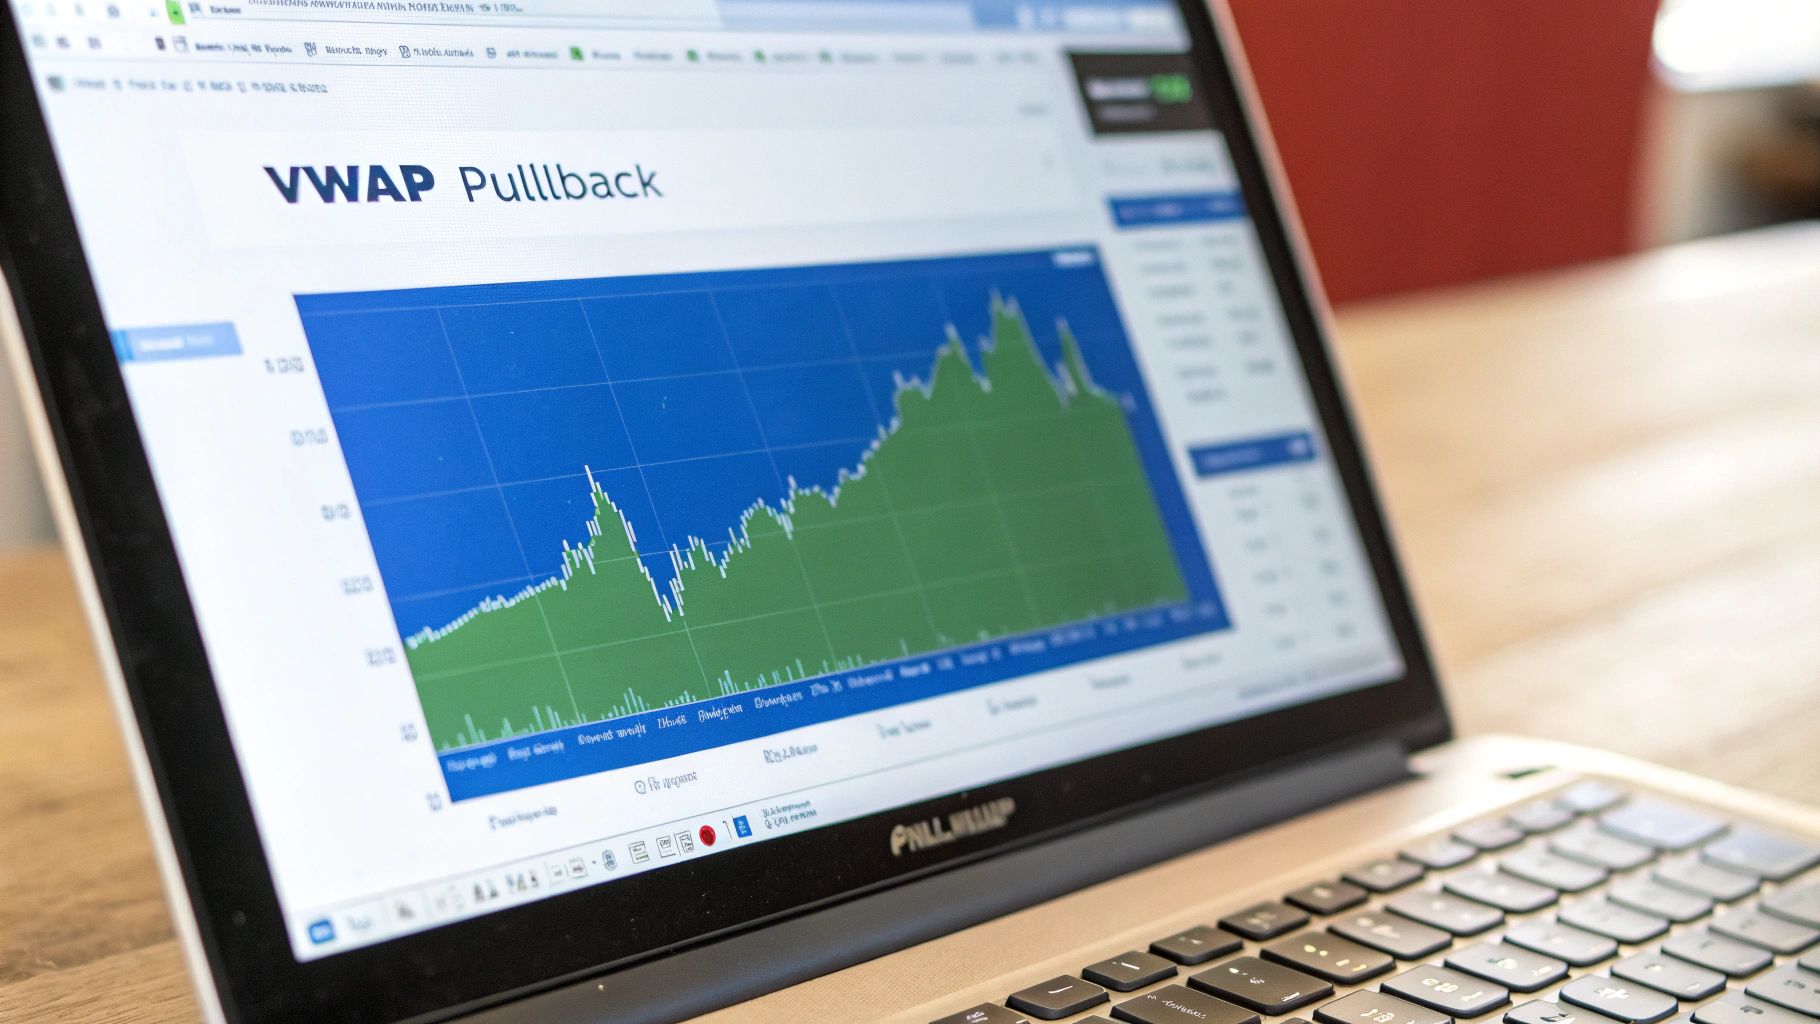
3. VWAP Pullback Strategy
The VWAP Pullback strategy is a classic trend-following technique and one of the most reliable VWAP trading strategies for traders looking to enter a market with an established direction. Instead of chasing a breakout, this method focuses on patience, waiting for the price to return or "pull back" to the VWAP line before entering. In a strong uptrend, VWAP often acts as a dynamic support level, while in a downtrend, it serves as dynamic resistance.
This approach allows traders to join a prevailing trend at a more favorable price, reducing risk compared to buying at the high or shorting at the low. It is particularly powerful in strongly trending markets where institutional activity consistently defends the average price level. For example, if a stock like Amazon is in a clear uptrend, dips back to the VWAP line often represent low-risk buying opportunities before the next leg up.
How It Works: Entry and Exit Rules
Success with this strategy hinges on correctly identifying the trend and patiently waiting for the optimal entry point at the VWAP.
- Entry Signal (Long): First, confirm a clear intraday uptrend (higher highs and higher lows). Wait for the price to pull back and touch the VWAP line from above. A bullish confirmation candle, like a hammer or bullish engulfing pattern right at the VWAP, provides a strong signal to enter a long position.
- Entry Signal (Short): Establish that the asset is in a downtrend (lower highs and lower lows). Wait for the price to rally back up to the VWAP line from below. A bearish reversal candle, such as a shooting star, at this resistance level signals a high-probability short entry.
- Exit Target: The primary profit target is typically the previous high in an uptrend or the previous low in a downtrend. More advanced traders might use Fibonacci extensions or a trailing stop to maximize profits.
- Stop-Loss: Place the stop-loss just below the VWAP and the entry candle's low for a long position, or just above the VWAP and the entry candle's high for a short position. This gives the trade a small amount of room to breathe without taking on excessive risk.
Key Insight: The quality of a VWAP pullback signal increases significantly when it aligns with the trend on a higher timeframe. If the daily chart is bullish, an intraday pullback to the VWAP is a much stronger buy signal.
Implementation on ChartsWatcher
You can effectively execute this strategy on ChartsWatcher. Begin by adding the VWAP indicator to your chart of choice. To confirm the overarching trend direction, consider adding a longer-period moving average, like the 50 EMA, to your chart as well. Set up alerts on ChartsWatcher to notify you when the price of your selected instrument crosses or touches the VWAP line. This automated monitoring ensures you can capitalize on pullback opportunities without being glued to your screen, allowing for precise and timely entries.
4. Multi-Timeframe VWAP Strategy
The Multi-Timeframe VWAP strategy elevates the standard VWAP analysis by layering insights from different periods, offering a more comprehensive view of market sentiment. This sophisticated approach, one of the more advanced VWAP trading strategies, involves plotting VWAP lines from daily, weekly, and even monthly timeframes onto a single chart. This allows traders to distinguish between short-term noise and significant, longer-term institutional positioning.
This strategy is built on the idea that institutional players operate across various time horizons. A level that is important on both the daily and weekly charts carries far more weight than one significant only on a 5-minute chart. By identifying these "confluence zones" where multiple VWAP levels align, traders can pinpoint high-probability areas of support and resistance, making their entries and exits more precise and informed. For instance, a major index like the S&P 500 might find strong support at a level where the daily and weekly VWAPs converge during a market correction.
The following concept map illustrates how VWAP levels from different timeframes combine to create powerful confluence zones.
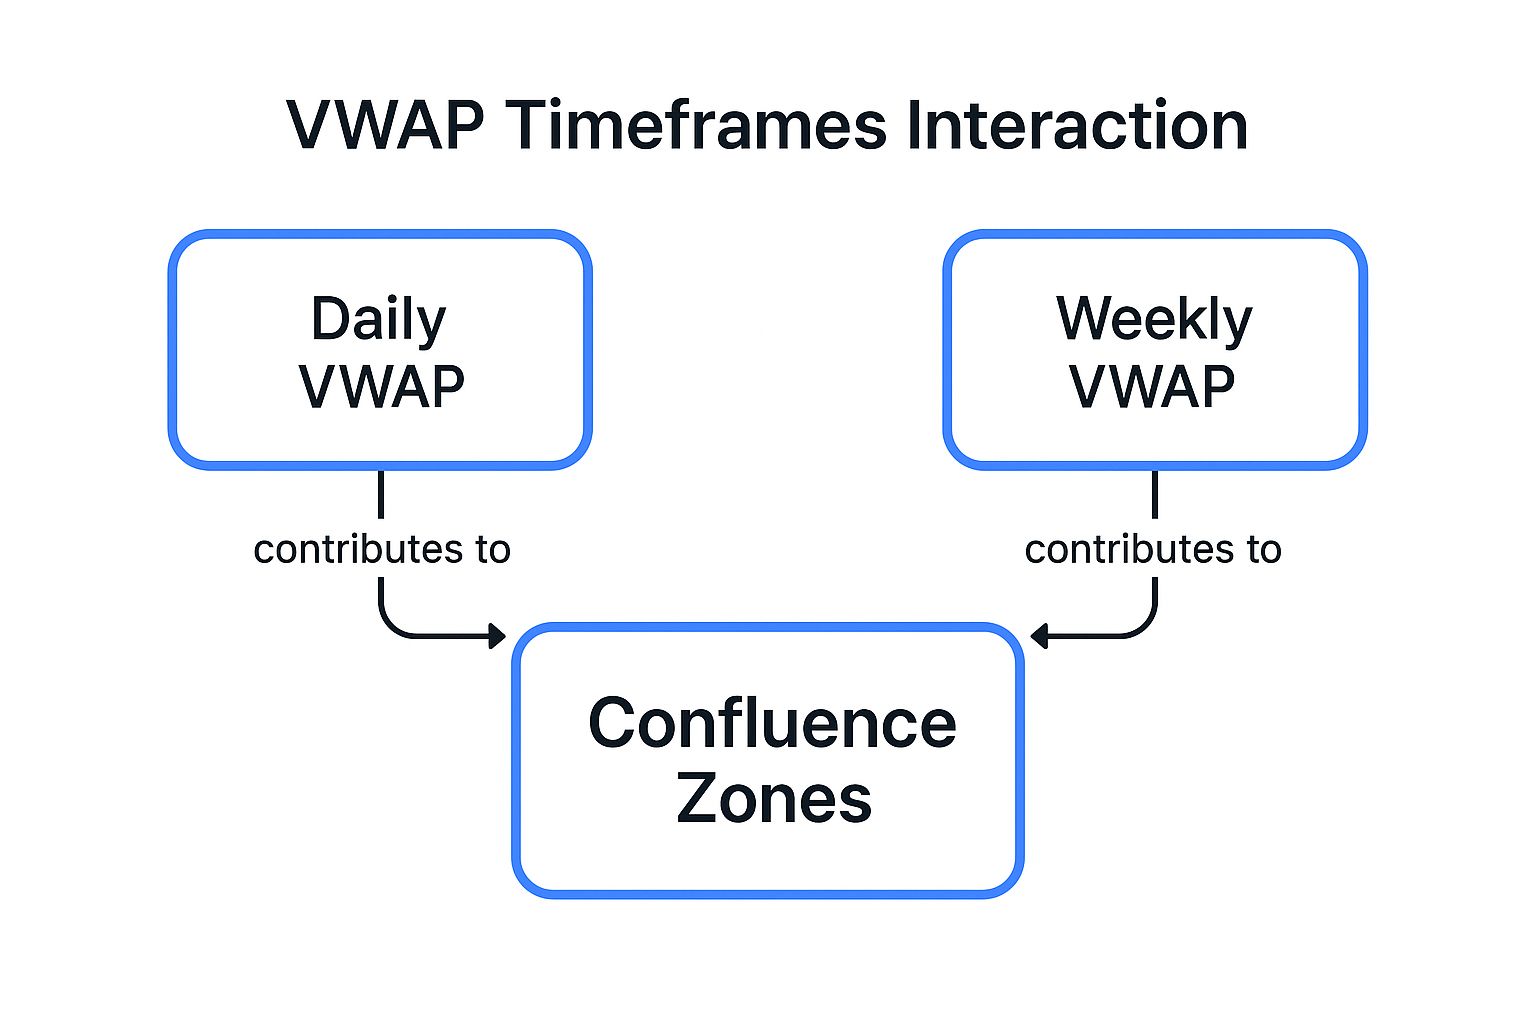
This visualization highlights that when short-term (daily) and long-term (weekly) value areas overlap, they form a reinforced price level that often acts as a strong market pivot.
How It Works: Entry and Exit Rules
Executing this strategy involves identifying these key confluence points and observing the price action around them. The goal is to trade in the direction of the longer-term trend when the price reacts to these stacked VWAP levels.
- Entry Signal (Long): Look for the price to pull back to a confluence zone where the daily VWAP and weekly VWAP are closely aligned. A bounce off this zone, confirmed by a bullish candlestick pattern, signals a strong long entry.
- Entry Signal (Short): Identify the price rallying up to a confluence of daily and weekly VWAP levels acting as resistance. A rejection at this level, confirmed by a bearish reversal pattern, provides a high-probability short entry.
- Exit Target: Profit targets can be set at the next significant price structure or the next major VWAP level from another timeframe.
- Stop-Loss: Place the stop-loss just below the confluence zone for a long trade or just above it for a short trade. A clean break of the zone indicates the setup has failed.
Key Insight: The more VWAP levels that converge in a tight price range, the stronger the potential support or resistance. An area where anchored, daily, and weekly VWAPs meet is an extremely significant level watched by institutional traders.
Implementation on ChartsWatcher
You can effectively apply this strategy on ChartsWatcher by layering multiple VWAP indicators onto your chart. Add the standard intraday VWAP, then add another VWAP indicator and set its anchor period to "Weekly" and another to "Monthly". You can also add anchored VWAPs from significant dates like a previous earnings announcement or a Federal Reserve meeting. This creates a complete map of significant value areas, helping you trade alongside institutional flow. For a deeper dive, you can explore a trader's guide on how to use VWAP on chartswatcher.com.
5. VWAP and Moving Average Crossover Strategy
The VWAP and Moving Average Crossover strategy enhances traditional trend-following signals by integrating the volume-weighted context of VWAP. This hybrid approach is one of the more robust VWAP trading strategies, designed to filter out false signals and provide stronger confirmation for trend changes. By combining the real-time, volume-sensitive VWAP with a smoother, price-based moving average (MA), traders can gain a clearer picture of market momentum and institutional sentiment.
This strategy operates on the principle that when the short-term, volume-heavy consensus (VWAP) crosses a longer-term price average (like a 20 or 50 EMA), it signifies a potential shift in trend control. For instance, when VWAP crosses above the 50-period moving average, it suggests that current buying pressure is strong enough to overtake the longer-term price average, signaling a potential bullish move. This combination helps traders avoid whipsaws common in choppy markets where price alone can be misleading.
How It Works: Entry and Exit Rules
Executing this strategy involves identifying clean crossovers backed by supportive market conditions. The choice of moving average period can be adjusted for different trading styles, from short-term scalping to longer intraday holds.
- Entry Signal (Long): Look for the VWAP line to cross decisively above a key moving average (e.g., 20 EMA or 50 SMA). This signal is strengthened if it occurs with a notable increase in trading volume and the price is also above both indicators.
- Entry Signal (Short): Wait for the VWAP line to cross below the chosen moving average. A confirmation would be an increase in volume on the crossover candle and the price trading below both the VWAP and the MA.
- Exit Target: Profit targets can be set at key support or resistance levels, or traders can use a trailing stop. Another exit strategy is to close the position when the VWAP crosses back over the moving average in the opposite direction.
- Stop-Loss: Place a stop-loss on the other side of the crossover structure. For a long entry, a stop could be placed below the low of the crossover candle or just below the moving average line.
Key Insight: The angle and separation of the crossover are critical. A steep, decisive crossover with widening space between the VWAP and MA indicates strong momentum, whereas a flat, tangled crossover often signals a weak or unreliable trend.
Implementation on ChartsWatcher
To apply this strategy on ChartsWatcher, first add the VWAP indicator to your intraday chart. Next, overlay a Moving Average (Exponential or Simple) and configure its period (e.g., 20 for short-term or 50 for mid-term trends). You can then set up a custom alert for when the "VWAP" crosses the "EMA(20)," for example. This setup ensures you are immediately notified of potential trend shifts, allowing for timely analysis and execution. For a deeper understanding of crossover mechanics, you can learn more about the moving average crossover strategy on chartswatcher.com.
6. Opening Range VWAP Strategy
The Opening Range VWAP strategy is a powerful method used by day traders to capitalize on the critical first 30 to 60 minutes of the trading session. This approach is one of the most time-sensitive VWAP trading strategies, operating on the premise that the initial interaction between price and the newly forming VWAP reveals the dominant institutional sentiment that could set the tone for the rest of the day. The VWAP calculated from the market open acts as a crucial intraday pivot point.
This strategy is highly effective because the opening bell brings a surge of volume and volatility as overnight orders are filled and institutions establish their positions. Traders watch closely to see if the price establishes a clear trend by breaking away from the opening VWAP or if it uses the VWAP as a support or resistance level. A decisive move away from the opening VWAP can signal a strong directional bias for the trading day. For example, a stock gapping up and then finding firm support at its new VWAP indicates strong buying pressure.
How It Works: Entry and Exit Rules
Executing this strategy requires patience during the initial volatile minutes and decisiveness once a direction is established. The opening range (e.g., the first 30 minutes) high and low, combined with the VWAP, create key reference points.
- Entry Signal (Long): Wait for the initial opening volatility to subside. Look for the price to break above both the opening range high and the VWAP line on significant volume. Another entry is when the price pulls back and successfully tests the VWAP line as support.
- Entry Signal (Short): Observe the price as it breaks below both the opening range low and the VWAP line with convincing volume. A secondary entry can be taken if the price rallies back to the VWAP and is rejected, treating it as new resistance.
- Exit Target: Profit targets can be set at key intraday support/resistance levels, a predetermined risk/reward ratio (e.g., 2:1), or the previous day's high/low.
- Stop-Loss: A stop-loss should be placed on the opposite side of the VWAP line. For a long entry, place it just below the VWAP; for a short entry, place it just above the VWAP to protect against a reversal.
Key Insight: The most reliable signals occur after the first 15-30 minutes of trading. Acting too early can lead to "head fakes" caused by initial market noise and order imbalances.
Implementation on ChartsWatcher
You can effectively implement the Opening Range VWAP strategy on ChartsWatcher. Start by adding the VWAP indicator to your chart, ensuring it is set to a "Session" reset. This will start a new VWAP calculation each day at the market open. Next, use the drawing tools to mark the high and low of your chosen opening range (e.g., the first 30 minutes). You can then set price alerts on ChartsWatcher to notify you when the price crosses above or below these key levels and the VWAP, allowing you to react quickly to breakouts or rejections.
VWAP Trading Strategies Comparison
| Strategy | Implementation Complexity 🔄 | Resource Requirements ⚡ | Expected Outcomes 📊 | Ideal Use Cases 💡 | Key Advantages ⭐ |
|---|---|---|---|---|---|
| VWAP Mean Reversion Strategy | Medium – requires quick decisions and execution | Moderate – needs intraday volume data and fast reactions | High win rates in ranging markets, prone to small losses in breakouts | Intraday scalping, ranging markets, liquid instruments | Clear entry/exit, reduces emotional trades, effective in sideways trends |
| VWAP Breakout Strategy | High – timing and volume confirmation critical | High – volume monitoring and risk management essential | Captures strong trending moves early but prone to false breakouts | Trending markets, market opens, momentum-based trading | High reward-to-risk potential, clear directional bias on breakout |
| VWAP Pullback Strategy | Medium – requires patience and trend confirmation | Moderate – volume and trend analysis needed | Better risk-to-reward than breakouts, may miss fast moves without pullbacks | Trending markets, both bull and bear environments | Joins trends at optimal price, reduces FOMO, dynamic support/resistance use |
| Multi-Timeframe VWAP Strategy | Very High – complex multi-chart analysis, risk of analysis paralysis | High – multiple timeframes and significant screen time needed | Higher probability trades via confluence, reduces false signals | Institutional traders, longer-term and short-term market context | Provides comprehensive market view, strong confluence zones, reduced noise |
| VWAP and Moving Average Crossover Strategy | Medium – requires MA period optimization and volume confirmation | Moderate – combining VWAP and multiple MAs requires backtesting | Reliable trend capture, slow signals possible with lag | Trending markets, intraday to swing trading | Dual confirmation reduces false signals, clear entry/exit rules |
| Opening Range VWAP Strategy | Medium – focused on early session timing and volatility | Moderate – requires early availability and volume monitoring | Captures early institutional sentiment, volatile with some false signals | Market open trading, high volume periods, institutional order flow analysis | Clear session timeframe, reliable VWAP during opening, early momentum capture |
Integrating VWAP Strategies into Your Trading System
We have explored a powerful arsenal of six distinct VWAP trading strategies, from the foundational Mean Reversion and Breakout approaches to more nuanced methods like the Multi-Timeframe and Opening Range strategies. Each strategy offers a unique lens through which to interpret market dynamics, using the Volume Weighted Average Price as a critical barometer for institutional activity and fair value.
The true power of VWAP, however, is not in rigidly applying a single formula, but in understanding its underlying principles. It serves as a dynamic benchmark of price relative to volume, providing a clear reference point for momentum, exhaustion, and potential shifts in market control. Whether you're capturing pullbacks to the VWAP line, trading breakouts with volume confirmation, or using it as a trend filter in conjunction with moving averages, the core concept remains the same: you are aligning your trades with the flow of significant market participation.
From Knowledge to Actionable Skill
Mastering these VWAP trading strategies requires moving from theoretical knowledge to practical application. The journey from understanding a concept to trading it profitably is paved with deliberate practice, rigorous backtesting, and consistent refinement. Blindly following entry signals is a recipe for failure; success lies in integrating these strategies into a holistic trading plan that is uniquely your own.
Here are the critical next steps to transform this information into a tangible edge:
- Select and Specialize: Do not try to master all six strategies at once. Choose one or two that resonate most with your personal trading style and risk tolerance. A trader who thrives on quick, momentum-based plays might gravitate towards the Breakout or Opening Range strategies, while a more patient trader might prefer the Mean Reversion or Pullback methods.
- Backtest with Precision: Before risking real capital, rigorously backtest your chosen strategies. Use historical data to identify how they perform under different market conditions (trending, ranging, high-volatility). This process is not about finding a "perfect" win rate; it’s about understanding the strategy's expectancy, typical drawdown, and a.
- Paper Trade in a Live Environment: Once you have positive backtesting results, transition to paper trading. This crucial step helps you adapt to the psychological pressures and execution challenges of a live market without financial risk. It allows you to practice identifying setups, managing trades, and executing your plan in real-time.
Building a Resilient Trading System
Remember, VWAP is a powerful indicator, but it is not infallible. Its effectiveness is magnified when used as part of a comprehensive trading system rather than as a standalone signal generator. Context is everything. Always consider the broader market structure, key support and resistance levels, and overall volume trends when analyzing VWAP signals.
A robust system combines the insights from your chosen VWAP strategy with solid risk management principles. Define your maximum risk per trade, use appropriate stop-loss orders, and have a clear plan for taking profits. The goal is not just to find winning trades but to build a resilient system that can withstand the inevitable losing streaks and protect your capital over the long term. By internalizing these concepts and committing to a structured implementation process, you can effectively leverage VWAP trading strategies to gain a significant and sustainable advantage in the markets.
Ready to put these VWAP trading strategies into action with professional-grade tools? ChartsWatcher provides an advanced, real-time stock screener and charting platform designed to help you identify and execute these setups with precision. Customize your scans, set complex alerts for VWAP crossovers, and analyze the market with institutional-quality data by visiting ChartsWatcher today.
