Mastering the Trading VWAP Strategy
When you're trying to get a real feel for the market's pulse, the Volume Weighted Average Price (VWAP) is an indispensable tool. At its core, a VWAP strategy is about using this indicator to pinpoint potential trade entries and get a read on market sentiment. It reveals the true average price of a stock by weaving in trading volume, which is why it’s a go-to benchmark for institutional traders. Mastering VWAP can genuinely give you an edge, especially in the fast-paced world of intraday trading.
Why the VWAP Strategy Is a Trader's Edge

Let's get past the textbook definition. The VWAP isn't just another squiggly line on your chart—it's a dynamic benchmark that offers a surprisingly clear window into market psychology. While a simple moving average (SMA) only cares about price, VWAP integrates volume. This tells you where the real money is moving.
That distinction makes all the difference. When a stock is trading above its VWAP line, it suggests buyers are in the driver's seat and are willing to pay a premium. On the flip side, when the price dips below VWAP, it’s a sign that sellers have the upper hand, and the stock is trading at a discount relative to the day's action.
A Dynamic View of the Market
The VWAP strategy is a staple for intraday trading because it blends price and volume so effectively. It calculates the average price of a security based on both factors throughout the day. One of the key insights here is that VWAP often acts as a dynamic support or resistance level. You'll frequently see prices that are above VWAP indicating a bullish trend, while prices hanging out below it signal bearish sentiment. For a deeper dive into its role, the folks at TraderVue have some great insights for traders.
The real power of VWAP is that it shows you the "fair value" based on actual transactions. It’s the price where the bulk of the day's volume was traded, giving you an objective reference point that cuts through the noise.
VWAP vs Simple Moving Average (SMA)
It's crucial to understand why VWAP is different from a Simple Moving Average (SMA). An SMA can sometimes be deceptive because it treats every price point equally, whether one share was traded or one million. VWAP, however, gives more weight to price levels with higher volume, painting a much more accurate picture of market conviction.
To put it plainly, here’s how they stack up.
VWAP vs Simple Moving Average (SMA)
| Feature | VWAP (Volume Weighted Average Price) | SMA (Simple Moving Average) |
|---|---|---|
| Calculation Basis | Price and Volume | Price Only |
| Primary Use Case | Intraday analysis and fair value assessment | General trend direction over any period |
| Reset Period | Resets daily at market open | Continuous, based on a set lookback period |
| Market Insight | Shows where institutional volume is active | Provides a smoothed-out price trend |
Ultimately, a VWAP trading strategy is about identifying who is winning the daily battle between buyers and sellers. By learning to interpret price action around this powerful line, you can make more informed decisions and trade high-volume intraday markets with much greater confidence.
Setting Up Your Charts for VWAP Analysis
A winning VWAP strategy starts with a clean, well-configured chart. A cluttered screen is a recipe for disaster, but a smart layout gives you instant clarity when you need it most. The first thing you'll do is add the Volume Weighted Average Price (VWAP) indicator to your chart in ChartsWatcher.
When you first apply it, you'll see a single line. That's your baseline VWAP. But the real magic happens when you add standard deviation bands. These bands create a channel around the VWAP line, giving you a powerful visual for identifying statistical extremes in price action.
Choosing Your Core Settings
In your trading platform, you'll likely see two main VWAP types: Session and Anchored. For the vast majority of day traders, the Session VWAP is the go-to. It resets automatically at the start of each trading day, which is exactly what you want for intraday analysis.
An Anchored VWAP is a bit more specialized. It lets you start the calculation from a specific point—like a major news event or a key high or low. It's a fantastic tool for more advanced analysis, but for building your core strategy, just stick with the Session VWAP for now.
Take a look at the screenshot below. You can see a standard chart with the VWAP (blue line) and its upper and lower deviation bands.
Notice how the price has a tendency to snap back to the central VWAP line after it touches one of the outer bands. Think of these bands as dynamic zones. When price hits them, it might be overextended, flagging a potential mean reversion trade.
Customization for Efficiency
When you're in the heat of the moment, visual cues are everything. Don't just accept the default colors; set up a scheme you can recognize in a split second.
Here’s a simple setup I like:
- VWAP Line: A neutral color like white or light blue.
- Upper Band: A "hot" color like red or orange to signal potentially overbought conditions.
- Lower Band: A "cool" color like green or aqua to signal potentially oversold conditions.
By customizing your visual setup, you train your brain to react faster. When you see the price hit your designated "hot" band, the instinct to look for a potential short setup becomes second nature.
Once you have your indicators and colors dialed in, do yourself a favor and save the layout as a chart template in ChartsWatcher. This one simple action will save you a ton of time every single morning. Instead of rebuilding your setup from scratch, you can load your perfected VWAP environment with a single click and be ready to hunt for opportunities at the market open.
To dive deeper into the indicator itself, check out our comprehensive trader's guide on how to use VWAP. This kind of prep work is the first step toward building a professional, repeatable trading routine.
Alright, with your charts set up and looking clean, it’s time to shift from preparation to execution. Having a powerful indicator is one thing, but it’s only as good as the strategy you use with it. When it comes to VWAP, I’ve found that two core setups consistently deliver the goods: mean reversion and trend continuation. If you can get a good handle on these two, you’ll have a flexible playbook for whatever the market throws at you.
The big idea here is pretty simple. Think of VWAP as the day's "fair" price. When the actual price stretches too far away from this line, it's like a rubber band being pulled taut. Sooner or later, it’s got a good chance of snapping back. That’s the entire premise behind a mean reversion trade.
Identifying Mean Reversion Opportunities
Mean reversion is all about trading the extremes. You're on the hunt for stocks that have pushed too far, too fast, away from that central VWAP line. Those standard deviation bands you added earlier? They’re about to become your best friend.
When the price rallies and tags—or even pokes just above—the upper deviation band, it’s a heads-up for a potentially overbought situation. On the flip side, a drop down to the lower band hints that the stock might be oversold. These aren't just blind buy or sell signals. Think of them as alerts that a high-probability reversion setup could be just around the corner.
Before jumping in, I always look for a little extra confirmation.
- Candlestick Patterns: A nasty-looking bearish engulfing candle or a shooting star right at the upper band can tell you that sellers are stepping in with force.
- Volume Spikes: See a big spike in volume as the price smacks into a band? That can signal exhaustion. For a short setup, it could be a buying climax. For a long, it might mean the sellers are all tapped out.
- Divergence: This one’s a classic. If the price is making a new high at the upper band, but an oscillator like RSI is making a lower high, it's a huge red flag that momentum is fading.
The image below gives you a great visual of how the VWAP calculation works by blending price and volume to create that mean value we’re trading around.
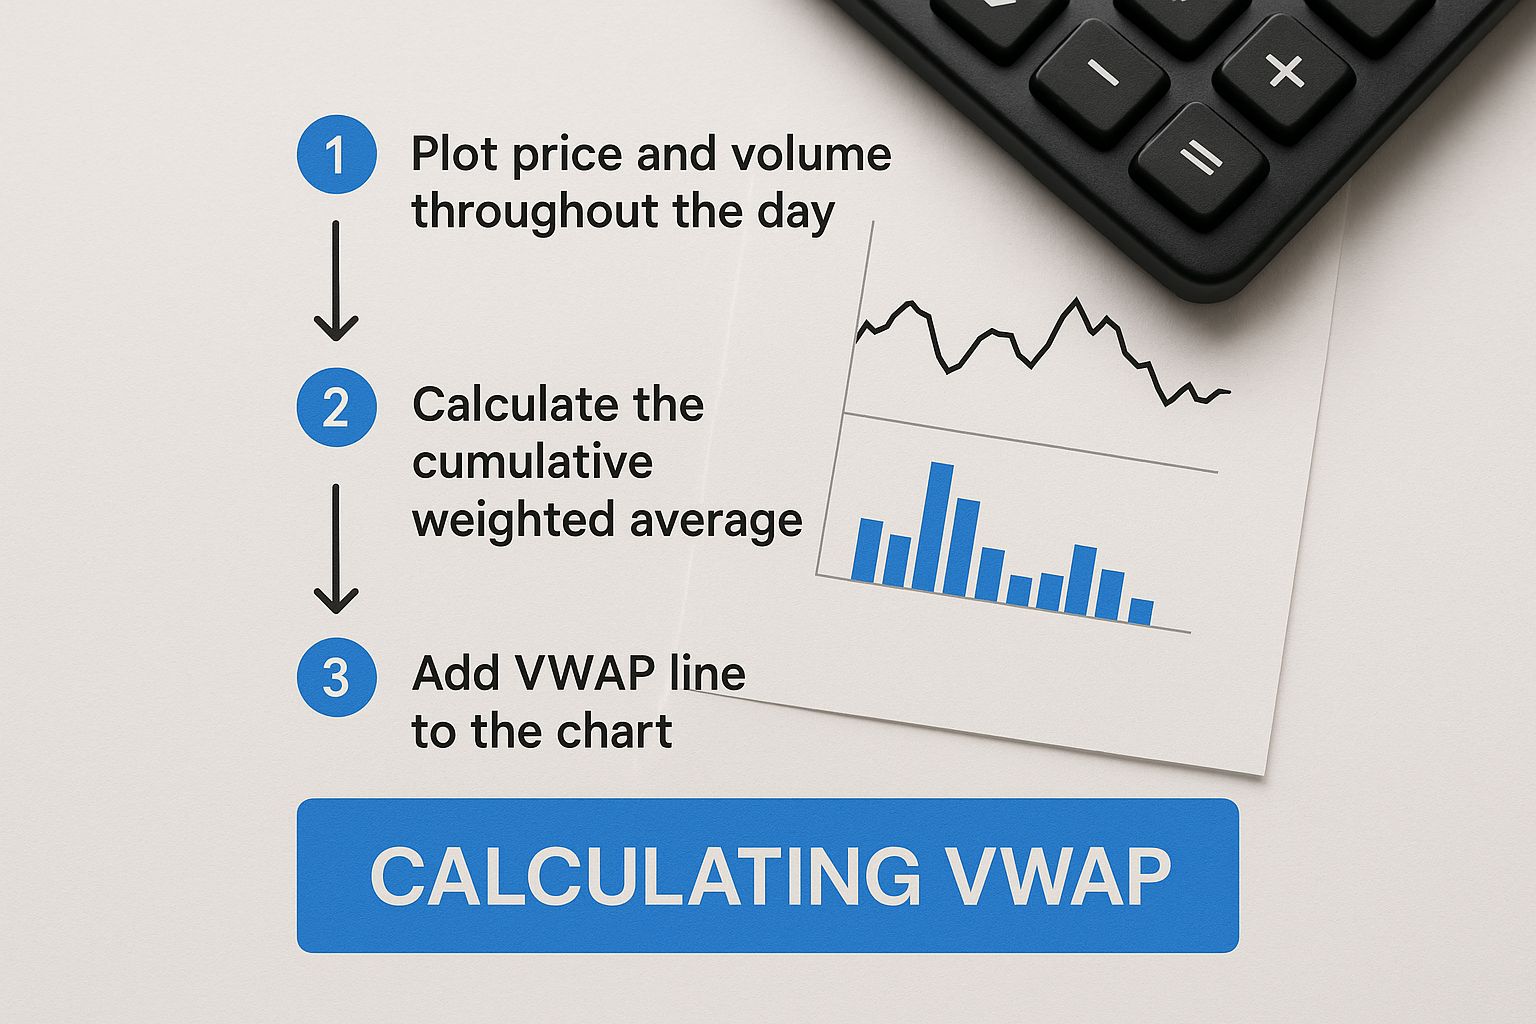
As you can see, weighting the price by volume is what gives VWAP its muscle, making it such a reliable benchmark for spotting these potential turning points.
Riding the Trend with VWAP
Mean reversion is fantastic in choppy, range-bound markets. But when a stock has a clear direction, trend continuation setups are where you'll really shine. In this VWAP strategy, the indicator’s role changes completely—it goes from being a magnet to being a dynamic level of support or resistance.
In a strong uptrend, you’ll often see the price staying consistently above the VWAP line. Here, instead of trying to short the highs, you use the pullbacks to the VWAP as your chance to get in on the action. The VWAP basically becomes a value zone where you can join the established trend at a discount.
And in a downtrend? It’s the exact opposite. The price will stubbornly stay below VWAP. For short setups, you’d be watching for rallies up to the VWAP line to initiate a position, betting that the primary downtrend will kick back in.
Pro Tip: When you’re looking to enter a trend continuation trade, don't just blindly place an order the second the price touches VWAP. I wait for the price to actually show that it's holding. A small bullish candle forming right on the VWAP line after a pullback is a much, much stronger entry signal.
Countless hours of backtesting this VWAP trading strategy have shown just how effective it can be for both reversion and trend-following. Studies have demonstrated that VWAP-based approaches can produce profitable results when used correctly intraday. By comparing a stock's live price to the VWAP benchmark, traders can dial in their entry and exit points with more confidence. You can even learn about the empirical results of VWAP algorithms to dig into the statistical edge.
Of course, both of these setups demand patience, confirmation, and—most importantly—rock-solid risk management, which is exactly what we’ll get into next.
A high-probability entry is only one piece of the puzzle. Honestly, even the best setups can fall apart without a disciplined way to manage your risk.
The good news? A VWAP trading strategy gives you a built-in, logical framework for defining your risk on every single trade. It helps take the guesswork and raw emotion out of the equation.
The core idea is to use the VWAP line and its deviation bands as clear points of invalidation. This ties your risk directly to the strategy itself, creating a simple but incredibly powerful system for protecting your capital.
Setting Your Stop-Loss with Precision
The most common way I see traders use VWAP for risk management is by placing their stop-loss just on the other side of the indicator. This technique makes your trading decisions objective. If the price crosses back over the VWAP, your trade thesis is likely no longer valid, and it’s time to get out.
Let's look at a classic trend-continuation setup:
- For a Long Trade: You enter as the price pulls back and bounces off the VWAP line in a strong uptrend. Where does your stop-loss go? Just below the VWAP. If the price breaks this dynamic support, it’s a big red flag that the trend might be failing.
- For a Short Trade: You enter as the price rallies up to the VWAP in a clear downtrend. In this case, your stop-loss would go just above the VWAP. A break above that resistance pretty much invalidates the bearish setup.
This method anchors your risk to a dynamic market benchmark, not some arbitrary dollar amount. It forces you to ask the most important question: "At what point is my trade idea proven wrong?" The VWAP provides the answer.
Defining Realistic Profit Targets
Just as VWAP helps define your risk, it also provides logical areas to take profits. The standard deviation bands are perfect for this, especially when you're playing mean reversion trades.
For example, if you take a long position off a bounce from the lower deviation band, the central VWAP line becomes your first logical profit target. It's a natural magnet for price. The opposing (upper) deviation band is often the second, more aggressive target if the momentum is strong.
Having a structured approach like this stops you from holding on too long out of greed or bailing too early because of fear.
This is a fundamental part of any successful trading plan. If you want to really nail this down, you can master risk management in trading with our essential strategies guide. By setting both your entry and exit rules around the same indicator, you create a cohesive and disciplined process. Your trading becomes less about subjective feelings and more about executing a repeatable, well-defined plan.
Once you get the hang of the basics, you'll find the VWAP can be much more than a simple intraday line. The real pros look beyond the standard daily VWAP to get a much deeper read on market dynamics and what’s really happening under the surface. This is where you can start to build a serious edge.
One of the most powerful tools for this is the Anchored VWAP. Forget the daily reset for a moment. With an Anchored VWAP, you can start the calculation from any specific point on the chart. This completely changes the game, turning it from a static daily metric into a dynamic, event-driven benchmark.
Using Anchored VWAP for Context
Think about a major event that shifted the market's perception of a stock—a blowout earnings report, a big news catalyst, or even just the breakout of a key multi-week high. By anchoring a VWAP to that specific candle, you can now see the average price paid by every trader since that event. It's an incredible way to add context to the current price.
For example, imagine a stock gaps up on killer earnings. If you anchor a VWAP to the market open candle, you're tracking the real-time "fair value" for everyone who jumped in after the news. As long as the price stays above that anchored line, it’s a strong sign that buyers are in firm control and have conviction.
Layering Multiple VWAPs for a Fuller Picture
Another technique I see a lot of seasoned traders use is layering multiple VWAPs on a single chart. This is a fantastic way to understand how different timeframes are interacting. One of the most effective combos? The Daily VWAP and the Weekly VWAP.
- Daily VWAP: This is your short-term guide, showing you intraday sentiment and where value is being established today.
- Weekly VWAP: This gives you the bigger picture, showing the volume-weighted average price for the entire week.
When you see the price trading above the Daily VWAP, and both of those are trading above the Weekly VWAP, that's a powerful signal. It tells you that bullish sentiment is aligned across both short-term and longer-term horizons. On the flip side, when a stock is trading below both, it often points to a confirmed, heavy downtrend.
The real skill comes from watching how these different VWAP levels interact. A bounce off the Daily VWAP that happens right as the price is testing the Weekly VWAP from above can be an extremely high-probability long setup. It shows short-term buyers stepping in at a key long-term area of support.
You'll notice that price action around the VWAP often forecasts potential support and resistance zones. A sustained move above VWAP tends to attract long entries, while a decisive drop below it can bring in the shorts. Throughout the day, prices will often pull back to test the VWAP and its bands, which frequently act as natural price ceilings or floors. You can discover more insights about how to use these indicators from other experts in the field.
Pro Tips for Stronger Confirmation
Here’s a critical piece of advice: never trade off a VWAP line in isolation. To really sharpen your entries and exits, you need to look for other confirming factors.
Combining VWAP with a momentum oscillator like the Relative Strength Index (RSI) is a classic and effective approach. Let's say a stock is in a clear uptrend and pulls back to its VWAP. Before you jump in, glance at the RSI. If it's holding strong above 50, that’s your confirmation that the underlying bullish momentum is intact, giving you much more confidence in the trade.
Finally, always consider the time of day. A rejection or bounce at the VWAP during the high-volume chaos of the market open carries a ton more weight than a similar move during the quiet midday session. Volume is what validates the move and tells you the big players are involved.
Of course. Here is the rewritten section, crafted to sound like it was written by an experienced human expert, following all the provided style and formatting requirements.
Answering Your Top VWAP Questions
As you start working the VWAP strategy into your trading, you're bound to have some questions. It’s totally normal. Getting those questions answered is how you build the confidence to pull the trigger on trades without hesitation. Let's walk through some of the most common things traders ask me about.
Is VWAP Just for Day Trading?
This is probably the first question everyone asks. The short answer is yes, the standard Session VWAP is a day trading tool, through and through. Its calculation starts fresh at the opening bell and ends at the close, so it's not meant for looking at charts over multiple days.
But that's where the Anchored VWAP changes the game. If you're a swing trader or looking at a longer timeframe, you can anchor the VWAP to a specific, significant event. Think of things like:
- A weekly or monthly high/low
- The date of a major earnings announcement
- A Federal Reserve policy change
This gives you a volume-weighted average price starting from that exact point in time, offering a powerful reference line that can remain relevant for days or even weeks.
What's the Best Chart Timeframe for VWAP?
Another frequent point of confusion is picking the right chart timeframe. Honestly, there's no magic bullet here—the "best" one is whichever one syncs up with your trading style.
Scalpers, for instance, live on the 1-minute or even tick charts. They need that high-definition view of the action to snag tiny profits around the VWAP line.
Intraday trend traders, on the other hand, usually get more mileage out of the 5-minute or 15-minute charts. These timeframes do a better job of filtering out the distracting market "noise," which makes it much easier to spot and ride the real, established trends.
The goal is to match the chart's sensitivity to how long you plan on being in a trade. My advice? Fire up a demo account and just play around with them. See which one feels the most intuitive for the way you see the market.
My Two Cents: Don't get hung up on finding the "perfect" timeframe. The real secret is aligning the indicator with your own trading rhythm and goals.
Does VWAP Work for Every Asset?
Finally, let's talk about where VWAP really shines. This indicator is at its most reliable in centralized markets—places where you can get official, aggregated volume data. This makes it an absolute workhorse for assets like stocks and futures.
When you move into decentralized markets like forex or most cryptocurrencies, things get a bit murkier. The volume data can be all over the place depending on which exchange you're looking at. This lack of a single, unified volume source means the standard VWAP just isn't as precise.
While some crypto and forex traders still use it as a general guide for market direction, you have to take its signals with a grain of salt. They simply aren't as dependable as what you’d see in the stock market.
Ready to put these strategies into practice with professional-grade tools? ChartsWatcher gives you the advanced charting, backtesting, and customizable scanning you need to master your VWAP strategy. Explore our platform and start trading smarter today!
