A Trader's Guide on How to Use VWAP
At its core, using VWAP is simple: you’re looking to buy below the VWAP line and sell above it. This strategy frames the VWAP as the day’s true benchmark for fair value, helping you spot potentially undervalued or overvalued conditions in real-time.
What VWAP Really Tells You About the Market
Before you add yet another line to your chart, you need to understand what the VWAP indicator is actually revealing. Forget the complex formula for a second. Just think of it as the market’s center of gravity for that specific trading day.
It’s not just another moving average; it's a volume-weighted average. That distinction is everything.
A simple moving average gives the same importance to a low-volume price tick at noon as it does to a high-volume surge at the opening bell. VWAP, on the other hand, gives more weight to the price levels where the real action happened. This makes it a far more honest picture of where the "big money" is flowing.
The Institutional Benchmark for Fair Value
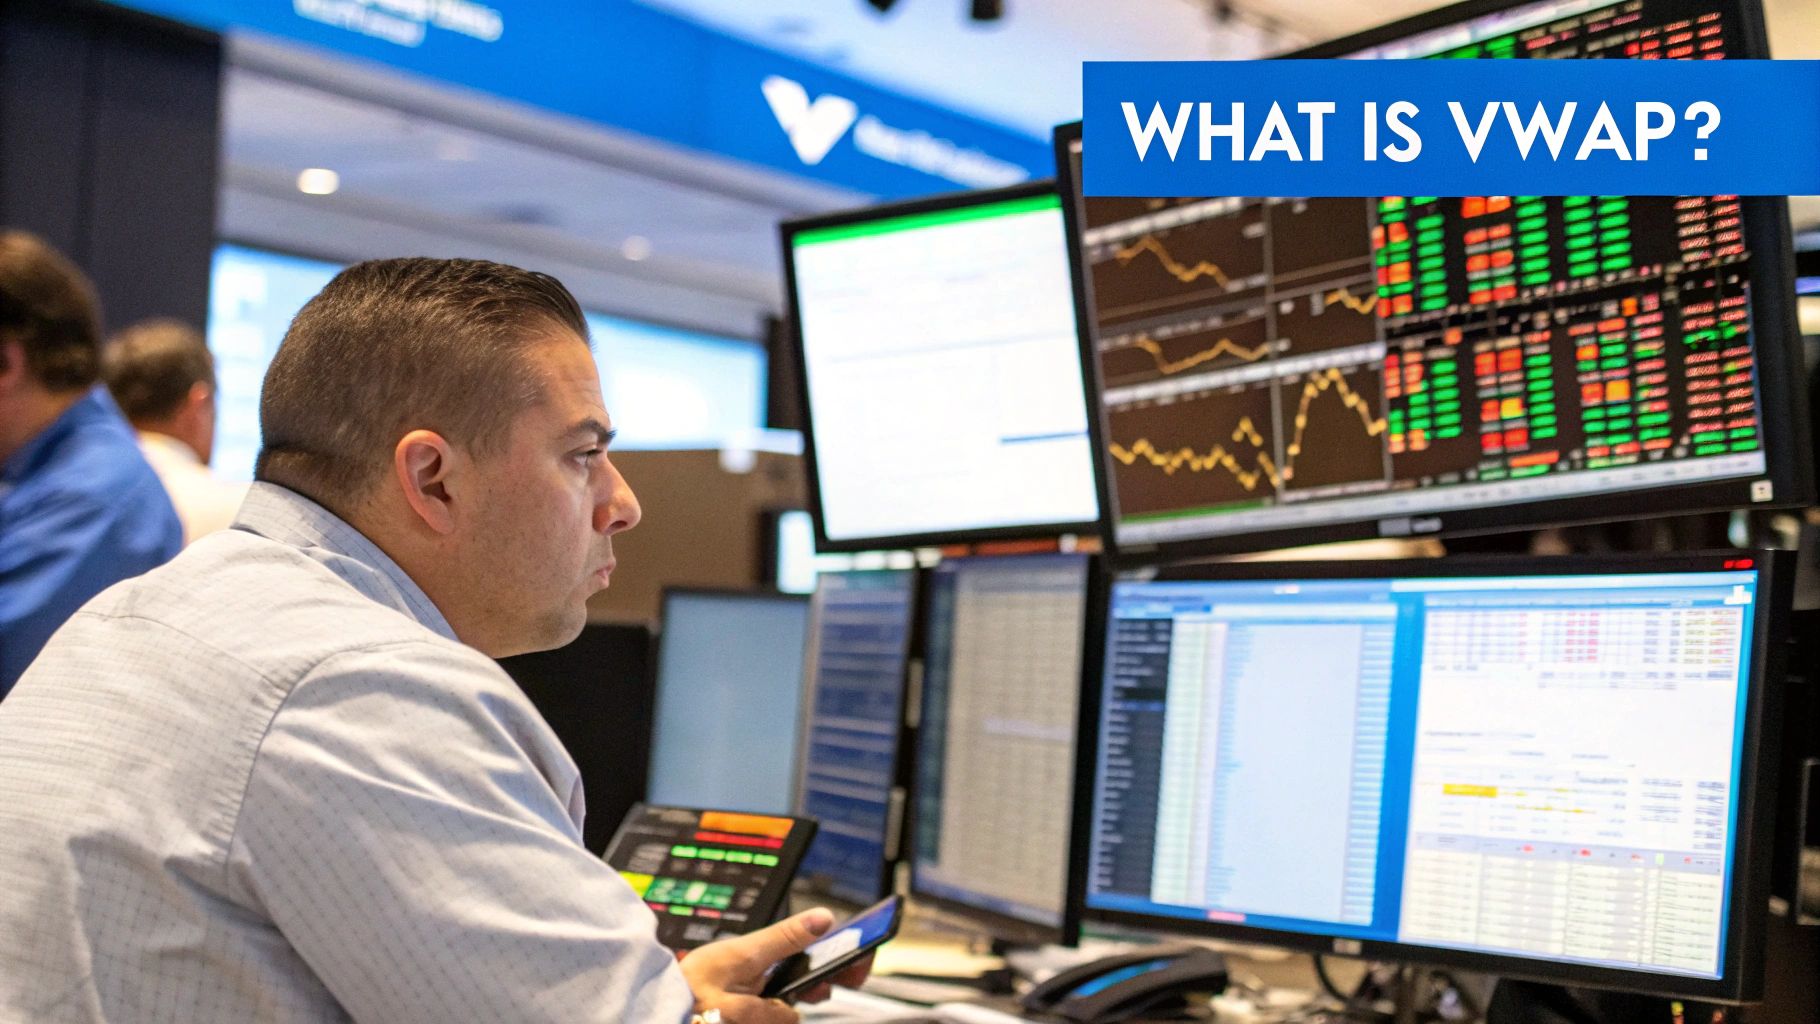
So, why do institutions and professional traders watch this line so closely? Because it’s their main yardstick for measuring how well they did their job. A fund manager who needs to buy millions of shares of a stock wants to avoid causing a massive price spike. Their goal is to get their position filled at or below the day's average price—the VWAP—to prove they executed skillfully.
This creates a powerful self-fulfilling prophecy in the market:
- Buying below VWAP is seen as getting a "good fill" or a bargain.
- Selling above VWAP is considered an excellent exit.
- Executing huge orders near the VWAP helps them fly under the radar and minimize market impact.
This institutional behavior is exactly what creates the support and resistance dynamics you can see on your own charts. When the price pulls back to the VWAP, it often represents a point of balance where both buyers and sellers see the price as fair, creating a natural battleground.
Beyond a Simple Line on a Chart
The Volume Weighted Average Price (VWAP) is a staple in futures and equity markets because it’s calculated in real-time straight from trade data. Representing the average price paid per share throughout the day, weighted by volume, it's a critical tool for both asset managers and large-scale traders. For instance, portfolio managers often use VWAP-based strategies to acquire large blocks of shares at prices below the day's average, aiming to cut down on market impact and slippage. You can explore more about VWAP's value to institutions and see how they apply these strategies in practice.
The real power of VWAP isn't just in identifying trends; it's in understanding the market's consensus on value. When price moves away from VWAP, it's a signal that one side—buyers or sellers—is winning the argument decisively.
Ultimately, VWAP gives you a clear, objective read on the current market sentiment. If the price is consistently holding above the VWAP, it signals strong bullish control, where buyers are happy to pay a premium over the average. On the flip side, a price that can't seem to break above the VWAP points to bearish dominance, where sellers are in charge and buyers are only willing to step in at a discount. Learning how to use VWAP effectively means learning to read this dynamic and aligning your trades with the side that's showing real strength.
Alright, let's get that VWAP indicator set up on your ChartsWatcher workspace. Now that we've covered why VWAP is such a critical tool, it's time for the practical part—getting it on your charts and making it work for you. This isn't just about adding another line; it's about integrating a powerful signal that can reveal where the big money is flowing.
First things first, you need to find the indicator. Head over to your indicator library, which you’ll usually see as an "Indicators" or "Studies" button on your main chart toolbar. Type "VWAP" into the search bar, and you'll see the Volume Weighted Average Price pop up. Give it a click, and it will instantly overlay on your chart, ready to be customized.
Customizing Your VWAP for Clarity
The default settings are fine, but where the real magic happens is in tailoring the VWAP to fit your specific trading style. The single most important setting to get right is the anchor period. This is the starting point for the calculation, determining when it resets.
Here are the anchor periods you’ll use most often:
- Session/Daily: This is the go-to for day traders. The VWAP calculation starts at the opening bell and resets at the start of the next trading day. It gives you a clean benchmark for every single session.
- Weekly: Want to zoom out a bit? The weekly anchor smooths out the daily chatter and shows you the volume-weighted average price across the entire week. It’s fantastic for spotting broader support and resistance levels that carry more weight than just a single day's action.
- Monthly: For swing traders or anyone looking at the bigger picture, the monthly VWAP gives a bird's-eye view. It helps you understand institutional positioning over a much longer timeframe.
Your choice of anchor period comes down to your strategy. If you're an intraday scalper, the Session VWAP is your world. But a swing trader might overlay a weekly VWAP on their daily chart to make sure they're trading in sync with the larger trend.
Adding Standard Deviation Bands for Edge
Just plotting the VWAP line itself is a great start, but it's only half the story. To really get a feel for how price is behaving around this average, you need to add standard deviation bands. Think of these as channels above and below the main VWAP line that show you when the price might be getting overextended or "stretched."
At its core, VWAP is a simple concept: price is weighted by its volume. The infographic below shows how this works in practice.
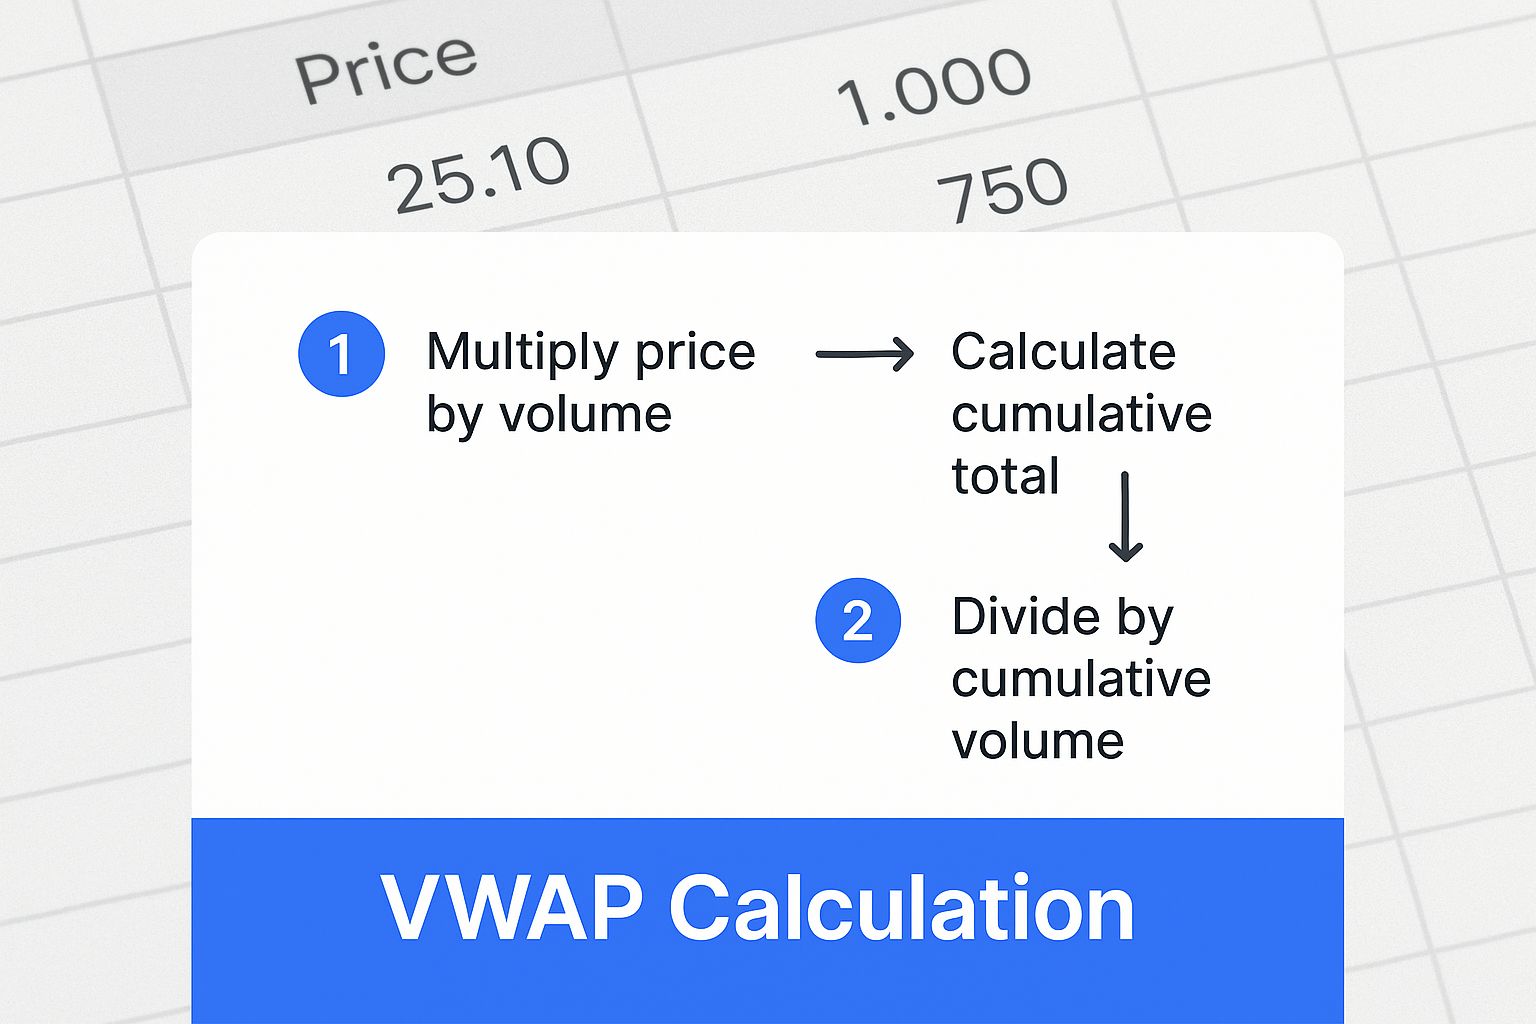
As you can see, price levels with massive volume have a much bigger pull on the VWAP line than those with thin, weak volume.
When you add deviation bands in ChartsWatcher, you can set "multipliers"—typically 1, 2, or 3 standard deviations away from the main line. A very common and effective setup is using the 1st and 2nd deviation bands. When price pushes out to these outer bands, it's often a sign of exhaustion. This gives you a clear visual cue that the market might be overbought or oversold and due for a pullback or some consolidation.
Think of the VWAP as a rubber band. The standard deviation bands show you how far that band is being stretched. The further it stretches, the higher the probability it will snap back toward the middle.
Finally, don't skimp on the aesthetics. A clean, readable chart is crucial for making quick decisions. Make your main VWAP line a bold, high-contrast color like bright yellow or white, then use thinner, more muted colors for the deviation bands. Your goal when learning how to use VWAP isn't to create a rainbow of confusing lines; it's to make the most important data jump right off the screen.
Reading VWAP Signals for Clearer Trading Decisions
Alright, you’ve got the VWAP indicator and its standard deviation bands loaded up on your ChartsWatcher workspace. Now, the real work begins: learning to read the story the market is telling you. This isn't about memorizing rigid rules. It's about developing a feel for the constant conversation between a stock's price and its volume-weighted value.
Think of the VWAP line as the day's financial "line in the sand." The relationship between the current price and this line gives you a powerful, at-a-glance read on market sentiment. When you see the price holding strong above the VWAP, it’s a clear sign that buyers are in the driver's seat, willing to pay more than the day's average price.
On the flip side, if the price keeps getting smacked down every time it tries to rally to the VWAP, or if it's just grinding away below it, that screams bearish pressure. This tells you sellers are in control, and buyers are only stepping in when they can get a discount compared to the day's fair value.
Interpreting Bullish and Bearish Scenarios
Figuring out the bullish or bearish context is the absolute foundation of trading with VWAP. You're trying to understand the market's current narrative before you even think about putting on a trade. A price that respects the VWAP tells a completely different story than one that slices through it without a second thought.
A classic bullish setup I look for is a strong break above the VWAP on good volume, followed by a gentle pullback to test that same line. If the price bounces off the VWAP and continues its climb, it's a huge confirmation that big-money buyers see that level as a value area. This is often where institutions will add to their positions.
A bearish scenario is the mirror image. The price might tumble below the VWAP and then try to rally back up to it. If it gets rejected at the VWAP line and rolls over, that’s a signal that sellers are aggressively defending that level as the new ceiling for "fair value."
The VWAP line is much more than a simple average; it's a dynamic zone of equilibrium. How the price behaves as it nears this zone—whether it bounces off respectfully or crashes right through—is one of the most critical pieces of information for any day trader.
This dynamic nature is exactly why so many strategies, from trend-following to mean-reversion, can be built around VWAP. It’s incredibly versatile. A common professional practice is to judge trade execution quality against it. For instance, if you're buying, getting your order filled below the VWAP is considered a good fill because you paid less than the volume-weighted average for that session.
The Role of Standard Deviation Bands
Those standard deviation bands you added? They are your secret weapon for spotting when a move is getting overextended and a reversal might be on the horizon. They create a channel around the main VWAP line, effectively flagging conditions that are likely unsustainable.
When you see the price push all the way out to the second or even third standard deviation band, picture a rubber band being stretched to its breaking point. While it's not a foolproof guarantee of a reversal, it dramatically increases the odds of a pullback toward the mean—which is the VWAP line itself.
- Price at Upper Bands: This signals a potentially overbought market. Aggressive traders might start looking for signs of exhaustion to enter a short, while more conservative traders could see it as a perfect time to take profits on their long positions.
- Price at Lower Bands: This points to a potentially oversold condition. For mean-reversion traders, this is a flashing light, presenting a potential buying opportunity as they anticipate a snap-back rally toward the VWAP.
Mastering this interplay between the price, the VWAP line, and its bands is a huge step in your trading journey. To build on this, be sure to check out our guide on how to analyze stock charts with proven techniques for success.
VWAP Price Action Interpretation Guide
To help you translate these visual cues into actionable decisions on the fly, I’ve put together this quick-reference table. It’s a cheat sheet for interpreting the relationship between price and the VWAP line to help you make faster, more confident decisions.
| Price Location vs. VWAP | Potential Market Sentiment | Primary Trader Action |
|---|---|---|
| Consistently Above VWAP | Bullish Consensus | Look for buying opportunities on dips toward the VWAP line. |
| Consistently Below VWAP | Bearish Control | Consider shorting on rallies that fail at the VWAP line. |
| Touching Upper Deviation Band | Overbought / Exhaustion | Take profits on longs; consider mean-reversion shorts. |
| Touching Lower Deviation Band | Oversold / Capitulation | Take profits on shorts; look for potential long entries. |
| Chopping Around VWAP | Neutral / Consolidation | Wait for a decisive breakout with volume before entering. |
By weaving these visual cues together, you're no longer just looking at a line on a chart. You're using a powerful framework to help you stay on the right side of institutional order flow and to define objective levels for your entries, exits, and risk management.
Actionable VWAP Trading Strategies for Day Traders
Knowing what VWAP is telling you is one thing. Actually turning those signals into profitable trades? That’s a whole different ball game. This is where we bridge the gap between theory and the trading desk, building a playbook of concrete strategies you can use in the heat of the moment.
A real strategy isn't some vague idea. It’s a precise plan with clear entry triggers, logical stop-loss placements, and well-defined profit targets. We’re about to break down two powerful, battle-tested VWAP strategies that should be in every day trader's toolkit. These aren't just abstract concepts; they are frameworks built on the institutional order flow and market sentiment that VWAP reveals so well.
The VWAP Mean Reversion Strategy
First up is a strategy built on patience and precision: VWAP Mean Reversion.
The idea here is simple. Think of the price like a rubber band stretched away from its "fair value" (the VWAP). At some point, it's likely to snap back. This is a favorite for traders who prefer to buy the dips in an uptrend or short the rips in a downtrend, rather than chasing wild breakouts.
The setup is pretty straightforward. First, you need a clear, prevailing trend for the day. Let's say a stock is in a solid uptrend, consistently staying above its VWAP. You're now on the hunt for a buying opportunity. But you’re not buying the top—you’re waiting for the price to pull back and test the VWAP line from above.
The core principle is this: In a strong trend, the VWAP line often acts as a dynamic support level. The institutions that fueled the uptrend see this pullback as a chance to add to their positions at a "fair" price, which provides the buying pressure needed for a bounce.
Your entry trigger isn't just the price touching the VWAP. It's the price hitting that level and then showing signs of life—like a bullish candlestick pattern or a sudden pop in buying volume. That’s your confirmation that buyers are, in fact, stepping in to defend the area.
Risk management is everything with this approach.
- Entry: Go long as the price bounces off the VWAP line within a confirmed uptrend.
- Stop-Loss: Your stop should be placed just below the VWAP and a recent swing low. This gives the trade room to work but protects you if support fails decisively.
- Profit Target: A good initial target is the previous high of the day. The upper standard deviation band is another logical spot where sellers might reappear.
This strategy demands patience. You might watch a stock run for an hour before it finally gives you the pullback you're waiting for. Resisting FOMO and waiting for the price to come to your level is what separates professional execution from amateur mistakes.
The VWAP Breakout Strategy
While mean reversion is about fading moves back to the average, the VWAP Breakout strategy is all about joining the party. This is a momentum play, designed to catch powerful, directional moves as a stock breaks decisively away from its VWAP, signaling a new, aggressive phase in the trend. It's perfect for traders who thrive on speed and conviction.
This setup often happens after a period of consolidation, where the price has been chopping back and forth around the VWAP line. For a while, buyers and sellers are deadlocked. The breakout occurs when one side finally overpowers the other, usually confirmed by a massive spike in volume.
Here's a classic bullish breakout scenario: A stock goes sideways around the VWAP for 20-30 minutes. Then, it suddenly punches above it on volume that's two to three times the recent average. That burst of volume is your green light—it signals the move has institutional fuel behind it. You aren't just buying a price move; you're buying a volume-backed shift in control.
Your execution plan would look something like this:
- Entry: Enter a long position as the price smashes through the consolidation range and the VWAP, confirmed by that big volume spike.
- Stop-Loss: Place your stop on the other side of the VWAP, just below the recent consolidation area. If the price falls back below VWAP, the breakout has failed, and it's time to get out.
- Profit Target: Momentum moves can run much further than you think. A common tactic is to take partial profits at the first standard deviation band and then trail your stop on the rest to ride a bigger move.
These two strategies provide a solid foundation, but the real skill comes from blending them with other forms of analysis. To see how pros structure their entire trading plan, check out our complete guide on building a VWAP trading strategy with expert techniques for profit.
By having both a mean reversion and a breakout strategy in your arsenal, you're prepared to act decisively no matter what the market is doing. Whether it's trending smoothly or coiling up for an explosive move, you'll have a clear VWAP-based plan ready to go.
Alright, let's move beyond the basics. Once you have a handle on the standard daily VWAP, it's time to layer in some more advanced techniques. This is how you start to see the market through a professional lens, distinguishing between short-term noise and the much bigger institutional currents.
A powerful method is to plot multiple VWAP periods on the same chart. Your daily (or session) VWAP is absolutely critical for understanding intraday flow, but adding weekly and monthly VWAPs gives you a much deeper sense of context. Think of it as gaining different levels of altitude—each one reveals a new layer of the market landscape.
For example, a stock might be grinding higher above its daily VWAP, looking like a solid long for the session. But if you see it's rapidly approaching a major monthly VWAP level from below, that's a huge red flag. You're heading straight into a wall of potential resistance where long-term players might be looking to sell or even initiate shorts.
The Power of Multiple VWAP Layers
Using multiple VWAPs is all about mapping out the market's different battlegrounds. Each timeframe tells you something unique about who is in control.
- Daily VWAP: This is your compass for the current session. It shows you the "fair value" for the day and helps define intraday trends.
- Weekly VWAP: A key level for swing traders. It represents the volume-weighted average for the entire week and often acts as a powerful magnet for price, pulling it back to the mean.
- Monthly VWAP: This is the big one—the long-term institutional benchmark. A decisive break above or below this level can signal a major shift in market sentiment that could last for weeks, if not months.
When you see these different VWAP levels converging at a single price point, pay close attention. You've just identified a zone of massive significance. Price action around these confluence areas is often explosive and can kick off the market's next major directional move.
Identifying the VWAP Pinch
One of the most potent patterns you can spot with multiple VWAPs is the VWAP pinch. This happens when the price gets tightly coiled between two key VWAP levels—imagine a stock getting squeezed between a rising weekly VWAP from below and a declining daily VWAP from above.
This "pinch" creates a state of high-tension consolidation. It's a visual representation of a fierce battle between buyers and sellers, with neither side able to gain the upper hand. The longer the price stays coiled in that tight range, the more kinetic energy it builds. A breakout from a VWAP pinch, especially on a surge of volume, is often the starting pistol for a powerful and sustained trend.
A VWAP pinch is the market's equivalent of a coiled spring. It's a clear signal that a significant directional move is coming. Your job is to be ready to pounce when it finally breaks.
VWAP vs. TWAP: When to Use Each
As you get more sophisticated in your analysis, you'll run into other execution benchmarks, most notably the TWAP (Time-Weighted Average Price). While both VWAP and TWAP are used to gauge execution quality, they serve different masters depending on market conditions. Knowing the difference is a crucial part of refining your strategy.
The choice often boils down to liquidity and your specific goals. VWAP shines in highly liquid assets during peak trading hours, as it's designed to align with the market's natural volume flow. But what about during low-volume periods, like over the weekend or in the pre-market? That's where VWAP can become less reliable. With less volume to anchor it, the data can be sparse, making TWAP a more sensible choice. For a closer look at how these benchmarks stack up in various scenarios, you can check out this deep dive on VWAP and TWAP for trade execution.
Here’s a simple breakdown of the core differences:
| Feature | VWAP (Volume-Weighted Average Price) | TWAP (Time-Weighted Average Price) |
|---|---|---|
| Calculation | Based on price and volume. | Based on price and time. |
| Best Use Case | High-volume, liquid markets (e.g., market open). | Low-volume, illiquid markets (e.g., after-hours). |
| Strategy Goal | To participate with market volume and minimize impact. | To spread an order evenly over a specific period. |
Ultimately, knowing how to use VWAP isn't just about plotting a line on a chart. It's about understanding its strengths and, just as importantly, its limitations. By layering multiple timeframes and learning to spot high-probability patterns like the pinch, you build a far more nuanced and powerful view of what the market is really doing.
Got Questions About Trading With VWAP?
As you start weaving this powerful indicator into your trading, a few questions always seem to come up. It's a natural part of the learning curve. Getting past these initial hurdles is key to building the confidence you need to use VWAP effectively.
Let's clear the air and tackle some of the most common sticking points. My goal here is to give you direct, no-nonsense answers from experience so you can get back to focusing on your strategy.
Does VWAP Work in Pre-Market or After-Hours?
This is a big one, and the answer isn't a simple yes or no. Technically, you can plot a VWAP during extended hours, but its reliability takes a nosedive. The whole point of VWAP is that it's weighted by significant volume, and that's exactly what's missing in pre-market and after-hours trading.
During these low-liquidity sessions, just one or two decent-sized orders can throw the VWAP way off, turning it into a completely misleading benchmark. My advice? Always start your VWAP analysis when the market officially opens and the real institutional volume starts pouring in.
Think of it this way: VWAP is a story told by the crowd. In pre-market, you've only got a handful of people whispering. To get the real narrative, you need to wait for the whole stadium to fill up after the opening bell.
Can I Use VWAP for Swing Trading?
Absolutely, but with a twist. The standard daily VWAP isn't your tool for this job. For swing trading—holding positions over several days or weeks—the daily VWAP is just too short-term. It resets every single morning, wiping out the very context you, as a swing trader, need to see.
The solution is to use an anchored VWAP or plot longer-term VWAPs. By anchoring a VWAP to a significant event on the chart—like a major earnings release, a key swing low, or even the first day of the month—you create a meaningful benchmark that tracks institutional positioning over a longer timeframe. Many swing traders I know find the weekly and monthly VWAP settings to be indispensable.
What if the Price Is Just Chopping Around VWAP?
When you see the price weaving back and forth across the VWAP line with no real conviction, it's screaming one thing: market indecision. This choppy, sideways action means buyers and sellers are stuck in a stalemate. Neither side has the upper hand.
This is a massive signal to be patient. Trying to force a trade in a directionless, choppy market is one of the quickest ways to get chewed up by commissions and small, frustrating losses.
- For Mean-Reversion Traders: This is your cue to sit on your hands. There's no clear "mean" for the price to revert to.
- For Breakout Traders: This is a time to watch intently. That coiling price action might be building up energy for a big move, but you have to wait for a high-volume breakout to confirm it.
Why Did the Price Blow Right Through VWAP Without Even Pausing?
VWAP is a powerful reference point, but it's not a brick wall. If you see the price slice cleanly through the VWAP line like it's not even there, it's almost always because of overwhelming momentum, usually sparked by a major news event or a massive shift in the broader market.
When this happens, don't think the indicator failed. It's actually giving you a very powerful message. The current buying or selling pressure is so intense that it's completely steamrolling the day's established "fair value" level. In these moments, trend-following strategies will serve you far better than trying to fight the freight train.
Ready to put these insights into practice with professional-grade tools? ChartsWatcher gives you the advanced charting and analysis features you need to truly master VWAP. You can customize multiple VWAP periods, set precise alerts, and build a trading screen that delivers a decisive edge. Explore ChartsWatcher today and start trading with more clarity and confidence.
