Master Your Heikin Ashi Strategy: From Setup to Profit
Why Heikin Ashi Charts Change Everything
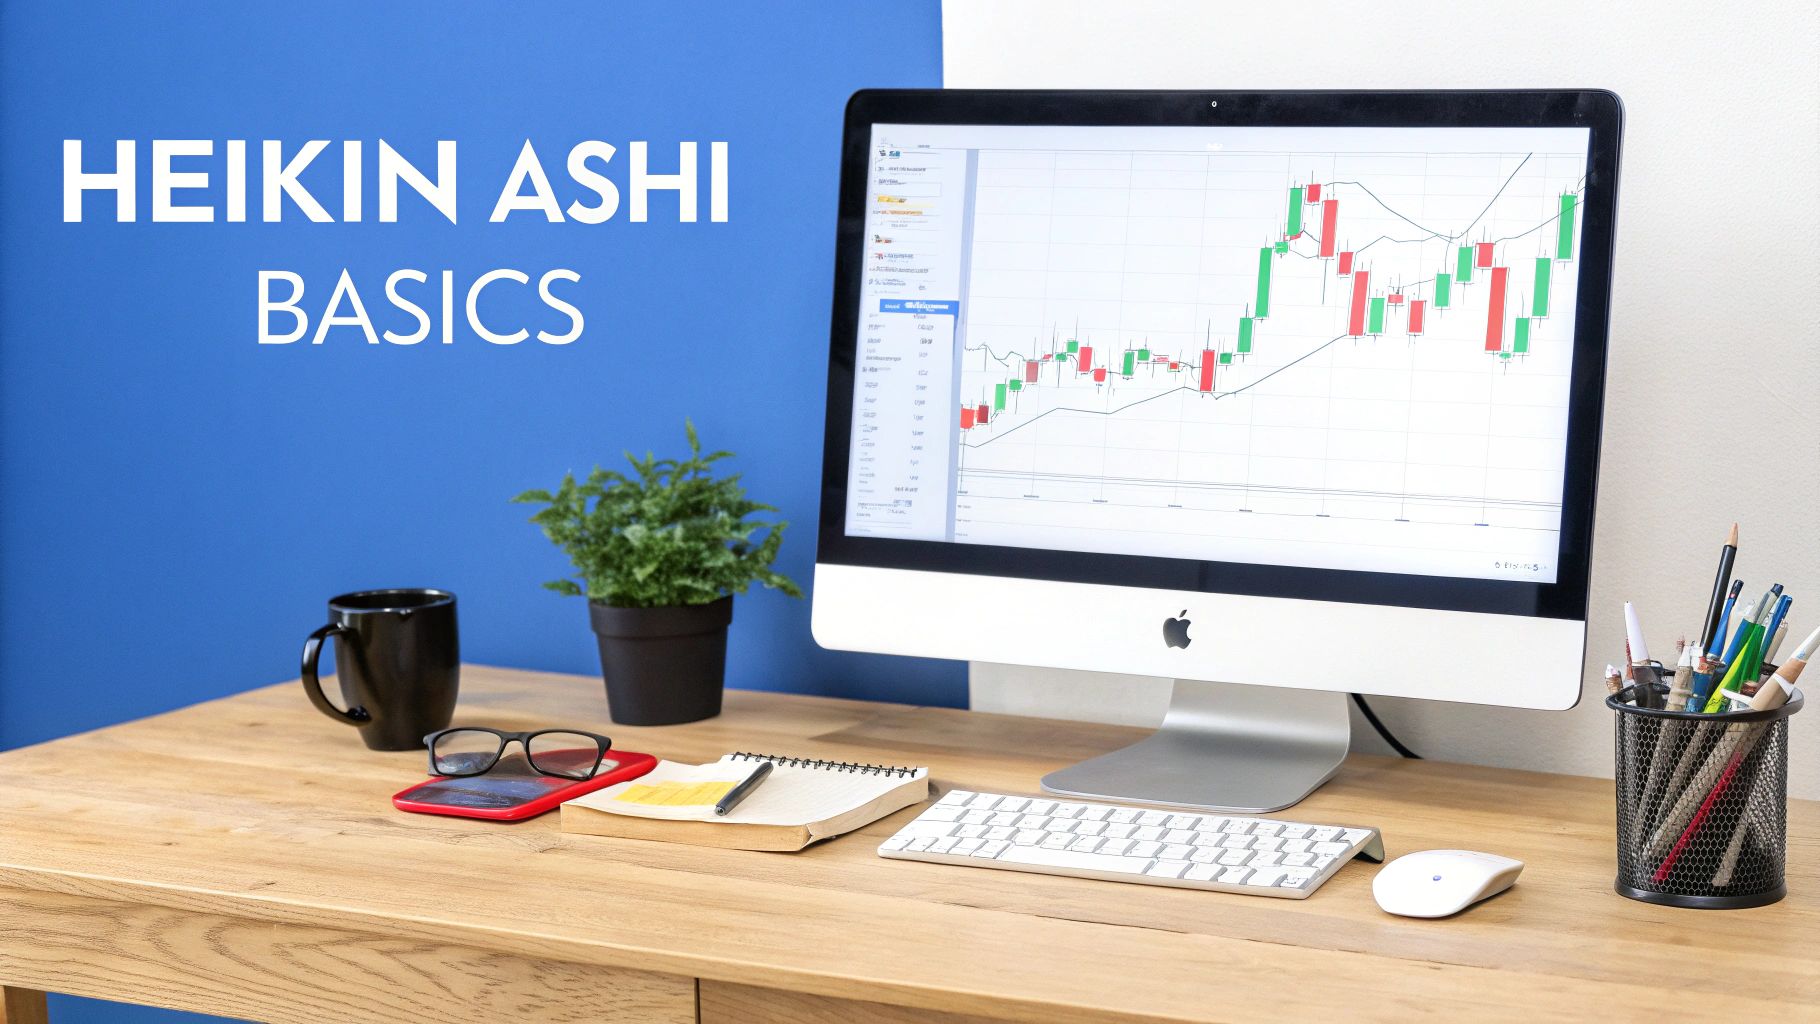
Most traders treat Heikin Ashi charts like just another indicator to clutter their screen. This perspective completely misses the point. Heikin Ashi isn't an overlay; it's a fundamental shift in how you perceive market movement. While other traders react to every minor price tick and get shaken out by noise, a Heikin Ashi strategy lets you read the underlying story of the trend. Think of it like putting on noise-canceling headphones in a chaotic room—suddenly, you can hear what really matters.
The magic is in the math. Traditional candlesticks show raw, unfiltered price data for a period. A Heikin Ashi candle, however, is calculated using an average of the current bar's data and the previous bar's data. This simple tweak has a profound impact: it smooths out the price action, filtering the insignificant volatility that leads to indecision and false signals. This smoothing effect gives you a huge advantage in distinguishing a real trend from a fleeting, news-driven fakeout.
The Psychological Edge of Clarity
This visual clarity gives you a direct psychological advantage. Trading is an emotional game, and the choppy nature of standard candles can whip up a storm of fear and greed. A chart filled with alternating red and green candles can make even a strong trend feel uncertain, tempting you to exit a winning trade too early or jump into a losing one too late.
Heikin Ashi charts, with their long, solid-colored strings of candles, provide consistent reinforcement. In a strong uptrend, you’ll see a series of green candles with no lower wicks. In a downtrend, you'll see a series of red candles with no upper wicks. This visual consistency helps dial down the emotional stress of trading, making it easier to stick to your plan and let profits run. A detailed analysis covering 360 years of price data across major stocks found that strategies using Heikin Ashi charts beat a simple Buy and Hold approach in about 60% of the scenarios. You can explore more of the Heikin Ashi technique's historical performance and dive into the findings.
Heikin Ashi vs. Traditional Candlesticks: The Real Impact
To really get the practical difference, let's put these two chart types side-by-side in real trading situations. The contrast isn't just cosmetic; it directly affects your entries, exits, and ultimately, your bottom line.
Heikin Ashi vs Traditional Candlesticks: Real Trading Impact
Side-by-side comparison showing exactly how Heikin Ashi charts perform differently from regular candlesticks in actual trading scenarios
| Trading Aspect | Heikin Ashi Performance | Traditional Candlesticks | Practical Difference |
|---|---|---|---|
| Trend Identification | Clear, consecutive colored candles highlight the dominant trend direction. | Frequent color changes and gaps can obscure the underlying trend. | It's much easier to stay in a trend and avoid exiting prematurely on minor pullbacks. |
| Entry Signals | A clean change in candle color after a sustained trend signals a potential reversal. | Patterns like engulfing candles or dojis are needed, often hidden in market noise. | Signals are typically cleaner and less ambiguous, which reduces decision fatigue. |
| Emotional Impact | Smoother price action promotes a sense of calm and discipline. | Choppy, erratic price action can cause anxiety, leading to impulsive decisions. | A trader using Heikin Ashi is far less likely to get "whipsawed" by market noise. |
| Price Representation | Shows an averaged price; it does not reflect the exact market price. | Displays the exact open, high, low, and close prices for the period. | Critical: You must use standard charts for execution, as Heikin Ashi prices are not tradable. |
The takeaway here is that Heikin Ashi doesn't show you a "better" price, but it tells you a clearer story about the price's direction.
Ultimately, adopting a Heikin Ashi strategy is about making a conscious switch from reacting to market noise to responding to confirmed market trends. It’s a change that can bring much-needed clarity and discipline to your entire trading process.
Building Your Heikin Ashi Trading Workspace
A powerful Heikin Ashi strategy deserves a workspace to match. It’s a common pitfall for traders to get excited about a new method and jump right in, only to find themselves frustrated by a clunky or inefficient setup. Creating your trading station is more than just aesthetics; it's about building a command center that helps you think clearly and act decisively. Before you even consider placing a trade, let's get your setup dialed in.
The single most important piece of the puzzle is your charting platform. Not all software treats Heikin Ashi charts the same way. Some merely offer them as a visual overlay, but serious platforms like ChartsWatcher provide the deeper functionality you need for real analysis. You need a tool that not only displays the candles correctly but also lets you build indicators and alerts from their unique calculated values—not just the standard market prices. This is a critical distinction because Heikin Ashi prices are averaged; trading from a platform that can't tell the difference is a surefire way to get confusing signals.
Configuring Your Charts for Maximum Clarity
With the right platform in hand, the next job is organizing your visual real estate. A frequent mistake is to overload a single chart with too many indicators. When using Heikin Ashi, less is definitely more. The smoothed candles are already doing a great job filtering out market noise, so your goal is to add tools that confirm momentum and volume without creating clutter.
A classic professional setup involves pairing a primary Heikin Ashi chart with a momentum indicator like the Relative Strength Index (RSI) or a Stochastic Oscillator. These help you measure the strength behind a Heikin Ashi trend. For instance, a strong series of green Heikin Ashi candles becomes much more convincing when the RSI is climbing and holding above 50. To add another layer of confirmation, a volume-based indicator like On-Balance Volume (OBV) can show you if big money is backing the move.
The Power of Multi-Timeframe Analysis
Focusing on just one timeframe is like trying to drive through a city by only looking at the street right in front of you—you're going to miss the big picture. Any solid Heikin Ashi workspace should incorporate multi-timeframe analysis. Here’s a practical way to lay it out:
- The Strategic Chart (e.g., Daily): This is your high-level map. Use this Heikin Ashi chart to spot the dominant, long-term trend. Is the market generally bullish or bearish?
- The Setup Chart (e.g., 4-Hour): This is where you look for high-probability entry zones. You’re hunting for pullbacks or consolidation periods within the larger trend identified on the daily chart.
- The Execution Chart (e.g., 15-Minute): This is where you pinpoint your entry. You wait for the Heikin Ashi candles on this short-term chart to align with the higher timeframes, signaling the pullback is likely over and the main trend is ready to resume.
This structured approach keeps you from fighting the primary trend and dramatically boosts the quality of your trade signals. To make this work smoothly, your platform must let you easily sync different chart windows to the same instrument.
To get a better sense of how this looks in practice, check out this video breakdown of a multi-timeframe setup:
Your choice of software will either be a major asset or a significant roadblock. Before committing to a platform, it's worth understanding which features truly matter for a Heikin Ashi strategy. The table below breaks down the must-haves versus the nice-to-haves.
Essential Platform Features for Heikin Ashi Success
| Platform Feature | Why It Matters | Impact on Performance | Workaround Options |
|---|---|---|---|
| HA-Based Alerts | Lets you set alerts on Heikin Ashi values (e.g., color change, no lower wick), not standard prices. | High: Automates opportunity spotting so you don't have to watch the screen constantly. | Manual monitoring, which is mentally exhausting and often leads to missed trades or late entries. |
| Robust Backtesting Engine | Must be able to test strategies using Heikin Ashi logic, not just standard OHLC bars. | High: Crucial for validating your strategy's statistical edge and building confidence before risking real money. | Manual backtesting, which is incredibly slow, tedious, and highly prone to human error and biases. |
| Advanced Chart Syncing | Instantly updates all chart windows (e.g., daily, 4-hour, 15-min) to the same financial instrument. | High: Speeds up multi-timeframe analysis immensely and prevents costly mistakes from analyzing the wrong chart. | Manually changing the ticker on each chart, which is inefficient and a common source of execution errors. |
| Custom Indicator Support | Ability to build or import indicators that reference Heikin Ashi data points directly. | Medium: Allows for a more personalized strategy tailored to your specific entry and exit rules. | Sticking to standard indicators that may not align perfectly with the smoothed Heikin Ashi data. |
Ultimately, the goal is to build an environment where your Heikin Ashi strategy can perform at its best. By ensuring your platform has these core capabilities, you're setting yourself up for a much smoother and more methodical trading journey.
Creating Your Core Heikin Ashi Trading System
Alright, let's get into the heart of it. We're moving past just looking at charts and are now ready to build the engine that will drive your trading. A real Heikin Ashi strategy isn't about simply reacting to a string of green or red candles; it's a complete system with strict rules for when you get in, when you get out, and how you manage your money. Vague advice like "just follow the trend" is pretty useless without a specific, repeatable process. This is where we build that process from scratch.
The foundation of any solid Heikin Ashi system is finding high-probability patterns. It's important to remember that Heikin Ashi charts behave differently from standard candlesticks because they are built on averaged price data, not the raw market open, high, low, and close. This smoothing effect is what filters out market noise, but it also changes how a strategy performs by adjusting signal timing. You can get a better sense of this by reading these insights on running a strategy on Heikin Ashi charts.
Defining Your Entry Criteria
Your entry rules are the first make-or-break component. A strong Heikin Ashi entry isn’t triggered by a simple color change but by a confluence of events that point to a genuine shift in market momentum. Jumping in on the very first green candle after a sea of red can often be a bull trap, so we need confirmation.
A powerful entry signal often combines a Heikin Ashi pattern with a momentum indicator. For instance, a high-probability long entry could look like this:
- The Reversal Candle: The market has been in a clear downtrend (a series of red candles). You spot the first green Heikin Ashi candle. This is your cue to pay attention, not your signal to act.
- The Confirmation Candle: You wait for a second consecutive green candle to close. Ideally, this candle should be larger than the first and show no lower wick, which signals strong buying pressure.
- Momentum Confirmation: Simultaneously, an indicator like the Relative Strength Index (RSI) should cross above its midpoint (e.g., 50). This validates that underlying momentum is truly shifting from bearish to bullish.
This layered approach helps filter out a ton of false signals. You're no longer just chasing colors; you're trading a confirmed change in the market's behavior. The goal is to get into a move early, but not so early that you get shaken out.
Crafting Your Exit Rules and Position Sizing
Getting into a trade is only half the job. Knowing when to get out is what protects your capital and secures your profits. Your Heikin Ashi exit rules need to be just as systematic as your entries. A common mistake is to panic and exit at the first sign of an opposing-color candle.
Here’s a more structured way to manage your exits:
- Profit-Taking Exit: Your main exit signal should be when the trend shows signs of running out of steam. For a long trade, this might be the first solid red candle after a long run of green ones. It could also be when you see green candles getting progressively smaller with long upper wicks, which indicates indecision.
- Protective Stop-Loss: Because Heikin Ashi smooths price, placing your stop-loss requires a bit of breathing room. A solid technique is to place it below the low of the previous swing. Avoid putting it just below your entry candle, as normal market chop can easily stop you out.
- Position Sizing: Your position size shouldn't be static. Consider risking less on a new, unproven trend and more when you're joining an established trend on a pullback. For example, you might risk 2% of your capital on a trade that aligns with a major, confirmed trend, but only risk 0.5% on a riskier counter-trend setup.
As you define these rules, it's also worth thinking about how new tools could shape trading in the future. Understanding AI's role in financial services shows that the principles of systematic trading you're building today will provide the foundation for adding more advanced analytics down the line. A well-defined system is always relevant.
Advanced Trade Selection That Actually Works
Simply reacting to Heikin Ashi color changes is a rookie move. To really improve your Heikin Ashi strategy, you need to start thinking like a professional trader. This means using filters to get rid of the low-quality setups and focus only on the best opportunities. Basic signals are just the starting point; the real money is made when you selectively choose trades that have the highest probability of success.
The most effective filter you can add to your trading is multi-timeframe analysis. A strong uptrend on a 15-minute chart doesn't mean much if the daily and 4-hour charts are signaling a major downturn. Trading without that bigger picture is like trying to cross the ocean in a rowboat with no map—you're going to get tossed around. A solid approach is to use a higher timeframe (like the daily) to figure out the main trend, a medium one (like the 4-hour) to spot pullbacks, and a lower one (like the 1-hour) to nail your exact entry when the trend looks ready to continue.
Stacking the Odds with Confluence
Once you've identified the trend direction on a higher timeframe, your next job is to hunt for confirmation from other sources. A Heikin Ashi signal becomes much more reliable when it lines up with other technical factors. Traders call this confluence, and it's your best defense against getting faked out by false signals.
Here are a few high-impact filters you can start using right away:
- Volume Analysis: A change in the Heikin Ashi trend that comes with a big spike in volume is far more believable than one with weak volume. High volume often means that large institutions are getting involved, which adds serious credibility to the move.
- Market Structure: Always pay attention to key support and resistance levels. A bullish Heikin Ashi reversal pattern that forms right at a major historical support level is a much stronger signal than one that just appears in the middle of nowhere.
- Momentum Confirmation: Don't just trust the candles. Use an indicator like the Relative Strength Index (RSI) to back up your trade. For a long trade, wait for the RSI to cross above 50 (or below 50 for a short) to confirm that momentum is actually shifting in your favor.
The infographic below shows a simple but powerful process for combining these elements to find a solid trading setup.
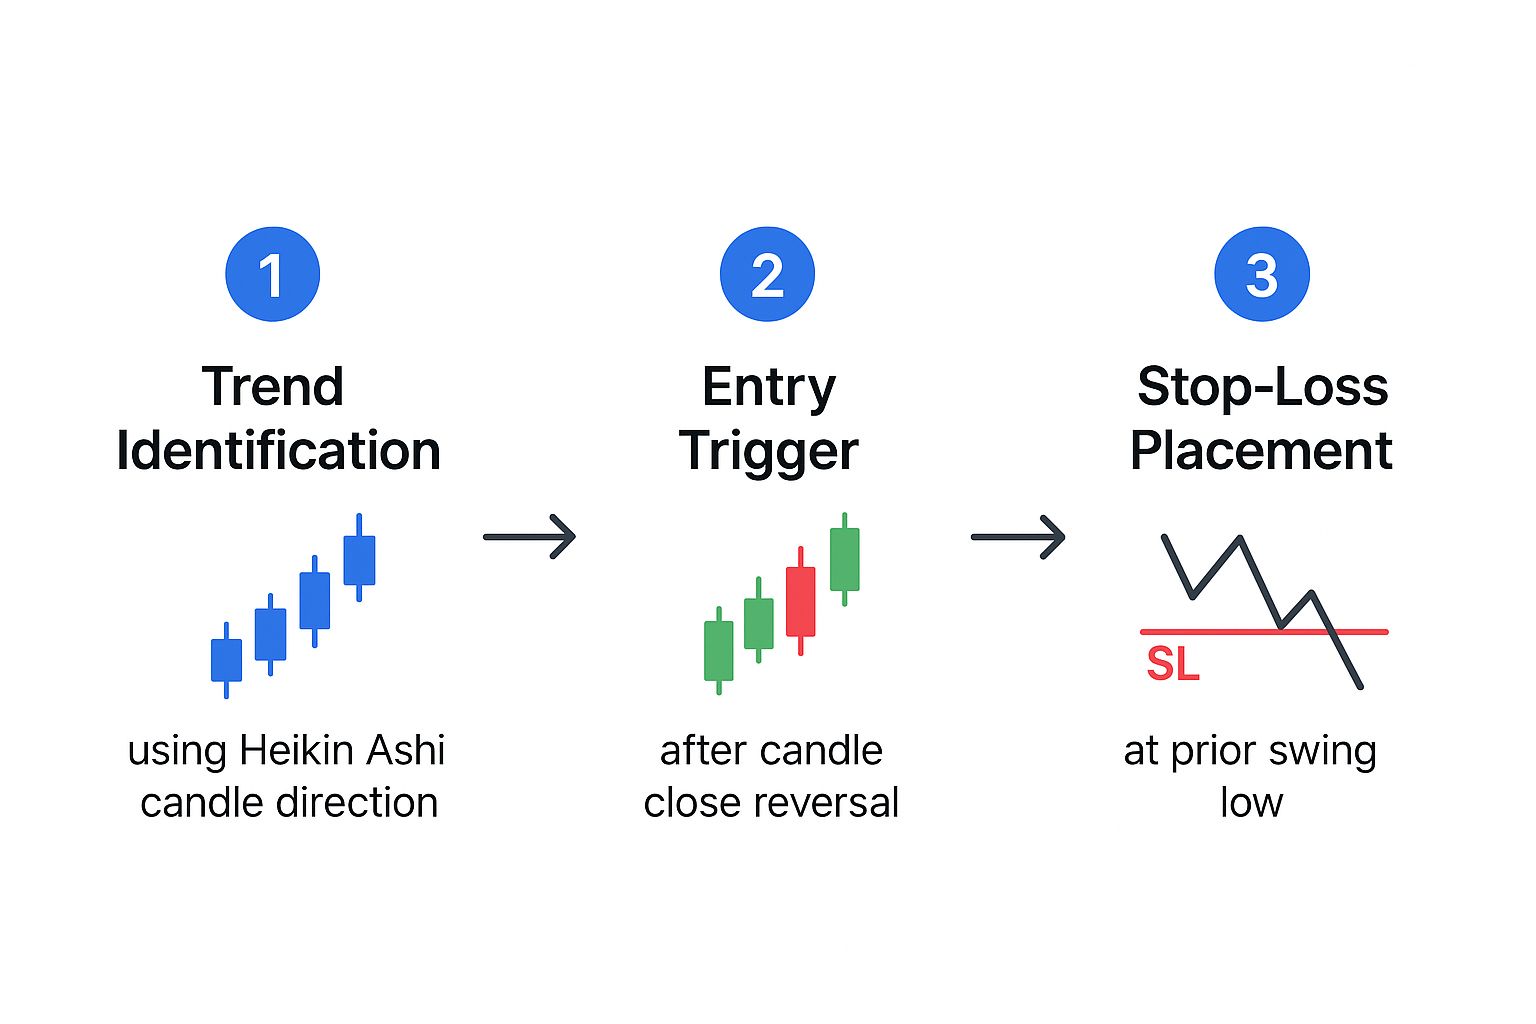
This visual guide breaks down the decision-making process into three clear stages, making sure you only take a trade when the trend, trigger, and risk all align.
Avoiding Unfavorable Market Conditions
Knowing when to trade is important, but knowing when not to trade is just as critical. Some market conditions are just poison for trend-following systems like those built on Heikin Ashi. This is where checking correlations and fundamentals comes in handy. For example, if you're thinking about going long on an airline stock but the price of oil is shooting up, that's a huge red flag. You don't need to be a fundamental expert, but a quick look at major economic news or related markets can save you from jumping into a trade that's set up to fail from the start.
By layering these advanced filters—multi-timeframe analysis, volume, market structure, and correlation checks—you can turn a basic Heikin Ashi strategy into a much more dependable system. You're no longer just following signals; you're an active trader making smart decisions based on a confluence of evidence.
Backtesting That Reveals the Truth
Let's start with a hard truth: most backtesting, especially for a Heikin Ashi strategy, is dangerously misleading. It's incredibly easy to build a system that looks like a money-printing machine on paper, only to watch it fail spectacularly when you risk real capital. This often happens because Heikin Ashi charts don't show the actual market price; they display an averaged-out version. If your backtesting software isn't built to handle this critical difference, your results are pure fantasy.
The biggest trap is something called "look-ahead bias." A Heikin Ashi candle's open and close are calculated using data from the current standard candle. A basic backtester that uses the Heikin Ashi close price to trigger a trade is essentially letting your strategy see into the future, filling orders at prices that were never actually available. This is why a specialized platform like ChartsWatcher is so important; its backtesting engine is specifically designed to handle non-standard chart types correctly, ensuring your tests reflect what could have realistically happened.
Setting Up a Realistic Testing Ground
To get results you can actually trust, you need to treat your backtest like a live trading simulation. This means accounting for the unavoidable costs of trading: slippage and commissions. Because Heikin Ashi candles smooth out volatility, it's easy to underestimate these costs. A long string of small, profitable trades in a backtest can be completely erased by transaction fees in the real world.
Your testing also needs to cover a wide range of market conditions. A strategy that performed brilliantly during the strong, clear trends of 2021 might completely fall apart in a choppy, sideways market. A solid backtest should always include:
- Bull Markets: Extended periods of upward price movement.
- Bear Markets: Periods of significant, sustained decline.
- Sideways/Ranging Markets: Volatile but directionless periods.
- High and Low Volatility Regimes: Testing across different VIX levels or ATR readings.
Putting your strategy through these different environments is the only way to know if you've found a genuine edge or if you just got lucky with a one-trick pony.
Interpreting Your Results: Beyond the Equity Curve
Once your test is done, a beautiful, upward-sloping equity curve is not enough. You have to dig into the performance metrics to understand the character of your strategy. To make sure your backtesting accurately mirrors potential real-world outcomes, it helps to use a robust data-driven decision-making framework.
Here’s what to look for, especially with a trend-following Heikin Ashi system:
| Performance Metric | What It Tells You for a Heikin Ashi Strategy | A "Good" Sign | A "Red Flag" |
|---|---|---|---|
| Profit Factor | The ratio of your gross profit to gross loss. | Consistently above 1.75 across different market conditions. | Below 1.5, suggesting trading costs will likely eat your profits. |
| Max Drawdown | The largest peak-to-trough drop in your equity. | A drawdown you can psychologically handle (e.g., under 20%). | Drawdowns so large you'd abandon the strategy in real life. |
| Win Rate | The percentage of winning trades. | Often lower for trend systems (35%-50% is common). | A very high win rate (>70%) could be a sign of curve-fitting. |
| Average Win/Loss | The average size of your winners compared to your losers. | The average winner is at least 2.5x the average loser. | Winners are only slightly larger than your losers. |
A common pitfall is over-optimization, also known as "curve-fitting," where you tweak parameters until they perfectly match historical data. This creates a strategy that knows the past flawlessly but has no predictive power for the future. A good way to check for this is to validate your strategy on a different asset or timeframe. If your system only works on Tesla's 1-hour chart from last year, you don't have a strategy; you have a coincidence. For a deeper look into building a solid testing process, our complete guide on how to backtest a trading strategy offers a detailed playbook. True confidence comes not from a perfect backtest, but from a resilient one that holds up under pressure.
Risk Management for Smoothed Price Systems
A brilliant entry signal is worthless if poor risk management wipes out your account. When it comes to a Heikin Ashi strategy, this danger is magnified because conventional risk techniques simply don't work. Placing a tight stop-loss based on a single Heikin Ashi candle is a recipe for disaster. Since the chart shows an averaged price, the actual market price can easily swing down and trigger your stop, even while the Heikin Ashi trend remains perfectly intact. You’re playing a different game, so you need a different rulebook.
Managing risk with a smoothed price system requires letting go of the need for surgical precision and embracing a more zone-based approach. Your primary job isn't to protect against every tiny fluctuation but to safeguard your capital from a genuine trend reversal. This means giving your positions more room to breathe while still having a clear line in the sand.
Stop-Loss Placement for Heikin Ashi
Forget placing your stop just below your entry candle. Instead, you need to anchor your risk to a more significant market structure point that is independent of the Heikin Ashi smoothing. A much more robust method is to place your stop-loss below the most recent swing low on a standard candlestick chart before your entry signal.
Imagine a downtrend has just ended, and you get a bullish Heikin Ashi entry signal. Before you enter, you would identify the lowest point the market reached during that prior downtrend. Your stop-loss goes there. This accomplishes two things:
- It places your risk at a structurally significant point that the market would have to break to invalidate the new trend.
- It protects you from getting stopped out by the gap between the Heikin Ashi price and the actual market price.
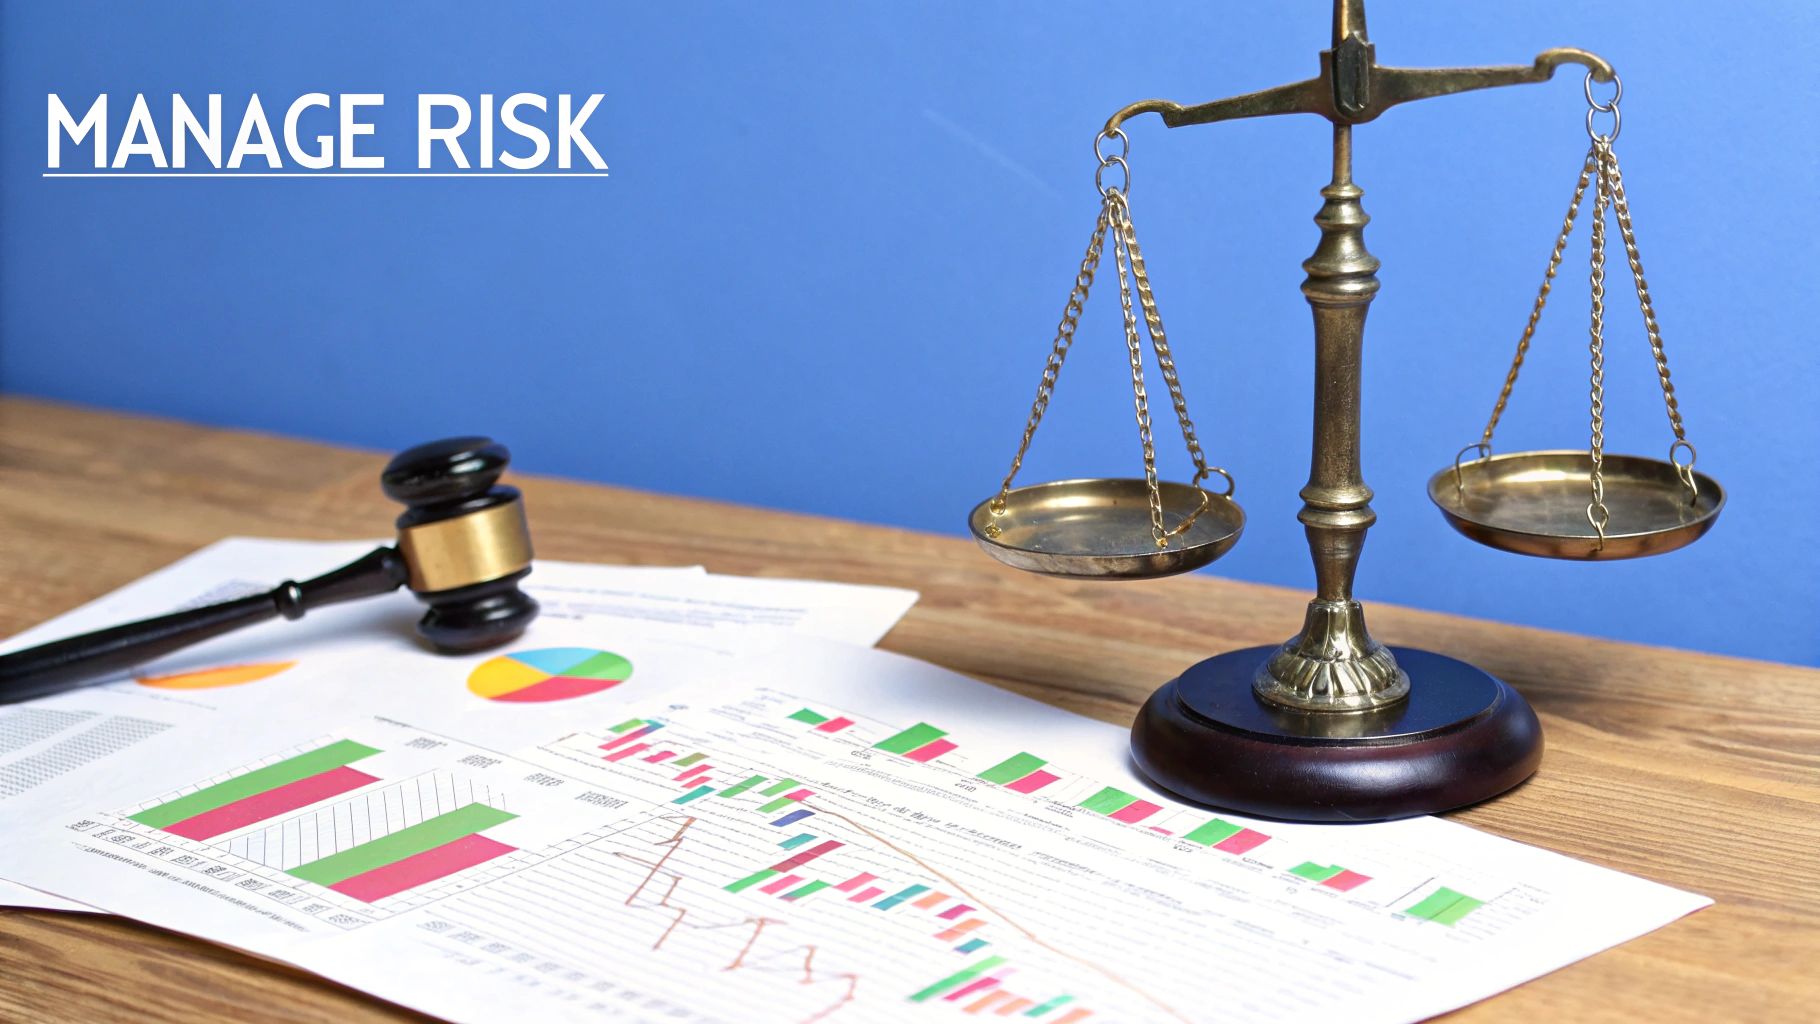
The image below illustrates the core principles that must guide any risk management framework.
This flowchart highlights that risk management isn't just about placing stops; it's a complete process of identifying, analyzing, and then mitigating threats to your capital.
Dynamic Position Sizing and Portfolio-Level Risk
Your risk per trade shouldn't be a one-size-fits-all number. A more advanced approach is to use dynamic position sizing. The core idea is to risk more on high-conviction setups and less on more speculative ones. For instance, a trade that aligns with a powerful trend on the daily, 4-hour, and 1-hour charts might justify a 2% capital risk. In contrast, a trade showing a reversal on the 1-hour chart but still fighting the daily trend might warrant only a 0.5% risk.
This approach becomes even more critical when running multiple Heikin Ashi strategies across different assets. Be mindful of correlation. If you have long positions on two highly correlated tech stocks, you haven't diversified your risk; you've doubled down on the same bet. True portfolio risk management involves ensuring your active trades aren't all exposed to the same market forces. For a closer look at these concepts, check out our extensive guide on mastering day trading risk management. Ultimately, with a Heikin Ashi strategy, your survival depends not on catching every move but on protecting your capital from the few moves that can truly hurt you.
Your Complete Heikin Ashi Action Plan
Theory is great, but trading success is all about execution. This is where we pull everything together into a concrete, repeatable action plan. A solid Heikin Ashi strategy is more than just a few entry and exit rules. It’s a full routine that guides your trading day, from pre-market analysis to your post-session review. The idea is to build a professional process that uses Heikin Ashi's trend-filtering power while giving you the discipline to sidestep those emotional, account-draining mistakes.
Think of this plan as your personal trading roadmap. It ensures you never miss a critical step or make an impulsive decision in the heat of the moment. It’s all about building habits that turn good analysis into consistent results.
The Pre-Trade Checklist: Your Personal Quality Control
Before you even consider placing a trade, you need a systematic way to check if a setup meets your strict criteria. A checklist forces you to slow down and think logically, which is the best defense against chasing low-quality signals. It acts as the final gatekeeper between a well-researched idea and a reckless gamble.
For a Heikin Ashi trader, a practical checklist might look something like this:
| Analysis Step | Question to Answer | Yes / No |
|---|---|---|
| High-Timeframe Context | Does the daily chart show a clear, dominant trend direction? | ☐ |
| Setup Confirmation | Does the 4-hour chart show a pullback or consolidation within that trend? | ☐ |
| Entry Signal | Has the 1-hour chart printed a confirmed Heikin Ashi reversal candle? | ☐ |
| Volume Support | Is there a noticeable increase in volume supporting the potential move? | ☐ |
| Risk Defined | Have I identified a logical stop-loss level below a prior swing? | ☐ |
| R:R Calculation | Does this trade offer at least a 2:1 reward-to-risk ratio? | ☐ |
If you can't tick every single box, the trade is a no-go. It's that simple. This non-negotiable process is what separates disciplined traders from gamblers just hoping for a lucky break.
Building a Bulletproof Trading Routine
A routine provides structure and gets rid of the need for constant decision-making, which is a huge drain on mental energy. It ensures you perform at your best by automating the mundane parts of trading. This frees you up to focus on what really matters: analyzing market behavior.
Here’s a sample routine built around a Heikin Ashi system:
- Pre-Market (60 mins): Go over overnight news and check the economic calendar for major events. Scan your watchlist for assets that are getting close to key support or resistance levels. Get your trading checklist ready for the day.
- Market Open (First 90 mins): Do not trade. The opening bell is often chaotic and full of fake-outs. Use this time to watch how the market reacts to overnight news and to identify the day's initial trend direction.
- Mid-Session (The "Golden Hours"): This is your main window for trading. Actively monitor your best setups, waiting patiently for them to meet every single criterion on your checklist before you execute.
- Post-Session (30 mins): Log every trade in your journal. Make sure to record your entry, exit, initial stop-loss, the reason for the trade, and a screenshot of the setup. Note any mistakes or times you felt emotional pressure.
This structured approach changes trading from a reactive, stressful activity into a methodical, business-like operation.
By consistently applying this action plan—using your checklist for every trade and sticking to your daily routine—you’ll build the discipline and framework needed for long-term success. Ready to put these principles into practice with a platform built for serious analysis?
Take your Heikin Ashi strategy to the next level. Explore the advanced charting, backtesting, and custom alerts in ChartsWatcher today.
