Master the stock screener for swing trading: A practical guide
Before you even think about hunting for specific chart patterns or momentum signals, you have to build a solid foundation. An effective stock screener for swing trading isn't about finding winners right away; it’s about filtering out the vast universe of junk stocks, making sure only viable, liquid, and stable companies ever reach your analysis stage.
Honestly, this initial pass is probably the most important step in the whole process.
Setting Up Your Foundational Swing Trading Screen

Before we start plugging in numbers, let’s be clear about where swing trading fits. It's not the frantic, high-frequency world of day trading, and it’s certainly not the slow, patient game of long-term investing.
Swing trading occupies a unique middle ground. It sits perfectly between the high-octane world of day trading and the patient approach of position trading, offering a balanced risk-reward profile ideal for capturing market moves over 1 to 20 sessions. Market analyses consistently show day trading carries the highest risk from intraday volatility, while position trading is safest with its longer horizons. Swing trading lands right in the middle with moderate exposure.
This strategic position means our screener has to find stocks with enough juice (volatility) to create opportunities, but also enough stability to avoid those nasty overnight gaps that can completely wipe out a position.
Defining Your Baseline Universe
The goal of this first screening layer is simple: elimination. We want to toss out stocks that are too risky, too thinly traded, or just too small to be reliable candidates. Think of it as building a velvet rope for your watchlist—only qualified stocks are getting in.
My personal baseline screen, which I apply before any technical filters, always nails down these three core components:
- Minimum Share Price: This instantly gets rid of the penny stocks. They're often playgrounds for manipulation and suffer from wild, unpredictable volatility. A higher share price is usually a good sign of a more established company.
- Average Daily Volume: This is absolutely non-negotiable. You have to be able to get in and out of a trade without significant slippage. A low-volume stock can leave you stuck in a position, unable to sell at your target price.
- Market Capitalization: This helps you focus on companies of a certain size, filtering out the highly speculative and less stable micro-caps.
These foundational filters are the bedrock of any serious stock screener. They make sure you're fishing in a pond stocked with quality candidates instead of wasting time on names that carry unacceptable risks right from the start.
Key Takeaway: Your first set of filters should not be about finding winning trades. It should be about aggressively disqualifying bad candidates. This defensive mindset is what separates amateur screeners from professional ones.
Practical Baseline Filter Settings
Alright, let's translate these ideas into actual numbers you can plug into a tool like ChartsWatcher. These thresholds are a great starting point, but you should feel free to tweak them based on your own risk tolerance and the current market environment. For those interested in the deep mechanics of data gathering for screeners or even building custom data sources, it’s fascinating to learn how to build a web crawler.
Here’s a look at some core settings that can serve as a solid baseline for your own screens. This table provides a starting point for fundamental screener settings, designed to filter out noise and focus on quality swing trading candidates.
Core Filter Settings for a Baseline Swing Trading Screen
| Filter Parameter | Recommended Threshold | Rationale for Swing Trading |
|---|---|---|
| Share Price | > $10 | Removes penny stocks and low-float securities prone to manipulation and extreme volatility. |
| Average Daily Volume (30-Day) | > 500,000 shares | Ensures sufficient liquidity to enter and exit positions without significant price slippage. |
| Market Capitalization | > $500 million | Focuses on established, more stable companies, avoiding highly speculative and unpredictable micro-caps. |
| Exchange | NYSE, NASDAQ | Limits results to major U.S. exchanges, which have stricter listing requirements and better data reliability. |
By establishing these non-negotiable criteria first, every technical or pattern-based filter you apply later is working on a pre-qualified list of stocks. This dramatically boosts the efficiency and effectiveness of your entire screening workflow.
Screening for Powerful Momentum and Market Trends
Alright, now that we have a clean universe of quality stocks, it's time to build the engine of our screener. This is where we shift from playing defense to going on offense, creating filters that will hunt down stocks with real, established momentum.
A great company is one thing, but if its stock price is just sitting there, it's dead money for a swing trader. We need movement. So, we're going to get practical and focus on the indicators that truly define a stock's trend and strength, finding names that are already doing exactly what we want to profit from.
Using Moving Averages to Define the Trend
The simplest, and frankly one of the most effective, ways to get a read on a stock’s primary trend is with moving averages. The 50-day and 200-day simple moving averages (SMA) are the industry standard for a reason—they give you a clear look at the intermediate and long-term sentiment of the big money.
For bullish setups, the game plan is simple: find stocks that are clearly in an uptrend. This means the price is holding above these key moving averages, which signals strength and tells you buyers are in control.
A classic bullish screen I've used for years includes these two non-negotiable filters:
- Price is above the 50-day SMA: This confirms the stock has healthy momentum in the intermediate term.
- The 50-day SMA is above the 200-day SMA: Many call this the "golden cross" setup. It signals a strong, established bullish trend that institutions pay attention to.
And for bearish setups? Just flip it. Find stocks trading below these moving averages to identify confirmed downtrends. A good screener lets you invert these rules in a second, so you can adapt no matter which way the market is headed. If you want to go deeper on this, we've broken down more essential tools in our guide to the 8 best indicators for swing trading to use in 2025.
Highlighting Market Leaders with Relative Strength
Finding a stock in an uptrend is good. But finding a stock that's crushing the broader market? That's where the real money is made. This is why a relative strength filter is an absolute must-have in your toolkit. It directly compares a stock's performance to a benchmark, usually the S&P 500 (SPY).
This filter is ruthless—it instantly separates the true leaders from the laggards. Why would you want to own a stock that’s up 10% when the whole market is up 15%? You want the stocks that are dragging the market higher.
A powerful, yet simple, relative strength filter might look like this:
- 3-Month Performance vs. S&P 500:
> +30%
This one rule is incredibly potent. You're telling your screener to only show you stocks that have outrun the S&P 500 by at least 30% over the last three months. These are the momentum powerhouses that have a high probability of continuing to lead.
Expert Tip: Don't just look for positive relative strength. I look for accelerating relative strength. A stock that has just broken out and started to outperform the market is often a much more explosive candidate than one that’s been a leader for months and might be getting extended.
Putting It All Together: A Practical Momentum Screen
So, let's put these pieces together into a concrete screen you can build right now in a tool like ChartsWatcher. The best strategies always combine a few key elements, like volume, momentum, and a solid technical picture.
For instance, a go-to screen for many pros looks for stocks that have outperformed the S&P 500 by 30% or more over the last three months, trade an average daily volume over 2 million shares, and are holding firmly above both their 50-day and 200-day moving averages. As you can see, these aren't random numbers; they're designed to isolate the absolute top movers on the board. You can discover more insights about proven stock lists on TradeThatSwing.com to see similar professional criteria in action.
This is what it looks like inside ChartsWatcher. You can see how easy it is to stack these conditions, blending foundational filters like volume with technical criteria like moving averages and relative strength. The result is a highly specific and effective screen.
By combining these filters, you've transformed a massive list of "qualified" stocks into a tight, curated watchlist of the strongest momentum candidates. These are the names with clear institutional footprints that are leading the market. Now, the next step is to pull up their charts and hunt for the perfect entry.
Integrating Chart Patterns and Volume Confirmation
So far, we’ve cut down the entire market to a manageable list of liquid, established companies and then zeroed in on the ones with real momentum. That’s a huge step, but now it's time to add a layer of precision that really separates the A+ setups from the merely "good enough."
A stock that's just moving up is one thing. But a stock with momentum that's also coiling up into a classic, powerful chart pattern? That's another beast entirely. This is where we stop looking at charts with our eyes and start teaching our screener to see what we see.
Turning Visual Patterns Into Scannable Rules
Chart patterns are nothing more than the visual story of supply and demand playing out. Take an ascending triangle, for example. It tells a simple story: buyers are consistently stepping in at higher and higher prices, while sellers are stubbornly holding the line at a specific resistance level.
Eventually, something has to give. When the buyers finally win and push through that resistance, the breakout can be explosive. But how do you tell a stock screener for swing trading to find an "ascending triangle"? You can't. What you can do is break the pattern down into its core, quantifiable ingredients.
Here’s how you could translate that visual pattern into hard screener logic:
- Price Proximity to 52-Week High: The current price is within 5% of its 52-week high. This tells the screener to look for stocks pushing up against a major resistance zone.
- Recent Low vs. 3-Month Low: Make sure the low of the past 10 days is at least 15% higher than the 3-month low. This confirms the "higher lows" part of the pattern, showing us that buyers are getting more aggressive.
- Consolidation Range: The trading range over the last 20 days (High - Low) is less than 10%. This is our filter for tight consolidation—the coiling spring effect right before a potential breakout.
By combining rules like these, you’re no longer just hoping to spot a pattern. You’re giving your screener the mathematical DNA of that pattern and telling it to hunt on your behalf.
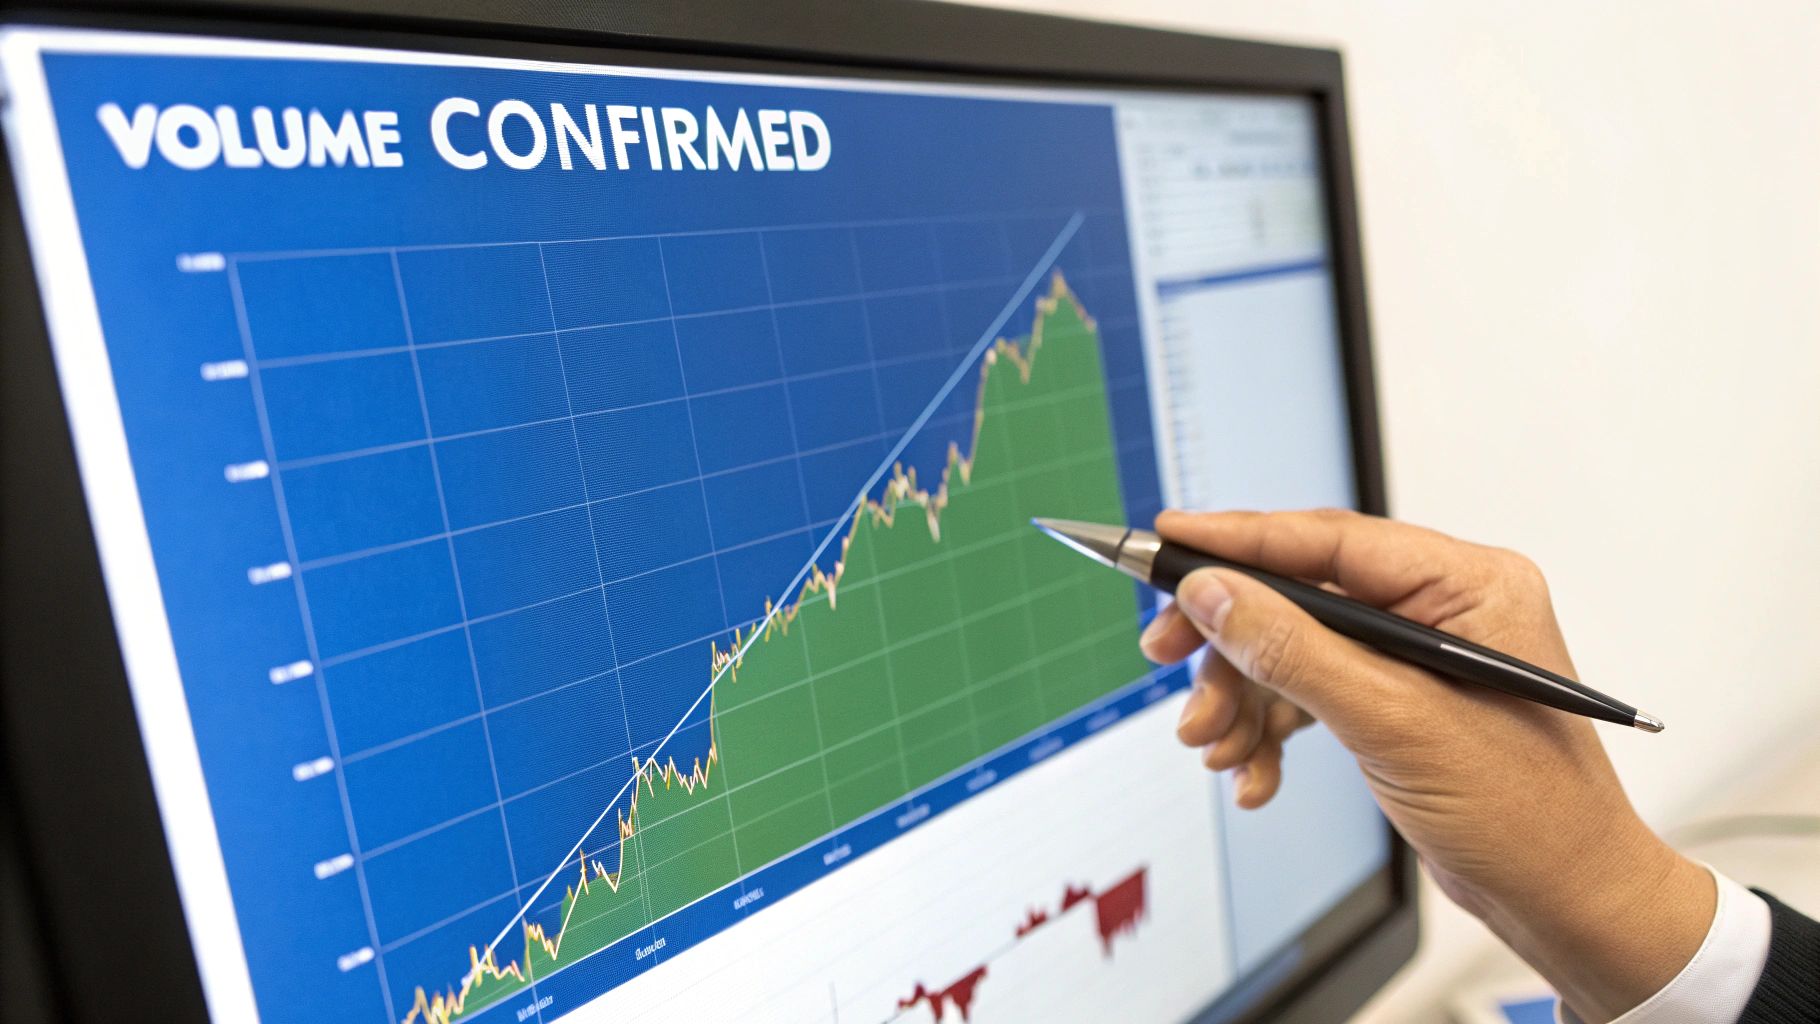
Using Volume as Your Truth Detector
If chart patterns tell the story, then volume tells you whether or not to believe it.
A price move on anemic volume is suspicious. It lacks conviction and can easily fall apart. On the other hand, a breakout that occurs on a massive surge of volume is a completely different signal. It suggests heavy institutional participation—the "big money"—and a much higher chance of follow-through.
Volume is the ultimate confirmation tool. It's the fuel that powers a sustained trend. Ignoring it is one of the single most expensive mistakes a swing trader can make.
Trader's Insight: Think of volume as the engine of a car. A rising price is like pushing the gas pedal, but if the engine (volume) isn't revving, you're just coasting. A breakout without a significant volume spike is a major red flag that the move could be a fake-out.
We absolutely must build filters that demand this confirmation. It's how you screen for authenticity and sidestep those weak, unconvincing moves that fizzle out before they even get started.
Creating Filters for Volume Confirmation
Let's get specific. You don't just want "high volume"—you want volume that is unusually high, especially on pivotal days. This is how you translate that idea into concrete, actionable filters for your screener.
Consider adding these kinds of volume conditions to your scans:
- Relative Volume (RVOL): This is a killer metric. It compares today's volume to its average over a recent period. A simple filter like
Relative Volume > 2.0will instantly find stocks trading at least 100% more volume than they normally do. It’s a classic signature of unusual attention. - Volume on Up Days vs. Down Days: You can look for stocks where the average volume on "up" days is significantly higher than the volume on "down" days. This is a tell-tale sign of accumulation, where institutions are quietly buying into strength.
- Volume Spike on Breakout Day: A more advanced filter can be configured to trigger only when a stock pierces a key price level and its volume for that day is already well above its 30-day average.
When you pair a sharp, pattern-based screen with these kinds of volume confirmation rules, your results become incredibly potent. You're no longer just finding stocks that look good on a chart; you're finding stocks that have the institutional firepower to actually back up the move. That combination is a cornerstone of identifying high-probability swing trades.
How to Adapt Your Screener for Any Market Condition
A static, one-size-fits-all approach to the market is a recipe for disaster. That momentum breakout strategy that prints money in a roaring bull market? It'll get you chopped to pieces when conditions turn sideways or bearish. The best traders I know are chameleons, constantly adapting their tactics to what the market is giving them right now.
Your stock screener for swing trading has to be just as flexible. The key is to build a small toolkit of specialized screens, each one pre-configured for a specific environment. When you have these ready to go, you can pivot on a dime, ensuring you're always fishing in the right pond for the highest-probability setups.
The Bullish Breakout Screen
This is your workhorse when the major indexes are climbing and optimism is in the air. We're hunting for the strongest stocks breaking out of clean consolidation patterns and pushing to new highs. The secret sauce here is confirming the move with a massive surge in volume, which is our clue that big institutions are piling in.
Here’s what a "Bullish Breakout" screen looks like when you're focused on pure strength and confirmation:
- Price vs. 52-Week High: Current Price is within 3% of its 52-Week High. This gets us stocks that are either right at the cusp of a major breakout or have just started their move.
- Relative Strength vs. S&P 500 (3-Month): Greater than +25%. We don't want good stocks; we want the absolute market leaders.
- Average Volume (50-Day): Greater than 1,000,000 shares. This weeds out thinly traded, illiquid names and keeps us focused on stocks with real institutional interest.
- Relative Volume: Greater than 2.5. This is our ignition filter. We demand that today's volume is at least 150% higher than normal to validate the breakout.
This combination is built to find explosive moves in a healthy market. It systematically ignores the laggards and zeroes in on the leaders of the pack.
The Bearish Breakdown Screen
When the market tide turns, trying to force long trades is like swimming against a riptide. Smart traders don't fight it—they flip their bias and start hunting for weakness. This "Bearish Breakdown" screen is engineered to find vulnerable stocks cracking below critical support levels on a spike in selling volume.
The logic here is simply the mirror image of our bullish screen:
- Price vs. 52-Week Low: Current Price is within 3% of its 52-Week Low. We’re looking for stocks that are falling out of bed.
- Relative Strength vs. S&P 500 (3-Month): Less than -25%. This targets the market's weakest performers.
- Price vs. 50-Day SMA: Price is below the 50-Day SMA, confirming the intermediate-term trend is firmly down.
- Volume Spike on Down Day: Today's Volume is greater than the 20-Day Average Volume, and the Price Change is negative. This tells us the breakdown has conviction, likely fueled by panic selling.
Running this scan during a market correction can uncover some fantastic shorting opportunities while everyone else is getting stopped out of their longs.
The Mean Reversion Screen
Markets don't always trend cleanly up or down. A lot of the time, they get stuck in a choppy, sideways grind where both breakout and breakdown strategies get chewed up. In these conditions, a "Mean Reversion" approach can shine. The goal is to find fundamentally solid stocks that have been temporarily stretched too far, too fast—and are due for a snap-back toward their average price.
This screen is a bit more nuanced and often leans on oscillators:
- RSI (14-Day): Less than 30. The classic signal for identifying oversold conditions, suggesting a stock might be due for a bounce.
- Price vs. 20-Day SMA: Price is between 5% and 10% below the 20-Day SMA. This finds stocks that have pulled back sharply from their short-term trend.
- Long-Term Trend: Price is above the 200-Day SMA. This is the most important rule. We only want to buy dips in stocks that are still in a major long-term uptrend. We're catching a pullback, not a falling knife.
Key Insight: Having these distinct, pre-built screens allows you to react to changing market conditions, not predict them. The market tells you which scan to run, giving you a systematic way to stay in sync with its rhythm.
With these different approaches in mind, you can build a screener for almost any environment. The idea is to have a specific tool ready for a specific job.
Swing Trading Screener Templates for Various Market Conditions
| Screener Type | Key Filters | Ideal Market Condition | Example Stock Pattern |
|---|---|---|---|
| Bullish Breakout | Price near 52-week high, high Relative Strength (>+25%), high Relative Volume (>2.5) | Strong, trending bull market with broad participation. | Stock breaking out of a tight consolidation base or "cup and handle" pattern on heavy volume. |
| Bearish Breakdown | Price near 52-week low, weak Relative Strength (<-25%), price below 50-DMA, volume spike on a down day. | Market correction or bear market where fear is the dominant emotion. | Stock violating a key support level or breaking down from a "head and shoulders" top. |
| Mean Reversion | Oversold RSI (<30), price is 5-10% below 20-DMA, but still above the 200-DMA. | Choppy, range-bound, or sideways markets where trends fail to follow through. | A strong stock in a long-term uptrend experiencing a sharp but temporary pullback to a support area. |
Having these templates ready to deploy means you're never caught off guard. When market character shifts, you simply switch to the appropriate screener and keep executing.
The top stock screeners for swing trading can deliver a real, statistically validated edge. Some services even boast backtested win rates over 70% on specific setups after crunching years of data. For instance, analysts have run thousands of simulations to pinpoint patterns, leading to alerts for trades lasting a few days to two weeks with historical performance like 71.4% wins. It’s all about finding what works and applying it systematically. You can learn more about how statistical analysis enhances swing trading strategies on TVMarkets.com.
Turning Your Scan Results into Actionable Trades
Getting a list of promising stocks from your scanner is really just the starting gun. Your swing trading screener has done the heavy lifting of slicing through market noise, but now the real work begins. This is where a disciplined workflow separates a simple list of tickers from a well-executed trade.
Once your scan spits out the results, the next job is to analyze them without getting overwhelmed. Using advanced AI data analysis can be a huge help here, letting you spot trends, anomalies, and patterns that might not be immediately obvious. This is how you turn a raw data dump into a shortlist of A+ setups.
From this point on, the process shifts from the automated scan to my manual, discretionary analysis. This is where a trader's experience really makes the difference.
This workflow is all about that crucial transition from the automated scan to the hands-on analysis and, finally, the trade itself.
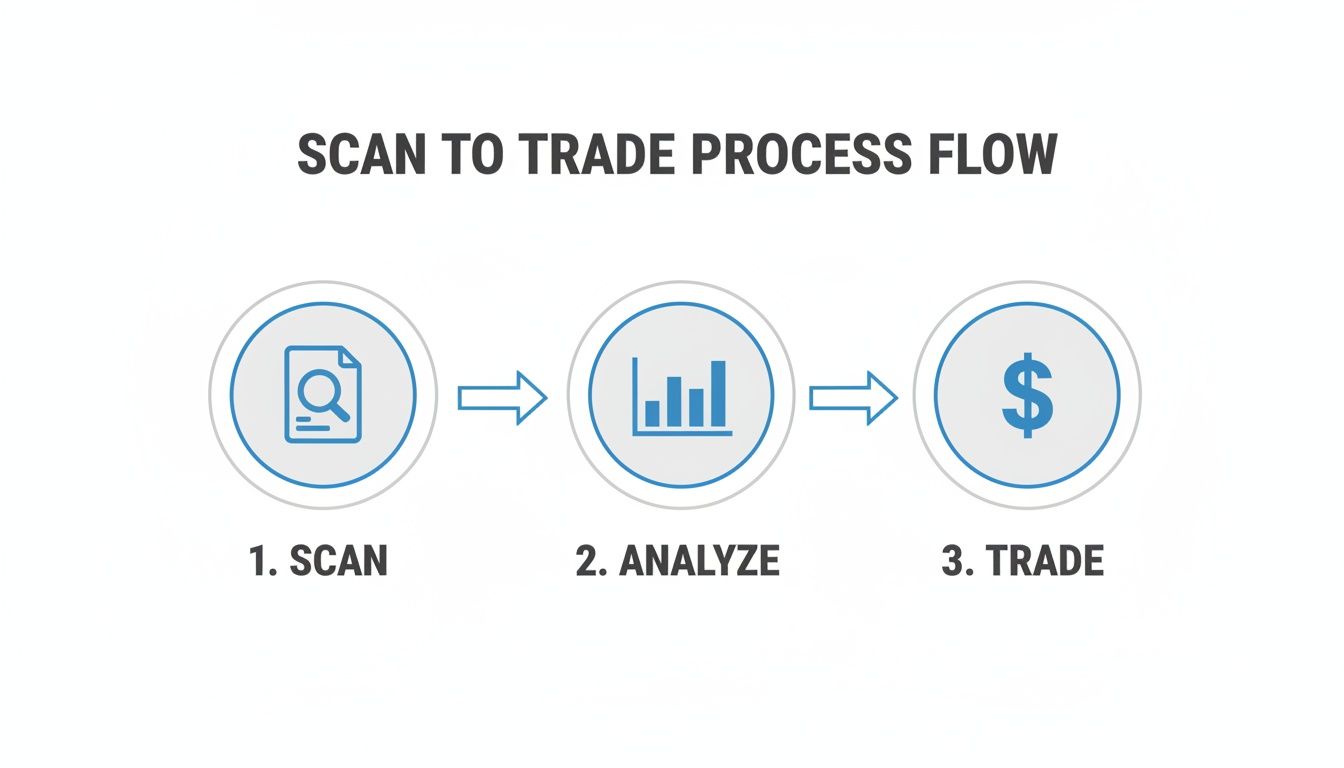
Each part of the process builds on the last, making sure only the highest-quality setups from your screener ever make it into your portfolio.
The Manual Chart Review Checklist
I never, ever trade a stock from a screener without pulling up its chart first. The screener gets you in the ballpark, but your own eyes have to confirm the setup is legit. This manual review is where I add my own layer of conviction, looking for specific nuances that a machine just can't quantify.
Here's my personal checklist before I'll even consider a trade:
- Structure Confirmation: Does the chart actually look like the pattern the screener found? I'm looking for clean areas of support and resistance, not a choppy, indecisive mess.
- Precise Entry Point: Where exactly is the trigger to get in? This could be a break above a specific pivot high, a bounce off a key moving average, or a move out of a tight consolidation range.
- Logical Stop-Loss Placement: Before I even think about my entry, I find the exact price where the trade idea is proven wrong. This is usually just below a recent swing low or a major support level.
- Risk-to-Reward Assessment: Is the distance to my first reasonable price target at least twice the distance to my stop-loss? If the risk-reward ratio is less than 2:1, I usually just move on.
This manual check is your last line of defense against sloppy setups. It ensures every trade you take has a clear, predefined plan behind it.
Building Confidence Through Backtesting
How can you really trust that your screener settings are any good? You have to prove they work. Backtesting is simply applying your screener rules to historical data to see how they would have performed in the past. It’s not about predicting the future; it's about validating your methodology.
A thoroughly backtested strategy gives you the conviction to pull the trigger without hesitation in live market conditions. It replaces hope with data-driven confidence, which is everything if you want to be consistent long-term.
Setting up a solid backtest can be a detailed process. To dive deeper, check out our complete guide on how to backtest trading strategies like a pro, which walks you through it step-by-step.
Setting Alerts and Integrating Risk Management
Once your shortlist is ready, the waiting game begins. But instead of being glued to your charts all day, set real-time price alerts at your predetermined entry triggers. Platforms like ChartsWatcher let you create alerts based on the exact same conditions you used in your screener, pinging you the moment a setup goes live.
Finally, you need to bake risk management directly into your process. This isn’t an afterthought; it’s part of the trade plan from the get-go.
- Position Sizing: Your position size should change based on the stock's volatility and how far away your stop-loss is. A wider stop demands a smaller position size to keep your dollar risk consistent.
- Earnings Awareness: Always check for upcoming earnings announcements. Taking a swing trade right before a company reports is a pure gamble, not a calculated risk. I personally close all my positions before an earnings call.
When you combine a powerful screener with a disciplined post-scan workflow, you turn a simple tool into the foundation of a complete, professional trading system. This process ensures every trade is systematic, well-planned, and managed with precision.
Common Questions About Swing Trading Screeners
Even with a perfect game plan, questions always pop up when you're dialing in a new process. When it comes to using a stock screener for swing trading, a few common hurdles can really slow you down. Let's tackle some of the most frequent ones so you can fine-tune your approach with confidence.
One of the first things traders get hung up on is timing. It's a great question because over-screening can be just as damaging as not screening enough.
How Often Should I Run My Screens?
For most swing traders, the sweet spot is running your main screens once per day, right after the market closes. This rhythm lets you digest the day's action, see how potential setups are shaping up, and build a clean watchlist for the next morning. You get to do all of this without the constant distraction and noise of intraday price swings.
Once you have that hand-picked watchlist, you can then switch over to real-time price alerts for your top candidates. It’s a hybrid approach that gives you the best of both worlds: a calm, methodical nightly review, followed by sharp, automated execution signals when the market is open.
Free Versus Paid Stock Screeners
Another big question is about cost. Do you really need to pay for a tool to succeed in this game? Well, the answer isn't a simple yes or no.
You can absolutely get started and find success with free screeners. Tools like Finviz and Yahoo Finance are surprisingly powerful and can handle most of the fundamental and basic technical filters we’ve talked about. They're fantastic for building your first screens and just learning the ropes.
However, once you get serious, paid platforms offer a clear advantage. They unlock more advanced technical criteria (like screening for specific chart patterns), give you powerful backtesting engines, and serve up clean, real-time data. These features can dramatically shorten your learning curve and give you a much more professional edge.
My Take: Start with a free tool to prove your strategy actually works. Once you have a system that makes money and you know exactly what it needs, upgrading to a paid platform stops being an expense and becomes an investment in your own efficiency and precision.
What If My Screener Results Are Off?
It's the classic problem: you run a screen and get back a thousand results... or just two. This is a dead giveaway that your filters aren't calibrated correctly. Don't sweat it, this is usually an easy fix.
- Too Many Results? Your net is too wide. Start by tightening your most critical criteria first. If you’re running a momentum strategy, that might mean bumping up the relative strength requirement or demanding that the price be even closer to its 52-week high. Don't weaken your core rules; make them stricter.
- Too Few Results? Your screen is a ghost town. Start by loosening your secondary, "nice-to-have" filters. Maybe you can widen the market cap range or drop that filter for institutional ownership. Only after trying that should you even consider relaxing your core momentum and volume rules.
The goal is to find that perfect balance where your screener delivers a small, manageable list of high-quality stocks each day. A focused list of 5-15 names is way more actionable than getting buried under a list of a hundred.
Ready to build these powerful, adaptive screens with a tool designed for serious traders? ChartsWatcher provides the advanced filtering, real-time data, and backtesting capabilities you need to turn theory into actionable trade ideas. Start building your professional screening workflow today at https://chartswatcher.com.
