Master Supply Demand Zone Trading Strategies
The Hidden Power of Supply and Demand Zones
Let's face it: many traders miss out on the real power of supply and demand zone trading. These zones are not just random areas on a chart. They represent vital inflection points where important shifts in market sentiment take place. Grasping the psychology behind these zones—and how large investors influence their creation—is key to unlocking their potential.
Why Institutional Money Matters
Supply and demand zones often form due to the trading activities of institutional investors, like banks and hedge funds. These major players move significant amounts of money, creating noticeable price action.
A sudden increase in buying volume, for example, might indicate institutional accumulation and the creation of a demand zone. On the other hand, a large sell-off could signal institutional distribution, leading to a supply zone. These zones become self-fulfilling. Other traders see these patterns and adjust their behavior accordingly, reinforcing the zone's importance.
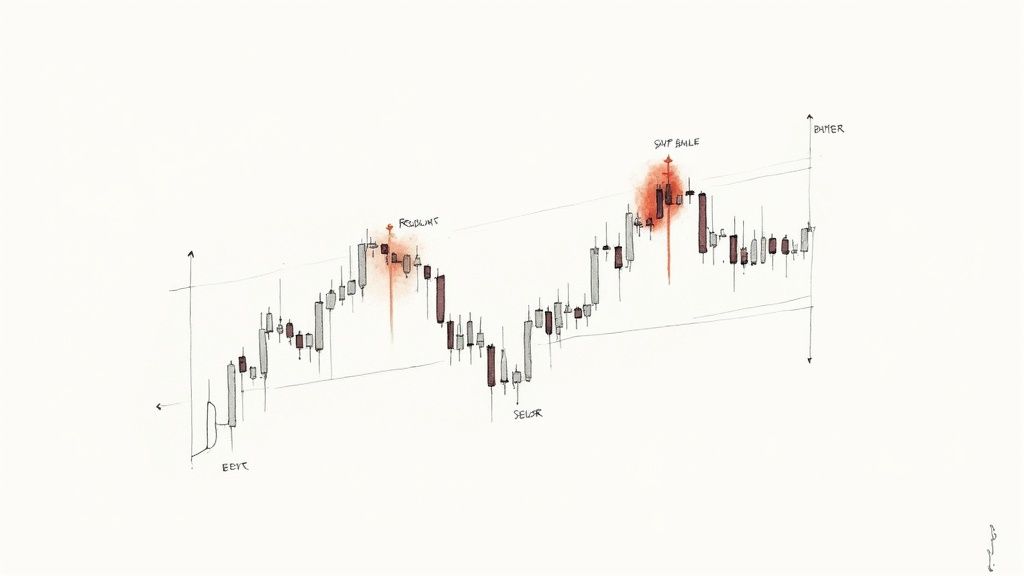
Supply and demand zones are critical for traders because they offer insights into potential market reversals or continuations. Traditionally, these zones are identified by observing substantial price movements, often initiated by institutional investors.
For example, in the forex market, with its daily trading volume exceeding $7.5 trillion, supply and demand zones hold considerable sway due to large institutional transactions. These zones are usually marked by sharp price reversals or significant volume spikes, highlighting areas where buyers or sellers have historically been dominant. By studying these zones, traders can anticipate future price movements based on past activity. Learn more about this concept: Supply and Demand Zones: Identifying Key Market Levels
Distinguishing Zones From Ordinary Support/Resistance
Many new traders confuse true supply and demand zones with ordinary support and resistance levels. There are, however, key differences.
Support and resistance levels frequently appear around round numbers or previous swing highs and lows. Supply and demand zones, however, are identified by analyzing specific price action patterns, volume surges, and the speed of price movements within the zone.
A true zone is characterized by a sharp, quick move into the zone followed by a period of consolidation or a reversal. This differs from typical support/resistance, which can involve multiple tests and gradual price grinding.
Identifying High-Probability Zones
Identifying high-probability supply and demand zones is essential. These zones have distinct characteristics.
- Look for zones formed on higher timeframes (daily or weekly charts). These tend to be more reliable.
- Consider the volume associated with the initial zone formation. High volume indicates strong conviction.
- Focus on "fresh" zones – those not yet retested by price – for the best trading opportunities.
How to master supply and demand zone trading techniques is a valuable resource for further exploration. Learning to spot these subtle clues differentiates consistently profitable traders from those who struggle. Understanding these zones transforms how you interpret price action, improving your ability to predict market movements.
Spotting High-Probability Zones That Actually Work
Stop guessing about supply and demand zones. Let's explore how successful traders pinpoint these crucial areas across different timeframes and market conditions. It's about understanding the subtle, yet critical, differences between effective and ineffective zones.
Identifying Legitimate Supply and Demand Zones
Successfully trading supply and demand zones hinges on correctly identifying them. This goes beyond simply finding support and resistance. It involves analyzing price action, volume patterns, and consolidation periods to isolate zones with real potential.
-
Price Action Signatures: Look for rapid price movements into the zone followed by a swift reversal or consolidation. These sharp moves often indicate institutional activity.
-
Volume Analysis: High volume during zone formation reinforces its significance. Low volume might suggest weaker interest.
-
Consolidation Characteristics: Tight, sideways consolidation within a zone suggests underlying support or resistance. Erratic price action might signal instability.
To help illustrate the key differences, let's look at a comparison table:
Understanding the characteristics of Supply and Demand Zones is critical for successful trading. The following table summarizes the key differences:
| Characteristic | Supply Zone | Demand Zone |
|---|---|---|
| Price Action | Sharp drop followed by consolidation or reversal | Sharp rise followed by consolidation or reversal |
| Volume | High volume on the drop | High volume on the rise |
| Location | Above current price | Below current price |
| Trading Strategy | Look for short selling opportunities | Look for buying opportunities |
This table provides a quick reference for identifying and differentiating between these crucial zones. Recognizing these characteristics allows traders to anticipate potential price movements and make more informed trading decisions.
Utilizing Multiple Timeframes for Confirmation
Confirming your findings on multiple timeframes provides extra validation. A zone identified on a daily chart gains more weight if it aligns with similar zones on weekly or hourly charts. This convergence strengthens the zone's significance.
Analyzing different timeframes also helps refine entry and exit points for more precise trades. This multi-timeframe approach provides a comprehensive market view.
The effectiveness of supply and demand zone trading hinges on proper identification and action. Traders who accurately pinpoint these zones see higher success rates. For example, entering a long position within a correctly identified demand zone increases the probability of an upward price move because it represents historical buyer dominance. Find more detailed statistics here: Demand and Supply Zone in Trading However, consistent profitability still requires confirmation signals and effective risk management. These combined factors help uncover hidden opportunities.
Decoding Price Behavior at Critical Market Zones
Understanding price action at supply and demand zones is key to successful trading. This knowledge separates consistent profits from losses. We'll explore the clues that forecast market moves: rejection patterns, breakouts, and consolidations.
Reading the Market's Signals
Price action within these zones provides valuable insights. A sharp rejection from a demand zone might signal a downward reversal. Conversely, a strong bounce from the same zone could indicate buying pressure and an upward trend. This is where pattern recognition becomes vital.
For example, a false breakout above a supply zone, followed by a quick reversal, can trap inexperienced traders. Experienced traders might see this as a shorting opportunity. These nuances can significantly impact trading outcomes.
Similarly, observing periods of consolidation within a zone offers clues about future price action. Tight consolidation often precedes a significant breakout. Erratic price action may indicate a lack of conviction. Recognizing these differences is crucial for effective supply and demand zone trading.
Identifying Institutional Footprints
Institutional traders often leave their mark at these critical zones. Their large-scale trading creates distinct patterns. A sudden surge in volume with a price drop into a demand zone can signal institutional accumulation, offering a potential buying opportunity.
Understanding the broader market context is also important. Accumulation occurs when large investors gradually buy at lower levels. This is often followed by reaccumulation, where buying resumes after a brief rally and pullback, further establishing a demand zone. Conversely, distribution involves selling at higher levels and can lead to a supply zone. Learn more about supply and demand trading patterns and strategies here. Recognizing these larger trends can improve trading strategies.
Mastering Entries and Exits
Timing is everything. Recognizing how price reacts to these zones allows for precise entries and exits. Entering a trade as price bounces off a demand zone can maximize profit potential. Exiting as price approaches a supply zone can limit losses.
This precision, based on market behavior, changes how traders interact with the market. It shifts the focus from reacting to anticipating price, leading to better decisions and potentially more profitable trades.
Battle-Tested Supply Demand Zone Trading Strategies
This section dives into the practical trading strategies professionals employ when working with supply and demand zones. We'll explore specific tactics, outlining clear entry points, stop-loss levels, and profit targets. The goal is to equip you with actionable methods you can implement in your trading.
The Zone Bounce Strategy
The Zone Bounce Strategy takes advantage of the tendency for prices to reverse at established supply and demand zones. This strategy focuses on buying at demand zones and selling at supply zones.
-
Entry: Initiate a buy order when the price reaches the top of a demand zone. For selling, enter a short order when the price touches the bottom of a supply zone.
-
Stop-Loss: Position your stop-loss order just outside the zone to protect against a potential zone breakdown.
-
Profit Target: A reasonable profit target is the opposite end of the trading range or a previous swing high or low.
The Fresh Zone Breakout Strategy
The Fresh Zone Breakout Strategy targets zones that have not been revisited. These "fresh" zones can often trigger powerful, directional price movements.
-
Entry: Enter a buy order after the price breaks above a fresh demand zone, confirmed by increased trading volume. Conversely, enter a short order after a break below a fresh supply zone, also with confirming volume.
-
Stop-Loss: Place your stop-loss below the low of the breakout candle for buy orders and above the high of the breakout candle for sell orders.
-
Profit Target: Calculate your profit target based on the zone's height, aiming for a similar price distance from the breakout point.
Combining Zones With Other Indicators
Many experienced traders enhance their supply and demand zone analysis by incorporating other indicators. For instance, volume analysis can help validate the strength of a zone, while momentum indicators can assist with timing entries and exits.
Adding candlestick patterns provides visual confirmation of reversals or breakouts within the zones. This multi-layered approach adds an extra level of confidence to the overall strategy.
Adapting Strategies Across Markets and Timeframes
These strategies can be applied to a variety of markets, including forex, stocks, and cryptocurrencies. However, adjustments are necessary based on each market's volatility and typical price action.
Choosing the right timeframe is equally important. Higher timeframes, like daily or weekly charts, tend to be more reliable. Lower timeframes, such as hourly charts, may offer more frequent trading opportunities but also increase the risk of false signals. Many traders utilize higher timeframes to identify key zones and then switch to lower timeframes for precise entry and exit points.
To illustrate the potential performance differences, let's examine the following table:
Supply Demand Zone Trading Strategy Performance
Statistical comparison of different zone trading approaches across various markets
| Strategy Type | Win Rate | Risk-Reward Ratio | Best Market Application |
|---|---|---|---|
| Zone Bounce | 60% | 1:1.5 | Range-bound markets |
| Fresh Zone Breakout | 50% | 1:2 | Trending markets |
| Zones + Volume Analysis | 65% | 1:1.75 | All markets |
| Zones + Momentum Indicators | 55% | 1:2.25 | Volatile markets |
The table highlights how combining supply and demand zones with other indicators can improve win rates and risk-reward ratios. It also underscores the importance of selecting the right strategy for specific market conditions. Adaptability is essential for trading success.
Protecting Your Capital While Trading Zones
Even with perfect supply and demand zone identification, success in trading isn't guaranteed without proper risk management. This section explains how successful zone traders manage risk to maximize their profits. We'll explore essential concepts, including position sizing, protective stops, scaling strategies, and the psychological aspects of trading.
Position Sizing Based on Zone Quality
Not all zones are created equal. High-quality zones, marked by decisive price action and substantial volume, justify larger positions compared to weaker, less defined zones. This allows for capturing more significant gains when the trade moves favorably.
However, position sizing must always be in line with your individual risk tolerance. A standard practice involves risking only a small fraction (e.g., 1-2%) of your trading capital on any single trade, regardless of perceived zone strength.
For example, with $10,000 in trading capital and a 1% risk tolerance, your maximum acceptable loss per trade is $100. This principle helps safeguard your capital and prevent substantial losses.
Placing Effective Protective Stops
Stop-loss orders are crucial for minimizing potential losses. These orders automatically close a trade if the price moves adversely, exceeding a pre-determined threshold. When trading zones, stops should be placed just beyond the zone's boundaries. This provides the trade some flexibility without exposing your capital to excessive risk.
Consider using different types of stop orders as well. A trailing stop, for example, automatically adjusts as the price moves in your favor, helping secure profits while allowing for further potential gains.
Scaling In and Out of Positions
Scaling in and out of trades offers flexibility, allowing traders to modify their position size according to market reactions within a zone. Scaling in involves gradually adding to your position as a trade moves favorably, providing confirmation of the zone's validity. Conversely, Scaling out involves incrementally reducing your position as the price nears your profit target, locking in gains along the way. This dynamic approach helps manage risk more effectively. For more on risk management, check out this helpful resource: How to master day trading risk management.
Managing the Psychology of Zone Trading
Supply and demand zone trading can present psychological challenges. Maintaining discipline and adhering to your trading plan, while avoiding emotional decisions, is paramount.
- Fear of missing out (FOMO) can often lead to impulsive entries, whereas greed can hinder taking profits when you should.
- Patience is essential. Waiting for confirming signals and high-probability setups, rather than chasing every trade, is key for long-term success.
- Keeping a trading journal is invaluable. It enables you to monitor performance, pinpoint weaknesses, and develop a disciplined trading approach.
Calculating Risk-Reward for Different Zone Setups
Risk-reward calculations assess potential profit relative to potential loss for each trade. A favorable risk-reward ratio is typically 1:2 or greater, signifying a potential profit at least double the potential loss. Different zone setups and market conditions may necessitate adjustments to these calculations. For example, a volatile market could warrant a higher risk-reward target.
By carefully considering these factors—position sizing, stop placement, scaling strategies, psychological influences, and risk-reward calculations—traders can effectively protect their capital while maximizing profit potential within supply and demand zone trading. This measured approach allows you to navigate the markets confidently, preserving your capital for future trading opportunities.
Supercharging Results: Zones Plus Strategic Indicators
The right indicators, paired with supply and demand zone trading, can significantly boost your trading performance. However, using too many technical tools can create unnecessary complexity and hinder your analysis. This section explores effective indicators that genuinely complement zone trading.
Moving Averages: Confirming Zone Strength
Moving averages offer a robust way to validate supply and demand zones. A 200-period moving average, for instance, can function as a substantial support or resistance level. When a demand zone aligns with this moving average, it strengthens the zone's potential as a buying opportunity, increasing the likelihood of a price bounce.
Conversely, a supply zone coinciding with the 200-period moving average reinforces its potential for a downward price reversal. This convergence offers further confirmation for short selling opportunities. Using moving averages this way helps filter weaker setups, letting you focus on higher-probability trades.
Volume Analysis: Validating Zone Significance
Volume analysis is essential for confirming the robustness of supply and demand zones. High volume during a zone's initial formation signals strong conviction among institutional traders. This suggests real buying or selling pressure, making the zone more reliable.
High volume in a newly formed demand zone, for example, suggests significant institutional accumulation, reinforcing the zone as a strong support area. Similarly, high volume accompanying a supply zone's creation points to substantial distribution, increasing the likelihood of future price declines. Volume analysis adds another layer of validation to your zone trading strategy.
Momentum Indicators: Fine-Tuning Entries and Exits
Momentum indicators like the Relative Strength Index (RSI) or the Stochastic Oscillator help refine entry and exit points within zones. These indicators track the speed and magnitude of price changes.
For example, a price entering a demand zone coupled with an oversold RSI signal could indicate a buying opportunity. Conversely, a price reaching a supply zone with an overbought RSI might be a good time to consider shorting. These momentum signals add precision to your entries and exits.
Integrating Market Structure Analysis
Many successful traders combine market structure analysis with supply and demand zone identification for a more comprehensive market understanding.
Market structure analysis involves identifying higher highs and higher lows in uptrends, and lower highs and lower lows in downtrends. Integrating this with zone trading helps predict whether a zone will hold or break. A demand zone within a strong uptrend is more likely to hold than one within a downtrend.
Building a Streamlined System
The key is to create a streamlined system where each indicator plays a specific role in validating high-probability setups. Avoid indicator overload, as too many indicators can generate conflicting signals, leading to confusion.
Focusing on a few reliable indicators that complement your supply and demand zone trading creates a more efficient and less cluttered approach. This focused method allows for confident identification and execution of profitable trades.
Ready to upgrade your trading? ChartsWatcher, sophisticated stock market scanning software, helps professional traders track and analyze market activity. Explore customized dashboards, real-time data, and advanced features designed to provide a trading edge. Discover ChartsWatcher today!
