Master Reversal Chart Patterns for Profitable Trades
Spotting the Shift: Essential Reversal Chart Patterns
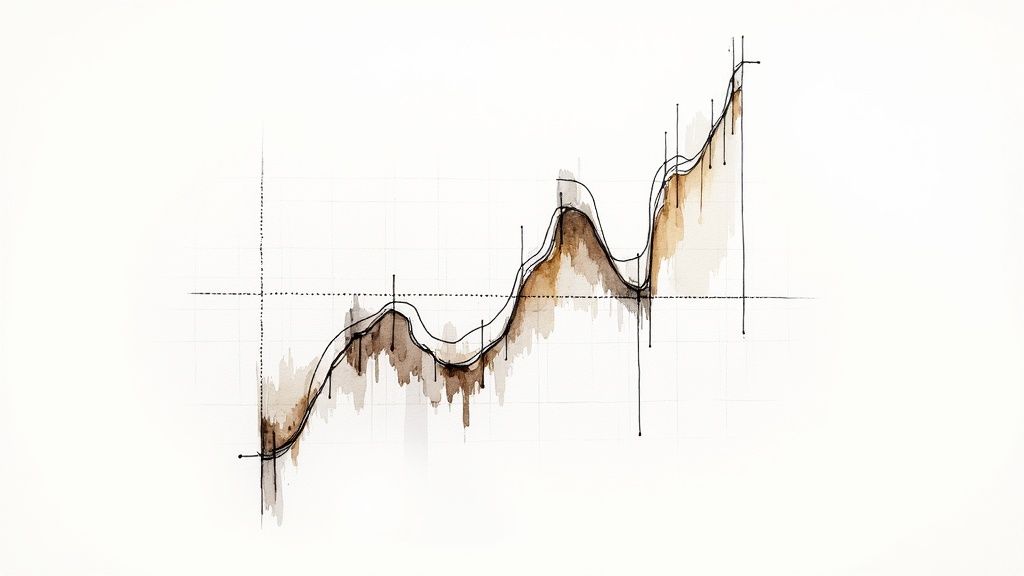
In the financial markets, the ability to predict when a trend will reverse is crucial for success. Whether you're a professional trader, a market analyst at a financial institution, or an independent investor, recognizing the signs of a shift in momentum can mean the difference between profit and loss. These signs often appear as reversal chart patterns, formations that have guided traders for generations. From the classic Head and Shoulders pattern, used as far back as 17th-century Japanese rice traders, to more modern patterns identified through technical analysis, understanding these formations provides a vital advantage. Their effectiveness lies in how they visually represent the changing dynamics of supply and demand, offering a glimpse into market psychology.
This article explores eight essential reversal chart patterns every trader should know. Mastering these visual cues will improve your ability to pinpoint potential turning points in price action. You'll be able to confirm trend reversals with more confidence, leading to better-informed trading decisions – regardless of whether you're using a stock scanner, a sophisticated stock screener, or implementing day trading strategies. Get ready to sharpen your technical analysis skills and discover how these powerful patterns can significantly enhance your trading performance.
1. Head and Shoulders
The Head and Shoulders pattern is a fundamental concept in technical analysis. It's widely recognized as one of the most dependable reversal patterns. Its characteristic shape, mirroring its name, alerts traders to a potential shift from a bullish trend to a bearish one. This pattern is noteworthy due to its high reliability (when identified correctly), clear entry and exit points, and measurable price targets.
This pattern is composed of three distinct peaks: two shoulders (roughly equal in height) surrounding a taller central peak (the "head"). The "neckline" is formed by connecting the lows between these peaks. A significant break below this neckline confirms the pattern and indicates a bearish reversal.
Key Features
- Three peaks: left shoulder, head, right shoulder
- Head is the highest peak
- Shoulders are approximately equal in height
- Neckline connects the lows
- Declining volume during right shoulder formation
- Break below the neckline confirms the pattern
Pros and Cons
Pros:
- High reliability when fully formed
- Clear entry and exit points
- Measurable price target (head to neckline distance projected downward)
- Easily identified, even for beginners
Cons:
- Can take a long time to form (weeks or months)
- Risk of false breakouts below the neckline
- Requires volume confirmation for accuracy
- May not always reach the projected target
Real-World Examples
Several significant market events have been preceded by Head and Shoulders patterns:
- S&P 500 (March 2008): A Head and Shoulders pattern appeared before the market crash.
- Bitcoin (December 2017 - June 2018): A large Head and Shoulders pattern signaled a major correction.
- General Electric (GE) (2017-2018): The stock displayed this pattern before a substantial decline.
Practical Tips
- Confirmation Is Crucial: Wait for a confirmed break below the neckline before entering a short position. Look for increased volume with the breakout for added confirmation.
- Price Targets: The potential price target is estimated by projecting the distance from the head to the neckline downwards from the neckline breakout.
- Stop-Loss Orders: Place stop-loss orders above the right shoulder to minimize potential losses if the pattern doesn't follow through.
- False Breakdowns: Be careful in volatile markets, as false breakdowns can happen. Volume analysis is key to differentiating genuine breakouts from false signals.
- Further Reading: You might find this article helpful: 8 Day Trading Chart Patterns Every Trader Should Know
Historical Context
The Head and Shoulders pattern was first brought to prominence by Edwards and Magee in their 1948 book, "Technical Analysis of Stock Trends." Thomas Bulkowski's later statistical research further validated the pattern's reliability and offered helpful insights into its characteristics.
The Head and Shoulders pattern, because of its clear structure and predictive potential, continues to be a valuable tool for traders in various markets and timeframes. Understanding its subtleties and using these tips can significantly improve a trader's ability to spot potential trend reversals and profit from market opportunities.
2. Double Top and Double Bottom
Double Top and Double Bottom patterns are among the most readily identifiable reversal patterns used in technical analysis. Their clear visual structure and relatively straightforward confirmation signals make them popular with traders of all experience levels. These patterns suggest a possible shift in market sentiment, offering potentially valuable insights into future price action. Because of their frequency, reliability, and profit potential, they are key reversal patterns to understand.
Understanding the Patterns
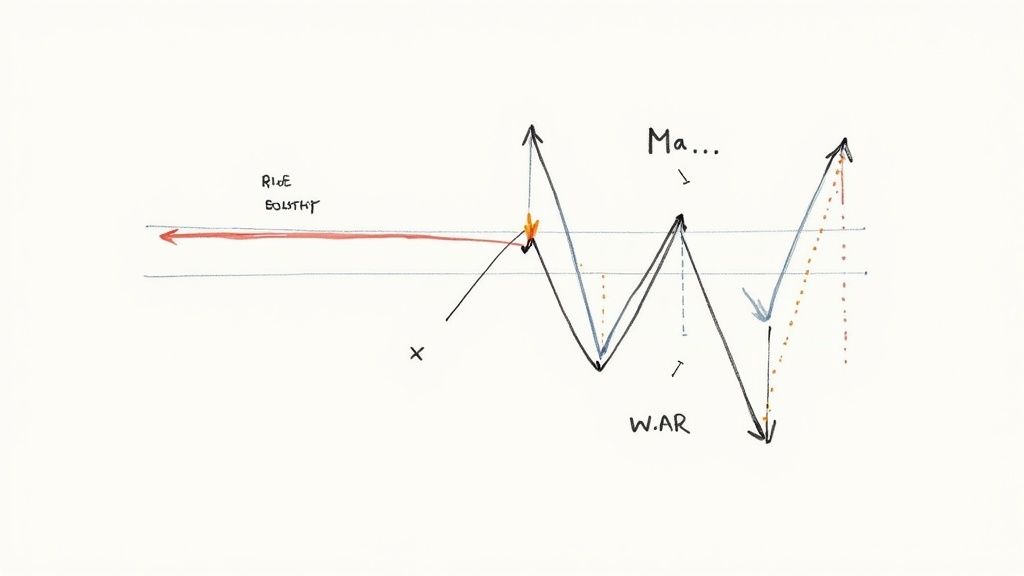
A Double Top suggests a potential bearish reversal. It occurs after a sustained upward trend when the price hits a high point twice, unable to break through this resistance on the second attempt. The two peaks are roughly equal, with a moderate dip between them, looking like the letter 'M'.
A Double Bottom, on the other hand, signals a potential bullish reversal. It appears after a downward trend, where the price hits a low point twice, failing to break below this support level on the second try. The two lows are roughly equal, with a moderate rise between them, resembling a 'W' shape.
Key Features
- Two Peaks/Troughs: These patterns both feature two roughly equal peaks (Double Top) or valleys (Double Bottom).
- Intermediate Decline/Rally: A noticeable price drop separates the two peaks of a Double Top, while a noticeable price increase separates the two troughs of a Double Bottom.
- Neckline: A crucial element is the neckline (horizontal support for Double Top, resistance for Double Bottom), a line drawn connecting the intermediate low between the peaks or the intermediate high between the troughs.
- Confirmation: The pattern is confirmed when the price decisively breaks through the neckline, often accompanied by increased trading volume.
- Volume: Volume often decreases on the second peak of a Double Top and increases during the neckline breakout. Conversely, volume might be higher on the second trough of a Double Bottom, increasing further on the breakout.
Pros
- Easy Identification: Their distinct shapes make them relatively easy to identify on price charts.
- Clear Entry/Exit Points: Neckline breaks offer clear entry points, while the pattern's height can be used to estimate price targets.
- Frequency: These patterns occur relatively frequently compared to more complex reversal patterns.
- Timeframe Versatility: They can appear on any timeframe, from short-term intraday charts to long-term monthly charts.
Cons
- False Breakouts: Not every neckline break results in a substantial price move. False breakouts can happen, potentially leading to losses.
- Time to Completion: Formation and confirmation can take time, requiring patience from traders.
- Reliability: While generally reliable, Double Tops and Bottoms are not always as strong as Head and Shoulders patterns.
Real-World Examples
- Gold (2011-2012): Gold formed a Double Top during this period, potentially signaling the end of a multi-year bull run.
- Apple (AAPL) (early 2019): Apple stock exhibited a Double Bottom before a strong rally.
- EUR/USD (early 2018): The EUR/USD currency pair potentially showed a Double Top before a significant decline.
Practical Tips for Implementation
- Confirmation is Key: Wait for a confirmed neckline break before entering a trade.
- Volume as Validation: Increased volume during a breakout reinforces the signal's validity.
- Price Targets: The distance between the peaks/troughs and the neckline, projected from the breakout, can estimate potential price targets.
- Stop-Loss Placement: Placing stop-loss orders just beyond the second peak (Double Top) or trough (Double Bottom) can help manage risk.
- Rounded Variations: Be mindful of rounded tops and bottoms, variations of these patterns with potentially different implications.
Historical Context
Double Top and Double Bottom patterns have long been recognized in technical analysis, with their origins tracing back to early market theorists like Charles Dow and William Hamilton. John Murphy’s book “Technical Analysis of the Financial Markets” further popularized these patterns, and Steve Nison emphasized their relevance in both Western and Japanese candlestick charting.
By understanding these patterns, traders can improve their ability to anticipate market reversals and make more informed decisions. When combined with other technical indicators and sound risk management, Double Top and Double Bottom patterns can be valuable tools for identifying trading opportunities.
3. Triple Top and Triple Bottom
Triple Top and Triple Bottom formations are powerful reversal patterns in technical analysis. They earn a spot on this list because of their strong predictive capabilities and clear entry/exit signals. Essentially an amplified version of the Double Top and Bottom, these patterns signal even stronger potential reversals, making them valuable tools for traders in various markets.
These patterns emerge when an asset's price tests a support or resistance level three times, failing to break through each time. A Triple Top consists of three peaks at roughly the same price level, indicating robust resistance and a potential bearish reversal. A Triple Bottom, on the other hand, features three troughs at approximately the same price, suggesting strong support and a possible bullish reversal.
Key Features
-
Three Peaks/Troughs: The core characteristic is the presence of three roughly equal highs (Triple Top) or lows (Triple Bottom).
-
Horizontal Support/Resistance: A clear horizontal line connects the intervening lows (Triple Top) or highs (Triple Bottom) between the extremes. This line represents the crucial support or resistance level.
-
Moderate Price Swings: Price movements between the peaks or troughs are typically moderate, showing a sideways consolidation pattern.
-
Volume Confirmation: Volume typically decreases during the pattern's formation and increases significantly on the breakout, confirming the reversal.
Pros
-
Strong Reversal Signal: Compared to Double Top/Bottom patterns, these offer a more reliable signal due to the repeated testing of the support/resistance level.
-
Clear Entry/Exit Points: The breakout beyond the support/resistance level provides well-defined entry and exit points.
-
Measurable Price Targets: The pattern's height (distance between the support/resistance and the peaks/troughs) can be projected from the breakout point to estimate price targets.
-
Higher Reliability: The three failed attempts to break through a key level highlight the significance of the support/resistance, strengthening the pattern's reliability.
Cons
-
Relative Rarity: Triple Tops and Bottoms appear less frequently than Double Tops and Bottoms.
-
Longer Formation Time: These patterns can require weeks or even months to fully develop.
-
Potential for Evolution: Extended sideways price action may lead to the formation of more complex patterns, making identification difficult.
-
Confusion with Other Patterns: Distinguishing Triple Tops/Bottoms from consolidation or rectangle patterns can be tricky.
Real-World Examples
-
S&P 500 (2011): A significant Triple Bottom formation in the S&P 500 preceded a multi-year bull market.
-
Crude Oil (2013): A Triple Top pattern in crude oil signaled a considerable price drop.
-
IBM (2016): A Triple Bottom in IBM’s stock price came before a rally of nearly 30%.
Practical Tips for Implementation
-
Patience is Key: Wait for the pattern to fully form before acting.
-
Volume Confirmation: Enter trades only after a clear breakout with increased volume.
-
Price Targets: Determine potential price targets by projecting the pattern's height from the breakout point.
-
Stop-Loss Orders: Use stop-loss orders just beyond the last peak (Triple Top) or trough (Triple Bottom) to minimize potential losses.
-
Consider Broader Market Trends: Analyze the overall market and its trends for a more accurate interpretation.
Historical Context and Popularization
The principles behind Triple Tops and Bottoms have long been recognized in technical analysis. Ralph Nelson Elliott incorporated these patterns into his Elliott Wave Theory. Technical analysts like Martin Pring and Thomas Bulkowski further refined and popularized the concepts through their research and writing. Bulkowski’s statistical analysis of these patterns has been particularly influential in their understanding and application in trading. These patterns continue to be relevant tools for professional traders, analysts, and individual investors seeking to identify potential market reversals.
4. Rounding Bottom (Saucer)
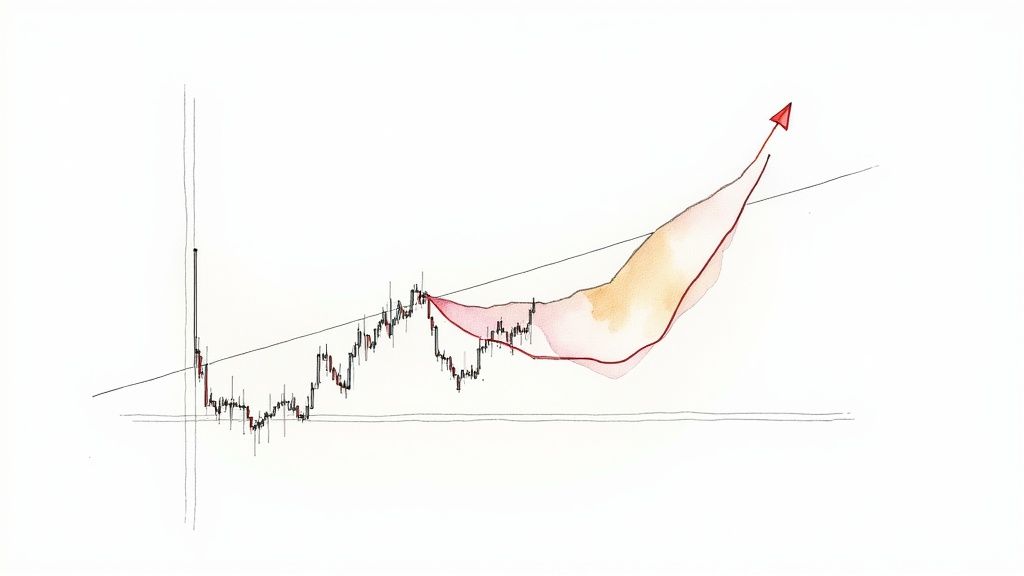
The Rounding Bottom, also known as a Saucer pattern, is a reliable long-term reversal signal in technical analysis. It indicates a gradual shift from bearish to bullish sentiment, forming a "U" shape on price charts. This pattern develops slowly, showing a change in market dynamics as selling pressure decreases and buying interest rises. It often takes several months to a year to form, making it more common on weekly and monthly charts. This longer timeframe highlights its importance for long-term investors and swing traders.
Key Features and Benefits
-
Gradual Transition: Unlike sharp V-shaped reversals, the smooth, U-shaped curve of the Rounding Bottom signals a more gradual transition. This gives traders valuable insight into changing market sentiment.
-
Symmetrical Structure: The time it takes for the price to descend and then ascend is generally equal, adding to the pattern's reliability.
-
Volume Confirmation: Volume typically decreases as the price reaches its lowest point, showing weakening selling pressure. As the price rises, increasing volume confirms renewed buying interest.
-
Clear Entry Point: The pattern is complete when the price breaks above the resistance line formed by the left side of the "U." This breakout provides a well-defined entry point.
-
Strong Support: The bottom of the "U" often acts as a strong support level, potentially limiting downside risk.
Pros and Cons of the Rounding Bottom
Here’s a quick overview of the advantages and disadvantages of using the Rounding Bottom pattern:
| Feature | Advantage | Disadvantage |
|---|---|---|
| Reliability | High success rate predicting trend reversals | Long formation period (3-6+ months) |
| Signal Clarity | Clear shift in market sentiment | Difficult to identify until nearing completion |
| Entry Point | Well-defined entry point | Less precise price targets than some patterns |
Real-World Examples and Practical Tips
Several well-known assets have exhibited Rounding Bottom patterns:
- Gold (1999-2002): Gold formed a significant Rounding Bottom before a multi-year bull run.
- Apple (AAPL) (2013): Apple stock displayed this pattern before its price continued upward.
- S&P 500 (2009): The S&P 500 formed a Rounding Bottom after the 2008 financial crisis, marking the start of a substantial bull market.
To effectively use the Rounding Bottom, consider these tips:
- Volume Analysis: Watch for decreasing volume during the bottom formation and increasing volume as the price rises.
- Confirmation Breakout: Wait for a decisive price breakout above the resistance line before entering a trade.
- Target Setting: Use the depth of the "saucer" or other technical indicators, such as Fibonacci retracements, to estimate potential price targets.
- Chart Timeframe: Analyze weekly and monthly charts for more reliable pattern identification.
Historical Context and Conclusion
Technical analysis pioneers like Arthur Merrill, John Murphy, and Richard Schabacker have highlighted the Rounding Bottom, establishing it as a fundamental pattern for market analysis. Their work emphasizes its role in understanding long-term market trends.
The Rounding Bottom's inclusion in any technical analysis toolkit is justified by its reliability. Though it takes time to form, it provides valuable insight into shifting market sentiment, offers clear entry points, and often predicts significant price appreciation. The Rounding Bottom remains a vital tool for traders and investors seeking long-term profitable opportunities.
5. Rising and Falling Wedge
The Rising and Falling Wedge patterns are key reversal chart patterns. Their predictive abilities and clear identification features give traders valuable clues about potential trend changes. This allows for strategic market entries and exits. These patterns are formed by converging trendlines, creating a wedge shape that contains price movements within a narrowing range. Grasping the subtleties of these patterns can significantly improve a trader's ability to anticipate market direction.
A Falling Wedge, appearing during a downtrend, suggests a potential bullish reversal. In this case, both trendlines of the wedge slope downwards, converging as the price consolidates. A Rising Wedge, on the other hand, appears during an uptrend and hints at a possible bearish reversal. Here, both trendlines angle upwards as they converge. The key reversal signal is generated when the price decisively breaks through the trendline opposite to the current trend. For instance, a breakout above the upper trendline in a Falling Wedge confirms a bullish reversal.
Several key features distinguish wedge patterns:
- Converging Trendlines: The defining characteristic of these patterns is the distinctive wedge shape created by the converging trendlines.
- Slope Direction: Falling Wedges have downward-sloping trendlines, while Rising Wedges show upward-sloping ones.
- Decreasing Volume: Typically, as the pattern develops and the price moves towards the point of the wedge, trading volume decreases.
- Breakout Point: The breakout frequently happens before the wedge fully converges, adding to the pattern's predictive power.
These characteristics provide traders with distinct advantages:
Pros of Using Wedge Patterns
- Clear Entry Points: Trendline breakouts offer clear entry points.
- Favorable Risk-Reward: The well-defined breakout point and stop-loss placement (just beyond the opposite trendline) allow for good risk-reward setups.
- Multi-Timeframe Applicability: Wedges appear on various timeframes, from intraday to monthly charts, accommodating different trading styles.
- Significant Reversals: Well-formed wedges often signal substantial trend reversals.
- Volume Confirmation: Checking volume during the breakout confirms the pattern's strength.
Cons of Using Wedge Patterns
- Pattern Confusion: Wedges can sometimes be confused with triangles or other consolidation patterns.
- False Breakouts: Market volatility can cause false breakouts, leading to poorly timed entries or exits.
- Continuation Potential: Though primarily reversal patterns, wedges can occasionally signal trend continuation, especially with low volume on the breakout and no momentum divergence.
- Trendline Precision: Drawing trendlines accurately requires practice and can be somewhat subjective.
Real-World Examples of Wedge Patterns
- The S&P 500 formed a Rising Wedge before the market correction in February 2020.
- Bitcoin displayed a Falling Wedge in early 2019 before a major price increase.
- Tesla (TSLA) formed a Rising Wedge in late 2021 before a price decline.
Practical Tips for Using Wedge Patterns
- Volume Confirmation: Watch for rising volume accompanying the breakout to confirm the reversal signal.
- Candle Closure: Wait for a candle to close beyond the trendline before entering a trade.
- Price Targets: Determine potential price targets by measuring the height of the wedge at its widest point, starting from the breakout point.
- Stop-Loss Placement: Place stop-loss orders just beyond the opposite trendline.
- Momentum Divergence: Divergence in momentum indicators, such as RSI or MACD, can strengthen the reversal signal.
- Broader Trend Consideration: Keep in mind that wedges can sometimes act as continuation patterns, so consider the overall market trend.
The Rising and Falling Wedge patterns were highlighted by technical analysis pioneers Edwards and Magee in their book "Technical Analysis of Stock Trends." Thomas Bulkowski’s statistical research further validated the patterns' effectiveness, and Alexander Elder incorporated them into his trading psychology strategies.
You might be interested in: Our guide on Effective Stock Market Pattern Recognition for Traders for a deeper dive into chart pattern analysis.
By understanding how to identify and interpret Rising and Falling Wedges, traders can improve their ability to anticipate market reversals and refine their trading approaches.
6. Island Reversal
The Island Reversal is a compelling chart pattern that signals a potential trend reversal. It has a distinct visual appearance, resembling a "price island." This island is a cluster of trading activity separated from the main price trend by gaps on both sides. This isolation indicates a sudden shift in market sentiment. It can often mark significant turning points. The pattern’s rarity and clear visual cues make it a valuable tool for traders.
How does this pattern form? Price gaps in the direction of the prevailing trend, consolidates in a narrow range (the island), and then gaps in the opposite direction. This leaves the prior trading range isolated. The sequence suggests a sudden surge followed by an abrupt rejection, trapping traders who entered during the initial gap. The island can form over a single day or span several days or even weeks.
Features of an Island Reversal
Here's a breakdown of the key characteristics:
- Distinct Gaps: Gaps on both sides of the pattern are the defining feature.
- Isolated Trading: The “island” represents a period of indecision or trapped traders.
- Variable Duration: The pattern can form in a single day or extend over weeks.
- Volume Confirmation: Increased volume during the reversal gap strengthens the signal.
- Timeframe Significance: The pattern is more reliable on daily and weekly charts.
Pros and Cons of Using the Island Reversal
Like any trading pattern, the Island Reversal has its advantages and disadvantages.
Pros:
- Clear Reversal Signal: A well-formed pattern provides a strong indication of a trend change.
- Precise Entry Points: The second gap offers a clear entry point.
- Easy Identification: The distinctive visual appearance makes it easily identifiable.
- Exhaustion Signal: Often signifies the exhaustion of the previous trend.
Cons:
- Rarity: It occurs less frequently than other reversal patterns.
- Gap Fills: Gaps can be filled, invalidating the pattern.
- Market Dependency: Less reliable in markets with frequent gaps, like the forex market.
- Pattern Confusion: It can be mistaken for other gap patterns.
Real-World Examples
Several well-known assets have exhibited Island Reversals:
- Amazon (AMZN): Formed a bearish Island Reversal top in July 2018 before a significant price correction.
- S&P 500: Showed an Island Reversal in June 2020 preceding a short-term pullback.
- Crude Oil Futures: Formed a bullish Island Reversal in April 2020 after a dramatic price collapse.
Tips for Implementation
Here are some practical tips for using the Island Reversal:
- Confirmation: Wait for confirmation that the second gap isn’t filled before entering a trade.
- Volume Analysis: Look for increased volume during the reversal gap for stronger confirmation.
- Stop-Loss Placement: Set stop-losses beyond the island’s high (for bearish reversals) or low (for bullish reversals).
- Holistic Approach: Use the Island Reversal alongside other technical indicators and market analysis.
- Gap Size: Larger gaps generally indicate a more reliable signal.
Historical Context and Popularization
The Island Reversal gained recognition through the work of prominent technical analysts like Joseph Granville, who highlighted its significance in his books. Steven Nison discussed its relationship with Japanese candlestick patterns, further solidifying its place in charting analysis. Victor Sperandeo also integrated the pattern into his trading strategies, contributing to its wider adoption.
The Island Reversal is a valuable pattern for traders due to its visual nature, clear reversal signals, and potential for profit. While its rarity requires patience, the potential rewards for identifying a valid Island Reversal make it a useful tool across various markets and timeframes.
7. V-Bottoms and Inverted V-Tops
V-Bottoms and Inverted V-Tops (also known as Spikes) are dramatic reversal patterns in trading. They capture swift price action, resembling a "V" or inverted "V" on a chart. Their abrupt nature presents both exciting opportunities and serious challenges for traders. These patterns are important because they can signal major trend changes, creating substantial trading opportunities, despite the inherent risks.
A V-Bottom forms when prices fall sharply and then reverse direction with equal force. This often represents a capitulation point, where panic selling peaks. This exhaustion of sellers can then trigger a strong upward rally. Conversely, an Inverted V-Top appears when prices surge rapidly and then reverse downward just as abruptly. This often signals extreme euphoria or a speculative bubble. Buyers flood the market, only to see a sharp decline as buying pressure disappears.
Features of V-Bottoms and Inverted V-Tops
-
Sharp, Dramatic Price Movements: The hallmark of these patterns is the rapid and significant price change in both directions.
-
Little to No Consolidation: Unlike other reversal patterns, V formations show minimal consolidation at the turning point.
-
High Volume: The reversal point often sees exceptionally high trading volume, reflecting intense buying or selling pressure.
-
Occurrence: These patterns frequently appear during market stress, major news events, or speculative frenzies.
-
Timeframes: While they can appear on any timeframe, their importance increases on daily and weekly charts.
-
Speed of Formation: V patterns typically develop much faster than other reversal formations.
Pros of Trading V-Bottoms and Inverted V-Tops
-
Clear Signal: They provide a fast, decisive signal of a potential market direction change.
-
Substantial Moves: Correctly identifying these patterns can lead to significant profits due to the sharp price swings.
-
Capitulation/Euphoria Points: They often pinpoint market extremes where sellers or buyers are exhausted.
-
Easy Visual Identification: The distinct "V" shape makes them easy to spot.
Cons of Trading V-Bottoms and Inverted V-Tops
-
Difficult Real-Time Trading: Their sudden formation makes timely entry and exit challenging.
-
Risk of Early Entry: Entering a trade prematurely, before confirmation, can lead to losses.
-
Lack of Defined Support/Resistance: V formations don't offer clear support or resistance levels.
-
High Volatility: Extreme price fluctuations require careful position sizing.
-
Potential Retests: The extreme point of the "V" can be retested before a new trend is firmly established.
Real-World Examples
-
S&P 500 (March 2020): A V-Bottom formed during the COVID-19 panic, marking a significant market low.
-
GameStop (GME) (January 2021): An Inverted V-Top occurred during the short squeeze, highlighting the risks of speculative bubbles.
-
Bitcoin (March 2020): A V-Bottom appeared before a substantial bull run.
Tips for Implementation
-
Confirmation: Use momentum indicators like the Relative Strength Index (RSI) or Moving Average Convergence Divergence (MACD), or candlestick patterns to confirm the reversal.
-
Volume Analysis: Look for high volume at the turning point.
-
Scaled Entry: Scale into positions to manage risk.
-
Wider Stop-Losses: Use wider stop-loss orders to account for volatility.
-
Retest Awareness: Be prepared for potential retests of the extreme point.
-
Sentiment Indicators: Consider using sentiment indicators to gauge extreme fear (V-Bottom) or greed (V-Top).
Historical Context
Notable figures like Victor Sperandeo, Martin Pring, and Stan Weinstein have included V-Bottoms and Inverted V-Tops in their trading methodologies and technical analysis frameworks.
By understanding the characteristics, pros, and cons of V-Bottoms and Inverted V-Tops, traders can use these patterns to identify potential trend reversals and capitalize on the substantial price movements that often follow. However, caution and proper risk management are essential due to the inherent volatility and the difficulty in timing entries and exits.
8. Bullish and Bearish Engulfing Patterns
Engulfing patterns are a cornerstone of candlestick analysis, providing traders with strong visual cues for potential trend reversals. Their simplicity and relatively high frequency make them popular among both new and seasoned traders. These two-candle patterns signal a significant shift in market sentiment, offering compelling entry and exit points.
How They Work
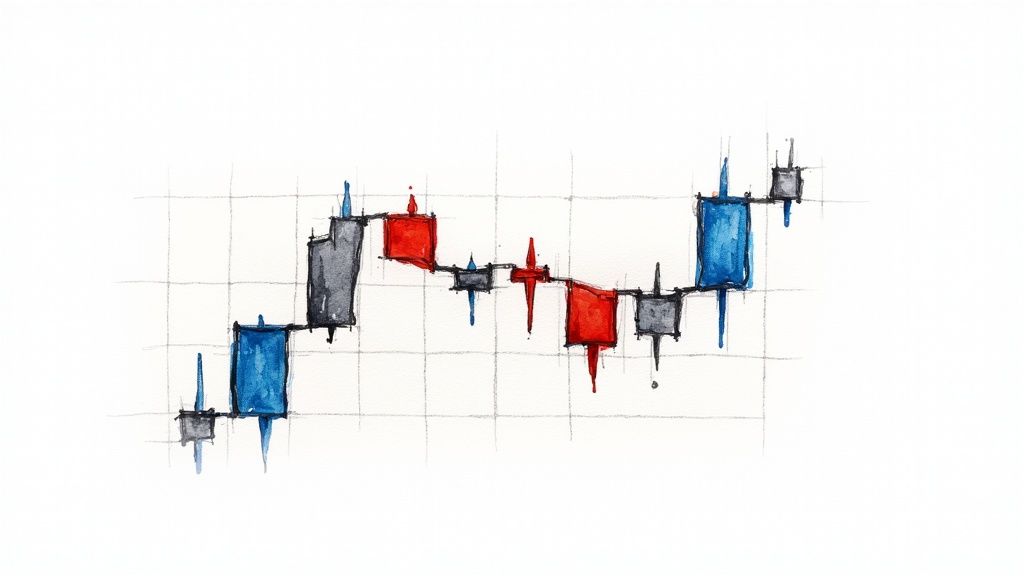
Engulfing patterns depend on the relationship between two consecutive candlesticks. The pattern is defined by the second candle completely "engulfing" the real body of the first. Importantly, the engulfing candle must be the opposite color of the preceding candle.
-
Bullish Engulfing: Appears during a downtrend. A large bullish (white/green) candle completely engulfs the preceding bearish (black/red) candle's body. This signals potential buying pressure overcoming selling pressure, suggesting an upward reversal.
-
Bearish Engulfing: Appears during an uptrend. A large bearish (black/red) candle completely engulfs the preceding bullish (white/green) candle's body. This suggests sellers have taken control from buyers, indicating a possible downward reversal.
Features and Benefits
- Clear Visual Signal: The engulfing pattern provides an easily identifiable signal of a potential reversal.
- Quick Formation: Forming within just two candlesticks, engulfing patterns offer quicker signals than many other reversal patterns.
- Timeframe Versatility: Engulfing patterns are effective across various timeframes, from minute charts for day traders to monthly charts for long-term investors.
- Frequent Occurrence: They offer many trading opportunities.
- Precise Entry/Stop-Loss: The high/low of the engulfing candle helps define entry and stop-loss levels.
Pros and Cons
| Pros | Cons |
|---|---|
| Clear visual reversal signal | Can produce false signals, especially in ranging markets |
| Quick formation (two candles) | Requires confirmation from subsequent price action or indicators |
| Works across multiple timeframes | Less reliable in highly volatile markets |
| Relatively frequent occurrence | Context (support/resistance, trend duration) improves reliability |
| Easy identification | No inherent price target |
Real-World Examples
- Apple (AAPL): A Bullish Engulfing pattern at a support level in March 2021 preceded a significant price increase.
- S&P 500: A Bearish Engulfing pattern in early January 2022 foreshadowed a market correction.
- EUR/USD: This currency pair frequently shows engulfing patterns at crucial support/resistance levels.
- Gold: A Bullish Engulfing in March 2020 marked the beginning of a major upward trend.
Tips for Implementation
- Look for engulfing patterns after extended trends.
- Confirm with increased volume on the engulfing candle.
- Wait for the engulfing candle to close before entering a trade.
- Place stop-losses beyond the engulfing candle's high/low.
- Use confirming indicators like RSI or MACD.
- Prioritize patterns at key support/resistance.
- Larger engulfing candles are generally more reliable.
Historical Context and Popularity
Used for centuries by Japanese rice traders, engulfing patterns gained wider recognition through the work of Steve Nison, who introduced candlestick charting to Western audiences. Further analysis by Thomas Bulkowski validated the pattern's effectiveness.
Why It's Important
The Engulfing pattern’s combination of clear visuals, quick formation, and applicability across various markets and timeframes make it a valuable tool for traders of all experience levels. Its ability to pinpoint potential turning points in price action secures its place as an essential reversal chart pattern. By understanding this pattern and combining it with other technical analysis tools, traders can improve their ability to identify profitable trading opportunities.
8-Point Reversal Chart Pattern Comparison
| Chart Pattern | Implementation Complexity (🔄) | Resource Requirements (⚡) | Expected Outcomes (📊) | Ideal Use Cases (💡) | Key Advantages (⭐) |
|---|---|---|---|---|---|
| Head and Shoulders | Medium – requires pattern confirmation and volume analysis | Moderate – relies on drawing trendlines and assessing volume trends | Clear bearish reversal with measurable targets | Mid- to long-term trend reversals | Highly reliable with precise entry/exit guidance |
| Double Top and Double Bottom | Low-Medium – easily identified though confirmation is needed | Low – basic price action and chart reading | Reversal signals with definable price targets | Various timeframes; common reversal setups | Simplicity and frequent occurrence in trending markets |
| Triple Top and Triple Bottom | Medium – extended formation needing multiple confirmations | Moderate – demands detailed chart analysis with volume verification | Strong reversal indication after repeated tests of resistance/support | Longer-term charts with established trends | Higher reliability due to three tests of support/resistance |
| Rounding Bottom (Saucer) | High – gradual and long-term formation, tough to pinpoint early | High – requires long-term charts and careful trend confirmation | Complete and steady bullish reversal | Long-term market shifts on weekly/monthly frames | Offers strong reversal signals with robust support levels |
| Rising and Falling Wedge | Medium – precise drawing of converging trendlines is needed | Moderate – necessitates technical tools to accurately plot trendlines | Well-defined reversal with clear breakout points | Versatile use across various timeframes in volatile markets | Clear risk-reward setups with defined stop-loss opportunities |
| Island Reversal | Medium-High – requires distinct gap identification and isolation | Moderate – involves gap analysis and volume confirmation | Sharp reversal signal with isolated, precise entry points | Identifying exhaustion at market tops/bottoms | Provides clear, standout signals due to isolated price blocks |
| V-Bottoms and Inverted V-Tops | High – rapid formation demands swift recognition and confirmation | High – demands real-time monitoring to catch abrupt price movements | Sudden, decisive reversals in volatile conditions | High-volatility events and market stress periods | Marks extreme turning points effectively with strong momentum shifts |
| Bullish and Bearish Engulfing Patterns | Low – simple two-candle formation easily spotted | Low – minimal tools required; relies on candlestick visualization | Quick reversal indications with rapid signal formation | Suitable for any timeframe, especially intraday trading | Immediate and clear reversal signals that are easy to interpret |
Mastering Reversal Chart Patterns: A Path to Trading Success
Understanding and applying reversal chart patterns can significantly improve your trading performance. These patterns, such as the Head and Shoulders, Double and Triple Tops and Bottoms, Rounding Bottom, Rising and Falling Wedges, Island Reversals, V-Bottoms and Inverted V-Tops, and Bullish and Bearish Engulfing patterns, offer valuable clues about potential shifts in market sentiment. They can signal upcoming trend reversals, offering opportunities for astute traders.
However, it's important to remember that chart patterns are not perfect predictors. They are tools to be used in conjunction with other forms of technical analysis and fundamental research. Think of them as pieces of a larger puzzle, contributing to a more comprehensive market view.
Effectively Using Reversal Chart Patterns
To effectively use reversal chart patterns, consider the following:
- Confirmation: Look for confirming signals from volume and momentum indicators, as well as other technical indicators like Moving Averages or Relative Strength Index (RSI), before acting on a pattern. This helps validate the potential reversal.
- Context: Analyze the patterns within the broader market context. Consider the overall market trend and the specific security's historical performance. Understanding the bigger picture helps interpret the pattern's significance.
- Risk Management: Implement appropriate risk management strategies, including stop-loss orders, to protect your capital. This is crucial for preserving your trading account and weathering market volatility.
Continuous learning and adaptation are essential for success in trading. Regularly review your trades, analyzing both your successes and failures. This allows you to refine your understanding of these patterns and improve your decision-making process.
Stay informed about ongoing market trends and future developments in technical analysis. The financial landscape is constantly evolving, so staying current is vital.
Key Takeaways
- Reversal chart patterns provide valuable insights into potential market turning points. They can help you anticipate shifts in market direction.
- Combine pattern recognition with other technical analysis tools for more accurate predictions. A multi-faceted approach strengthens your analysis.
- No pattern is foolproof; careful analysis and risk management are crucial. Protecting your capital is paramount in trading.
- Continuous learning and adaptation are essential for long-term trading success. The markets are dynamic, requiring ongoing learning.
Are you ready to improve your trading analysis and identify potential reversals? ChartsWatcher, a stock market scanning software, empowers you to efficiently track and analyze market movements. Customize dashboards, set alerts, backtest strategies, and gain a comprehensive view of the market. From customizable watchlists to real-time data and advanced charting capabilities, ChartsWatcher offers the tools you need to make informed trading decisions. Explore ChartsWatcher today and discover the plan that best suits your needs, from the free basic package to the comprehensive Pro Plan.
