Linear vs Log Scale In Technical Analysis
Picking between a linear or log scale is one of those fundamental choices every trader has to make. It directly shapes how you see price action, and getting it right can make trends pop, while getting it wrong can give you a completely warped view of an asset's journey.
The decision really boils down to one question: Are you interested in absolute dollar moves or relative percentage growth?
Understanding The Core Differences
At its heart, the difference is in how the Y-axis (the price axis) is constructed. A linear scale gives equal vertical space to equal price changes. The distance between $10 and $20 is the exact same as the distance between $110 and $120. It’s all about the raw dollar amount.
A logarithmic scale, on the other hand, gives equal space to equal percentage changes. On a log chart, the distance between $10 and $20 (a 100% gain) is the same as the distance between $50 and $100 (another 100% gain). You can dig deeper into how these data scales are built to get a better technical feel for it.
Here’s a quick table to help you keep the two straight.
Linear vs Log Scale At a Glance
This table breaks down the essential traits and best-use cases for each scale, helping you decide which one fits your immediate analysis needs.
| Attribute | Linear Scale | Logarithmic (Log) Scale |
|---|---|---|
| Y-Axis Spacing | Equal spacing for equal value changes (e.g., $1, $2, $3) | Equal spacing for equal percentage changes (e.g., $1, $10, $100) |
| Best For | Short-term analysis and tracking specific price targets | Long-term analysis and visualizing percentage growth over time |
| Visualizes | Absolute price changes and volatility in dollar amounts | Proportional changes and the rate of growth or decline |
| Ideal User | Day traders and short-term swing traders | Long-term investors and macro analysts |
This simple breakdown shows that your trading timeframe and goals are the biggest factors in choosing the right scale. For quick, in-and-out trades, linear keeps it simple. For the big picture, log is king.
The image below offers a perfect visual of why this matters so much, especially when dealing with massive price moves over time.
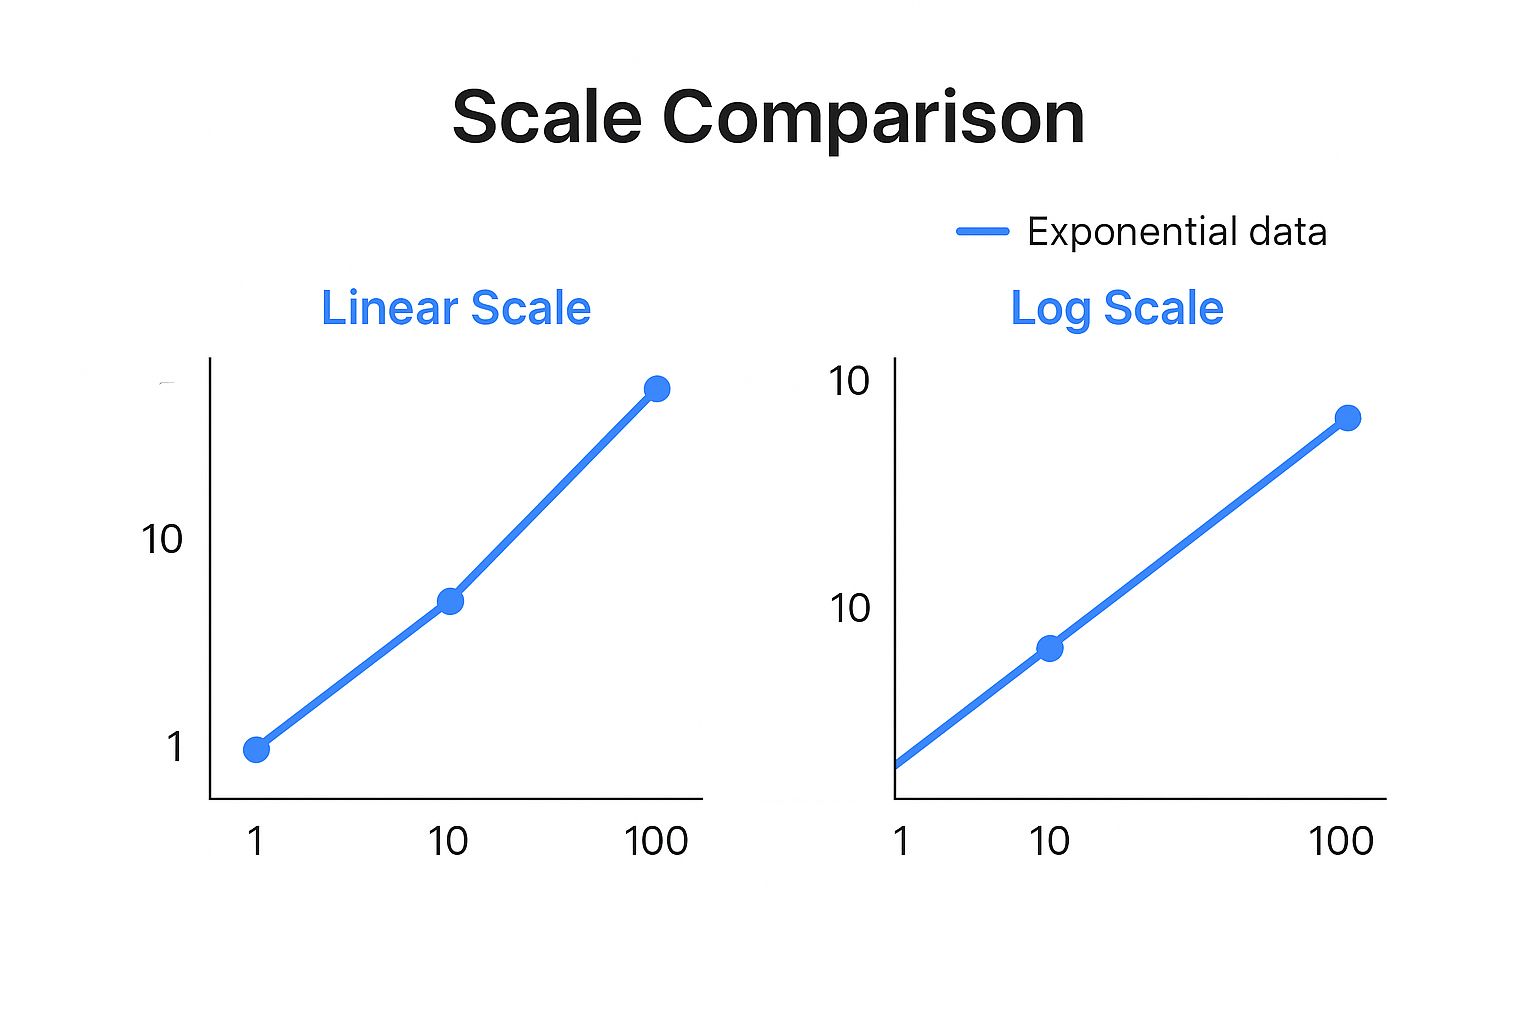
Look closely at how each scale plots the same data points: 1, 10, and 100. The log scale shows evenly spaced points, correctly representing that each step is a 10x increase. The linear scale, however, squishes the early data together and makes that final jump from 10 to 100 look like a colossal, out-of-nowhere explosion. This is exactly why for long-term trend analysis, the log scale is indispensable.
How Mathematical Differences Shape Your Analysis
To really get the whole linear vs. log scale debate, we have to pop the hood and look at the math that makes each chart tick. The difference isn't just about looks; it's a fundamental split in how they measure and show price changes, which completely changes how you see the market.
A linear scale runs on arithmetic progression. The easiest way to think about this is simple addition. Every single vertical tick on the Y-axis stands for the same fixed dollar amount. So, a move from $10 to $20 takes up the exact same space on the chart as a move from $100 to $110. Why? Because both are a $10 increase.
On the flip side, a logarithmic scale is built on geometric progression. This one is all about multiplication, not addition. Each vertical step represents a percentage increase. The distance from $10 to $20 (a 100% gain) is identical to the distance from $100 to $200 (also a 100% gain), even though the dollar amounts couldn't be more different.
Simple Interest vs. Compound Interest
A great real-world analogy is simple versus compound interest. It breaks down the concept perfectly.
-
Linear Scale (Simple Interest): Your gains are calculated only on the original amount. If you earn $5 in interest each year on $100, you just add a flat $5 annually. The growth is steady and predictable, just like the straight line you'd see on a linear chart.
-
Logarithmic Scale (Compound Interest): Here, your gains are calculated on the principal plus all the interest you've already earned. Growth snowballs because each new gain is a percentage of a bigger and bigger total. A log scale is designed to show this kind of compounding growth as a smooth, consistent trend line.
This distinction is mission-critical for any long-term analysis. When you look at decades of steady percentage-based growth on a linear chart, it gets warped. The early years look completely flat, while the later years seem to shoot straight up into the stratosphere.
Using log scales solved this problem. It finally gave analysts a way to visually compare percentage changes across decades, leading to much better insights into market cycles and true growth rates. When you backtest a portfolio over 40 years, you'll often see much smoother, more representative trendlines on a log chart, especially for investments that grew at a compound annual growth rate (CAGR) of around 10%.
Why This Math Actually Matters for Your Strategy
Getting the math right stops you from making huge analytical mistakes. A sharp, parabolic curve on a linear chart might scream "bubble!" to an inexperienced trader. But switch that same chart to a log scale, and you might see a perfectly stable, long-term percentage growth trend.
This mathematical foundation is what helps you tell the difference between a short-term absolute price jump and the proportional growth that really defines an asset's long-term story.
Understanding these mathematical nuances is also critical in fields like machine learning, where transforming data using different scales can make or break a model's performance. At the end of the day, picking the right scale is about aligning the chart’s logic with your goal, whether you're trying to scalp a $2 price swing or evaluate a 200% gain over two years.
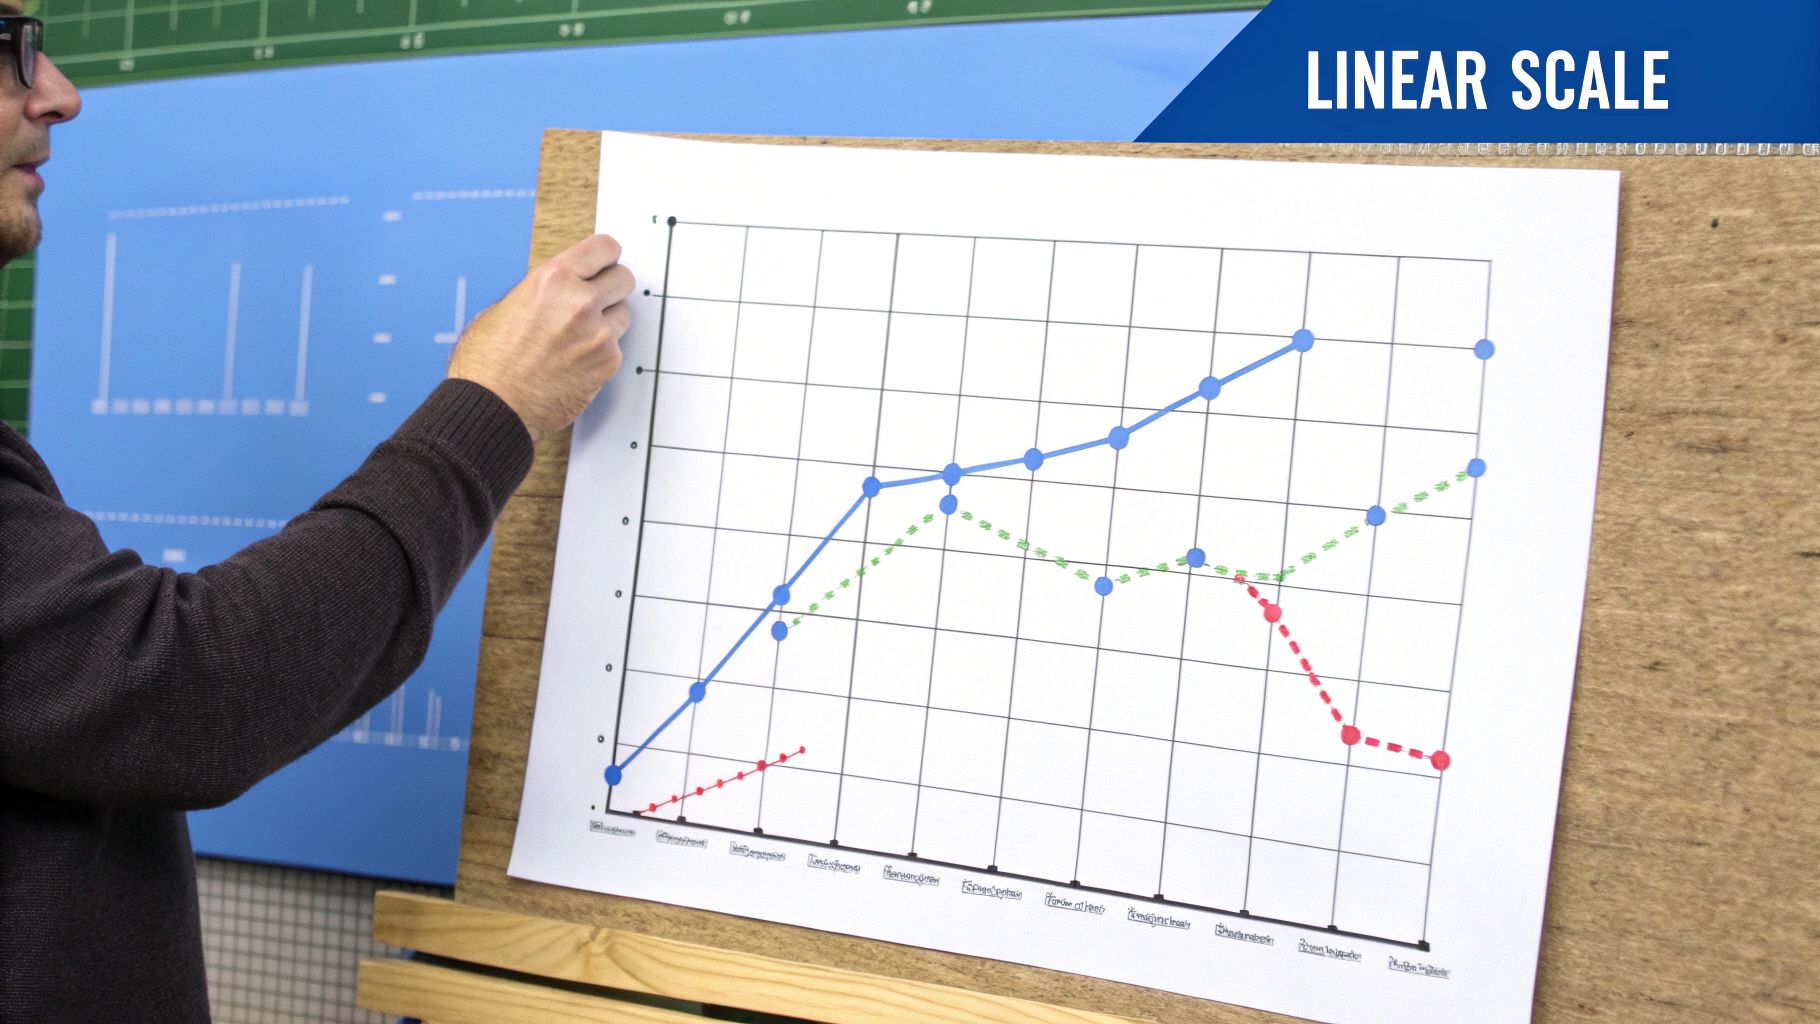
The Visual Impact Of Your Scale Choice
Choosing between a linear and a log scale isn't just a technical tweak—it fundamentally changes the story your chart tells. The exact same price data can paint two completely different pictures, which directly impacts how you see risk, opportunity, and trend strength. Getting a handle on this visual bias is crucial for objective analysis.

On a linear scale, long-term exponential growth often ends up looking like an insane, vertical spike in its later years. This can trigger an emotional response, making a stable, decades-long trend look like a speculative bubble about to pop. As a result, traders might be tempted to sell way too early, mistaking steady percentage growth for dangerous parabolic action.
A log scale, on the other hand, smooths this all out. It turns that steep curve into a much more stable, often straight-ish trend line by focusing on percentage changes instead of absolute dollar moves. While this gives a truer picture of long-term growth rates, it can set its own perceptual trap. The log scale can seriously downplay the size of recent price surges, making a $1,000 gain on a $10,000 stock look the same as a $100 gain on a $1,000 stock.
Linear Scales Highlighting Absolute Moves
A linear chart is king when it comes to showing absolute dollar changes, which is perfect for short-term trading where every single dollar counts. Think about a stock moving from $200 to $210. That $10 gain is visually obvious and easy to measure.
- Benefit: Gives you a crystal-clear picture of specific price targets and stop-loss levels.
- Drawback: Can warp your perception of long-term trends by making recent gains seem way bigger than earlier ones.
This direct, dollar-for-dollar representation is exactly why day traders often stick with linear scales for their clarity on immediate price action.
Log Scales Revealing Growth Rates
The real power of a log scale is in showing proportional change, which is absolutely essential for understanding an investment's long-term health. It answers the key question: "Is the rate of growth holding steady?" This is a massive distinction when you're looking at assets over many years.
The perceptual difference between linear vs log scale isn't just a trading quirk; it has real-world consequences for data interpretation. For instance, while log scales are superior for visualizing exponential data, they can be less intuitive for a general audience. This is a critical point to remember when choosing among top financial data visualization techniques for presentations.
This comprehension gap isn't just theoretical. Researchers found that when data was presented on different scales, it led to wildly different interpretations. Only about 40.7% of viewers could correctly answer a question about data on a logarithmic chart, while a whopping 83.8% got it right when looking at the same data on a linear chart.
This shows that while log charts are analytically powerful, their effectiveness really depends on whether your audience knows how to read them.
When Linear Charts Provide More Clarity
While log charts are fantastic for the big picture, they aren't always the right tool for the job. For short-term trading, the linear scale is often the undisputed king. Its power lies in its raw simplicity. When your entire focus is on absolute price moves over a few hours, days, or weeks, a linear chart delivers clarity that a log chart just can't match.
Day traders and swing traders live and die by concrete dollar-and-cent gains. They need to pinpoint exact price levels for entries, exits, and stop-losses. A linear chart is built for this, showing absolute price changes with total precision—each vertical tick means the same exact dollar value, every time.
Analyzing Tight Trading Ranges
Imagine a low-volatility stock that's been stuck trading in a tight channel between $50 and $52 for weeks. A trader's entire game here is simple: buy near the $50 support and sell at the $52 resistance. On a linear chart, that $2 range is crystal clear and easy to trade.
But on a logarithmic chart, this tiny percentage move gets compressed. The range would look even tighter, making it visually difficult to analyze and act on. By focusing on the absolute dollar difference, the linear scale gives the trader a much cleaner visual of the immediate profit potential.
For short-term strategies, the core question isn't "by what percentage did the price move?" but rather "how many dollars did it move?" A linear chart directly answers this critical question, making it the most practical choice for actionable, intraday decisions.
Setting Precise Price Targets
When you need to set exact price targets or identify key support and resistance levels, linear scales are indispensable. If a stock breaks out from a consolidation pattern at $100 and you're targeting $105, a linear chart makes it effortless to visualize that $5 move.
- Actionable Levels: It helps you see specific, hard price levels without the distortion of percentage scaling.
- Risk Management: Setting a stop-loss $2 below your entry point is straightforward because the chart visually represents that exact dollar amount.
- Gap Analysis: Analyzing price gaps—which are absolute differences between closing and opening prices—feels much more intuitive on a linear scale.
At its core, a linear chart acts like a ruler, measuring raw price distance. When your trading strategy is built on capturing specific dollar amounts, it's simply the most logical and effective tool you can use. The linear vs. log scale choice ultimately boils down to whether your analysis needs a ruler or a ratio calculator.
When A Logarithmic Chart Is Essential
While linear charts are fantastic for short-term analysis, there are definitely times when switching to a logarithmic scale is the only way to get a meaningful read on an asset. A log chart becomes absolutely crucial when you're analyzing assets over long timeframes, especially ones that have seen massive, exponential growth.
Without it, you’re just looking at a distorted picture of history.
For long-term investors, the game is all about understanding percentage growth and the consistency of trends over years, or even decades. Think about giants like the S&P 500 or major tech stocks that went from tiny valuations to absolute behemoths. On a linear chart, all their early growth is completely squashed into a flat line at the bottom, making it impossible to read.

This visual trickery hides critical information about past performance and volatility. A logarithmic scale, on the other hand, reveals the true nature of that growth by plotting price action based on percentage changes.
Uncovering Hidden Long-Term Trends
A log scale normalizes those insane-looking price spikes. It can turn what looks like a parabolic moonshot on a linear chart into a much more stable, often predictable trend channel. This is where its real power shines. It lets you draw accurate, long-term trendlines that connect points of consistent percentage-based support and resistance.
These are the kinds of trendlines that are totally invisible on a linear chart. On a log scale, a move from $10 to $20 (a 100% gain) carries the exact same visual weight as a move from $1,000 to $2,000 (another 100% gain). This proportional view is the only way to accurately judge whether an asset's growth rate is speeding up, slowing down, or holding steady over its entire life.
A logarithmic chart is the financial historian's tool of choice. It contextualizes decades of market data, revealing how an asset behaved during different economic cycles and growth phases in a way that a linear scale simply cannot.
Key Scenarios For Logarithmic Analysis
Here are a few specific situations where using a log scale is pretty much non-negotiable for any serious analysis:
- High-Growth Assets: For any stock or crypto that has gone up 10x, 100x, or more, a linear view is practically useless. It completely flattens all the early price action, making it impossible to analyze the foundational trends that got it there.
- Historical Market Cycles: When you're looking at bull and bear markets over decades, a log chart shows the proportional impact of each cycle relative to the asset's value at that time.
- Comparing Volatility Over Time: It helps you see if an asset was more volatile in percentage terms back in its early days compared to its more mature stages.
Ultimately, the whole linear vs log scale debate isn't about which one is "better." It's about matching your tool to your task. When your analysis spans years and involves massive growth, the logarithmic scale isn't just a preference—it's an essential instrument for uncovering an asset's true long-term story.
Applying The Right Scale In Your Platform
Knowing the theory behind linear vs. log scales is one thing, but actually putting it to use in your trading software is where it counts. Inside ChartsWatcher, we’ve made switching between scales a quick toggle so you can flip your analytical perspective instantly without breaking your focus.
Most platforms, including ours, put the scale option right on the price axis or in a settings menu. Usually, it's just a single click to go from a linear to a logarithmic view and back again.
Here’s where you’ll find the scale toggle in the ChartsWatcher interface.
See how it's right there? That easy access is key. You need to be able to adapt your chart to what you’re analyzing on the fly, and this quick-toggle function makes that seamless.
A Framework For Choosing The Right Scale
Making the right call consistently comes down to having a simple decision-making process. Before you even start drawing trendlines, ask yourself these three questions to nail down which scale makes the most sense for the job at hand.
-
What is my timeframe? If you're looking at intraday moves or short-term swing trades—think hours, days, or maybe a few weeks—a linear scale gives you the clarity you need for absolute price targets. But for long-term investments spanning months, years, or even decades, the log scale is non-negotiable for seeing percentage-based growth properly.
-
What is the asset's price history? For a stock with a long history of explosive, exponential growth (like big tech names or major indexes), a log scale is the only way to see the chart without massive distortion. If an asset is just chopping around in a relatively stable range, a linear scale will give you a much cleaner picture.
-
What is my analytical objective? Am I trying to set a tight, dollar-based stop-loss? Use a linear chart. Am I checking to see if a massive, long-term trendline based on percentage moves is still holding up? Flip over to the log chart.
Your objective dictates your tool. For day-to-day trading focused on capturing specific dollar movements, linear is your go-to. For strategic, long-term position analysis, the logarithmic view provides the necessary historical context and proportional insight.
Getting this simple framework down will build your confidence and make your analysis much more precise. For more ideas on getting your workspace set up for success, check out our guide on how to customize stock charts for optimal trading.
Got Questions? We've Got Answers
Even after breaking down the differences, some practical questions always come up. Let's tackle the most common ones traders ask so you can apply these concepts with confidence and sidestep any charting pitfalls.
Do Technical Indicators Change When I Switch Scales?
Absolutely, and it's a critical point to understand. Your choice of scale can completely change the story your indicators are telling, especially when it comes to trendlines.
A straight trendline drawn on a linear chart connects absolute price points. Flick over to a log chart, and that same line will suddenly look curved. Why? Because it's no longer representing a constant percentage change. On the flip side, a line that connects consistent percentage gains will appear perfectly straight on a log chart but will curve upwards on a linear one. This isn't just a visual trick; a trendline that looks broken on one scale might be perfectly intact on another, which could be the difference between a buy signal and a false alarm.
What's the Default Scale on Most Trading Platforms?
The vast majority of charting platforms, including our own ChartsWatcher, default to a linear scale. This is mostly a practical choice—it’s more intuitive for looking at short-term price moves and is generally easier for traders who are just starting out to grasp.
But don't let the default setting fool you. Nearly every serious platform has an easy-to-find toggle to switch over to a logarithmic scale. Knowing where that button is and when to use it is essential for any real long-term analysis.
How Do I Explain This to a Beginner?
The best way is to ditch the complex math and use a simple real-world analogy. Think about tracking a tree's growth over many years.
A linear scale is like measuring the tree's height in inches. Each year, you see the exact, absolute amount it grew. A log scale, on the other hand, is like tracking its growth rate. It shows you whether the tree is growing by the same percentage each year—revealing if its growth is steady, speeding up, or slowing down.
In short, linear shows the raw steps, while log reveals the proportional leaps. That’s precisely why the log scale is so much better for looking at growth over long periods where compounding really kicks in.
Ready to see how the right chart scale can transform your analysis? With ChartsWatcher, you can instantly switch between linear and log scales to gain the perspective you need for any trade. Start your free trial today at https://chartswatcher.com and make smarter, more informed decisions.
