Keltner Channel Strategy: Proven Methods That Actually Work
Why Keltner Channel Strategy Outperforms Other Indicators

When traders look for an edge, it’s easy to get lost in a sea of complex indicators, each promising to be the key to the market. Yet, many seasoned traders I've talked to always seem to come back to a surprisingly simple tool: the Keltner Channel. Its power isn’t in some secret formula, but in how it blends trend and volatility to paint a clearer picture of market behavior than most standalone indicators.
Unlike a basic moving average that just points to a trend, or a volatility tool that can overreact to sharp price moves, the Keltner Channel strategy offers a more intuitive and adaptive framework. It builds its bands using the Average True Range (ATR), which means the channel literally breathes with the market. When things are calm and volatility is low, the bands get tighter. When the market gets wild, the bands expand to contain the price action. This dynamic quality is its main advantage.
The Psychology of Clarity
One of the biggest struggles in trading is psychological. Overly complicated setups often lead to "analysis paralysis," causing traders to freeze up or make emotional mistakes. The Keltner Channel’s visual simplicity helps cut through that noise. It gives you three straightforward reference points: the upper band, the lower band, and the central moving average. This structure helps you answer key questions instantly:
- Is the price moving within its usual range?
- Is the market showing exceptional strength or weakness by pushing outside the bands?
- Is the price pulling back toward its average (the central EMA)?
This clarity helps build discipline. Instead of guessing, you have a defined framework for looking at price. It’s this built-in context that helps many traders stick to their plan when using a Keltner Channel strategy.
Adapting to Any Market Condition
A great strategy is one that still works when market conditions change. This is where Keltner Channels really shine. In a strong trend, the price will often "walk the bands," hugging the upper or lower channel line. This is a clear signal of trend strength and can highlight great spots for trend-following entries.
On the flip side, when the market is moving sideways, the bands act as dynamic support and resistance levels. When the price bounces between the bands, it can signal mean-reversion trades, where you bet on the price returning to the central EMA. This versatility means you’re not limited to a single-use tool; you have a guide for multiple market environments. Its effectiveness isn't just theory; quantitative analysis has shown that a Keltner Channel strategy can hit an impressive win rate of around 77% in backtests. This performance comes from its smart design, which uses an exponential moving average (EMA) at its core and ATR to map out probable price boundaries. You can explore more about these performance metrics and find deeper Keltner Bands trading strategies. This reliable performance across different market types gives traders the confidence to act on their plans with conviction.
Breaking Down The Numbers Behind Channel Performance
While the visual clarity of a Keltner Channel strategy is great, its real power comes from solid statistical principles. The indicator isn't just drawing random lines on a chart; it's mapping the likely range of price movement based on recent volatility. Getting a handle on the math behind this gives you a real advantage, turning a simple visual tool into a data-driven decision engine.
At its heart, the channel is built around two key parts: a central exponential moving average (EMA) and the Average True Range (ATR). The EMA gives you the baseline trend, while the ATR measures volatility. The outer bands are then calculated by adding and subtracting a multiple of the ATR from this EMA. This setup is incredibly effective. In fact, analysis shows that with standard settings, the channel bands contain just over 85% of all price action. Because the price stays inside so often, any move outside the bands is a statistically big deal that you should pay attention to. You can explore detailed Keltner statistics to see how these probabilities play out in different market conditions.
Finding The Right Multiplier
The "secret sauce" in any Keltner Channel strategy is picking the right ATR multiplier. This one number controls the channel's width and, as a result, how sensitive your strategy is to price moves. A smaller multiplier creates a tighter channel, which means more frequent signals but also more false breakouts. A larger multiplier widens the channel, giving you fewer signals that are often higher quality.
For instance, a common setup might use a 2x ATR multiplier. This is perfect for catching strong breakouts in a trending market. But in a choppy, sideways market, you might find a 3x or even 4x multiplier works better for spotting true exhaustion points for mean-reversion trades. There is no single "best" setting; it all comes down to the market's behavior and your personal trading style. Backtesting different multipliers in a platform like ChartsWatcher is key to finding what works.
To illustrate how different parameters can affect a strategy, here’s a quick comparison of common Keltner Channel settings.
| Keltner Channel Parameter Comparison | | :--- | :--- | :--- | :--- | | Parameter Setting | Signal Frequency | Accuracy Rate | Best Market Conditions | | EMA 20, ATR 1.5x | High | Lower | Strong, fast-moving trends | | EMA 20, ATR 2.0x | Medium | Moderate | Standard trending markets | | EMA 50, ATR 2.5x | Low | Higher | Volatile but range-bound markets | | EMA 20, ATR 3.0x | Very Low | Highest | Extreme overbought/oversold conditions (mean reversion) |
This table shows a clear trade-off: tighter channels (like 1.5x ATR) give you more action but may have a lower win rate, while wider channels (like 3.0x ATR) are more selective and often more accurate, making them better for specific mean-reversion setups.
This infographic shows the potential win rates for different ATR multipliers in a sample strategy.
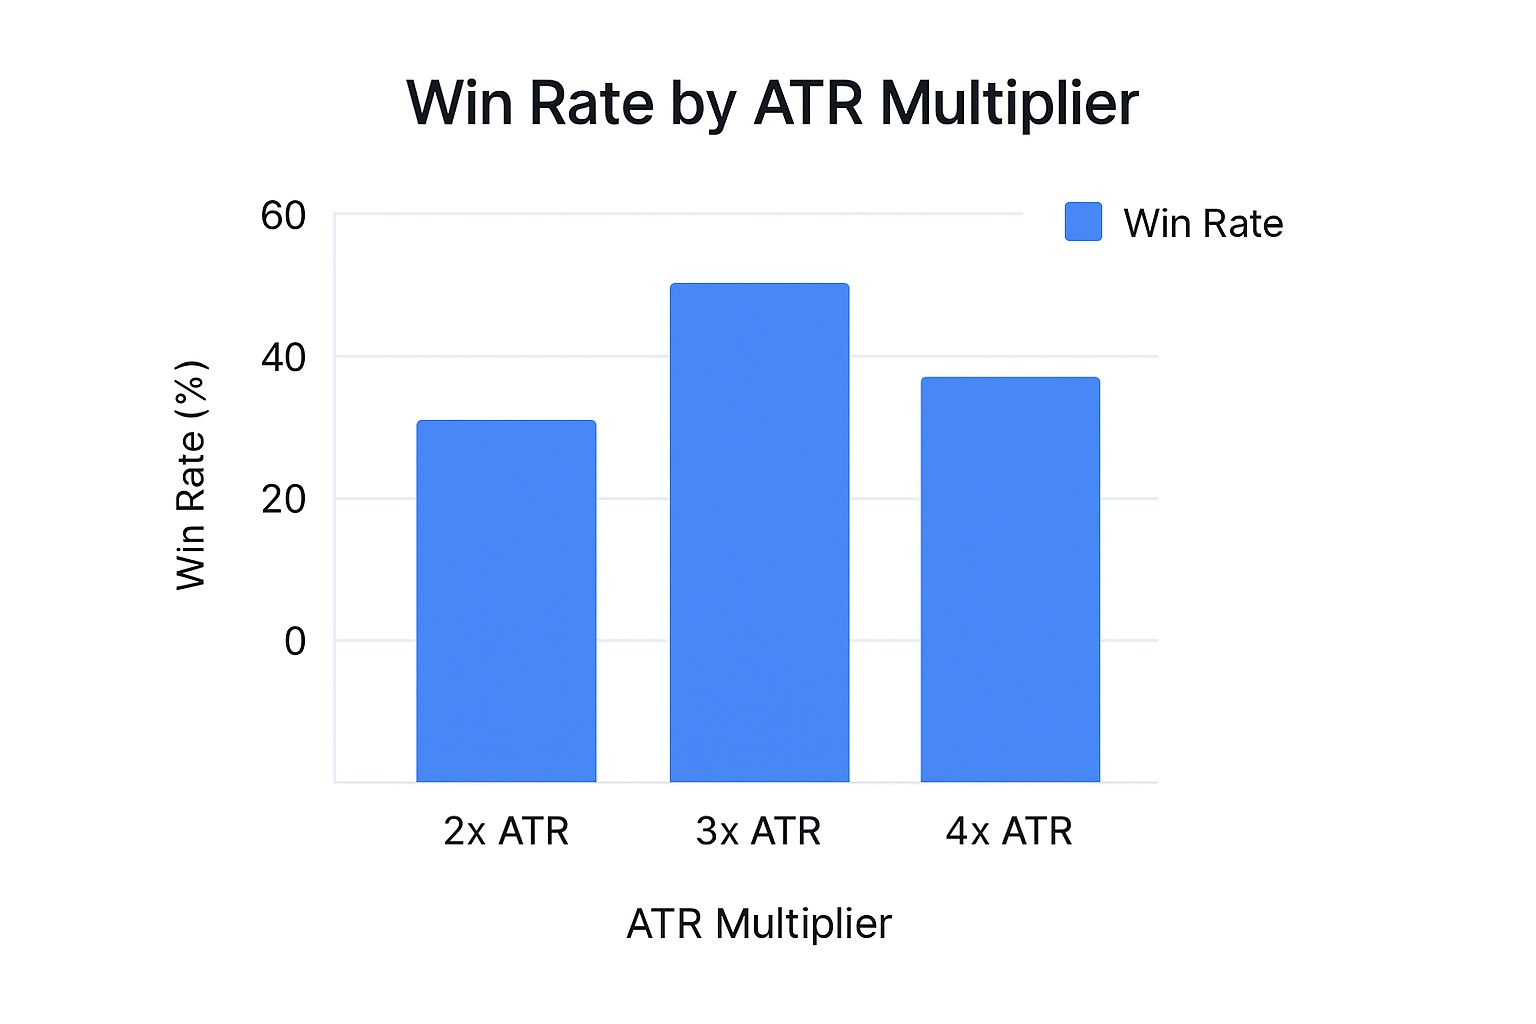 As the data suggests, a 3x ATR multiplier produced the best win rate in this particular test, showing how small tweaks can have a major impact on your results.
How The Centerline And Bands Interact
The relationship between the EMA centerline and the outer bands creates predictable patterns that are the foundation for many strategies. In a strong uptrend, the price will often "walk" along the upper band, using the EMA as a dynamic support level during pullbacks. If the price fails to reach the upper band on a bounce and instead crosses below the EMA, it can be an early sign that momentum is weakening.
On the flip side, in a downtrend, the price will ride the lower band. A pullback that hits the EMA but can't push higher signals that the downtrend is likely to continue. By understanding these numerical relationships—the probability of the price staying within the bands and the interplay between the average and its volatility boundaries—you can read price action with much more confidence.
Setting Up Your Charts For Maximum Trading Edge
Getting your charts configured correctly is the difference between having a theoretical strategy and a practical, money-making tool. The default settings on most platforms are a decent starting point, but they rarely account for the specific personality of the asset you're trading. A Keltner Channel strategy for a volatile crypto pair will look very different from one for a stable blue-chip stock. Let's walk through how experienced traders fine-tune their setups.
The screenshot above shows a typical Keltner Channel setup on a charting platform like TradingView, visualizing how price interacts with the volatility-based bands. Notice how the channel expands during sharp price moves and contracts during quiet periods. This gives you immediate visual feedback on market conditions.
Customizing Parameters For Different Markets
The standard 20-period EMA and 2.0x ATR multiplier is a solid foundation, but you really need to adjust it based on the market's rhythm. My personal approach involves starting with the standard settings and then tailoring them to the asset's typical behavior.
- Forex: Major pairs like EUR/USD are often less volatile and can exhibit strong trending behavior. For these, I often tighten the channel slightly to a 1.8x ATR multiplier. This adjustment helps me get into established trends a bit earlier on pullbacks to the EMA.
- Stocks: With stocks, volatility varies wildly. For a high-flying tech stock, I might widen the bands to a 2.5x or even 3.0x ATR to avoid getting stopped out by random noise. For a more stable utility stock, the standard 2.0x is often perfect.
- Commodities: Assets like Gold (XAU/USD) or Oil (WTI) can have periods of extreme trending followed by long consolidations. Here, I'll sometimes use a longer EMA, like a
50-period EMA, to define the longer-term trend and keep the 2.0x ATR for capturing significant breakout moves.
These aren't hard rules, but they are great starting points. The key is to observe how price respects the channels with different settings on your chosen asset and timeframe. Backtesting these variations in a tool like ChartsWatcher is essential to find what gives you the cleanest signals.
Enhancing Your View With Complementary Tools
A Keltner Channel is powerful, but it's not meant to be used in a vacuum. Combining it with one or two complementary indicators can dramatically improve signal quality by adding confirmation. The goal isn't to clutter your screen but to add another layer of evidence to your trading decisions.
A common and highly effective combination is adding a momentum oscillator like the Relative Strength Index (RSI) or the Stochastic Oscillator. Here’s how you can use them together:
- Trend Confirmation: When price touches the upper Keltner band in an uptrend, you want to see the RSI in overbought territory (above 70). This confirms the strength of the move.
- Reversal Signals: For a mean-reversion trade, look for the price to hit the lower Keltner band while the RSI shows a bullish divergence (price makes a new low, but RSI makes a higher low). This is a strong signal that downside momentum is fading.
Another excellent addition is a volume indicator. A breakout above the upper Keltner band is far more convincing if it happens on a significant spike in volume. It shows genuine buying pressure is behind the move, not just a random fluctuation. To get more ideas on building a powerful visual setup, you can customize stock charts for smarter trading strategies in our detailed guide.
Mastering Entry Timing And Exit Strategies
Having a perfectly configured chart is one thing, but knowing the precise moment to pull the trigger is what separates consistently profitable traders from everyone else. This is where a well-defined Keltner Channel strategy becomes your best friend, giving you clear rules for entering and exiting trades. It’s not just about seeing the price touch a band; it’s about understanding the context behind the move and acting with confidence.
One of the most reliable entry techniques is the pullback strategy. This approach balances the desire to join a strong trend with the patience to wait for a lower-risk entry point. Instead of chasing a breakout, you wait for the price to return to a more sustainable level. A popular Keltner Channel trading strategy on daily charts involves this very idea: you wait for the price to break above the upper band, signaling a new uptrend, and then you enter a long position only when the price pulls back to the middle EMA line. You can discover more insights about this pullback approach and how it's used in different scenarios.
Aggressive Vs. Conservative Entry Styles
Your personality as a trader will heavily influence how you enter a position. There's no single "correct" way, but each approach comes with its own risk profile. Let's look at two common styles for going long after a breakout:
- The Aggressive Entry: This trader jumps in as soon as the price breaks and closes above the upper Keltner band. The upside is getting in early on a potentially powerful move. The major risk, however, is getting caught in a "false breakout" where the price quickly snaps back inside the channel. This style demands quick reflexes and a tight stop-loss.
- The Conservative Entry (The Pullback): As mentioned, this trader waits for a close above the upper band and then patiently waits for a pullback to the 20-period EMA (the centerline). This confirmation entry ensures you're not buying at the peak of short-term hype and often provides a much better risk-to-reward ratio, as your entry point is closer to a logical support level.
Mastering Your Exits: Letting Winners Run
Knowing when to get out is just as critical as knowing when to get in. A common mistake is taking profits too early and missing out on the biggest part of a trend. The Keltner Channel provides excellent signals for managing your position and maximizing your gains.
For a long position, a disciplined exit plan might look like this:
- Initial Stop-Loss: Place your initial stop-loss just below the lower Keltner band right after you enter. This gives your trade room to breathe and accounts for the current market volatility.
- Trailing Stop: As the price moves in your favor, you can use the centerline EMA as a trailing stop. As long as the price stays above this moving average, you hold the trade. A close below the EMA signals that momentum is fading and it's time to take your profits.
- Reversal Signal: A more aggressive exit signal occurs when the price, after a strong uptrend, crosses the entire channel and closes below the lower band. This often indicates a complete trend reversal is getting started.
Protecting Your Capital When Markets Turn Against You
Every trader feels brilliant when a plan works perfectly, but the real test of a solid Keltner Channel strategy is how it performs when you’re wrong. No strategy wins 100% of the time, and surviving the inevitable losses is what ensures you’ll be around to trade tomorrow. Protecting your capital isn’t the most glamorous part of trading, but it’s the most important. This means moving beyond just placing entries and thinking critically about risk from the moment you consider a trade.
Your risk management should be directly tied to the signals the Keltner Channel provides. The channel’s width, which is determined by the ATR (Average True Range), is a direct measure of current volatility. This gives you a data-driven way to approach position sizing. In a low-volatility environment where the bands are tight, you might feel comfortable taking on a slightly larger position size because the expected price swings are smaller. Conversely, when the bands are wide and volatility is high, reducing your position size is a smart, defensive move. This adaptive approach prevents you from taking on the same dollar risk in a wild market as you would in a calm one.
Intelligent Stop-Loss Placement
Placing a stop-loss is an art that balances giving a trade room to work against protecting your account from a devastating loss. With a Keltner Channel strategy, you have a built-in guide. A common but effective technique is to place your initial stop-loss just outside the opposite band. For a long entry near the centerline, your stop would go just below the lower Keltner band. This method respects the market’s current volatility; the stop is naturally further away in volatile markets and tighter in calm ones.
Another huge challenge is handling false breakouts. You enter a long trade as the price closes above the upper band, only to watch it immediately reverse and dive back inside. This is where discipline and pre-defined rules are your best defense. A simple rule I follow is: if the price breaks out and then closes back inside the channel on the very next candle, the trade is invalidated. I’ll exit immediately for a small loss rather than hoping it turns back around. Hope is not a strategy, and small losses are far easier to recover from than big ones. If you want to dive deeper into these core principles, you can explore some proven strategies to protect your capital in our comprehensive guide on risk management.
Navigating Different Market Conditions
Your risk parameters shouldn't be static. They need to adapt to what the market is doing right now, and the Keltner Channel itself can help you define these states. To make this practical, let's break down how you might adjust your rules based on what the channels are telling you.
Here is a table outlining how to manage risk in various market environments identified by the Keltner Channel.
| Risk Management Guidelines by Market Condition | | :--- | :--- | :--- | :--- | | Market Condition | Position Size | Stop Loss Distance | Risk-Reward Ratio | | Strong Trend (Price "walking the band") | Standard | Below Centerline EMA | Aim for 3:1 or higher | | Sideways/Range-Bound (Bouncing between bands) | Reduced | Just outside opposite band | Target 1.5:1 to 2:1 | | High Volatility (Wide, expanding bands) | Significantly Reduced | 1.5x ATR below entry | Target 2:1, but exit early if needed | | Low Volatility (Narrow, tight bands) | Standard to Slightly Increased | Just outside opposite band | Wait for breakout to define R:R |
This structured approach removes emotion from the equation. When the market gets choppy and the bands are wide, you automatically reduce your risk. When a clear trend emerges, you know exactly where your trailing stop should be. This level of planning is what separates professional traders from gamblers. It's about building a defensive system that protects your profits and keeps you in the game long-term.
Advanced Techniques For Experienced Traders
To truly get the most out of a Keltner Channel strategy, we need to move beyond standard entries and exits. For traders with some experience, this means layering in other tools and concepts to filter out market noise and pinpoint only the highest-probability setups. This isn’t about making your charts messy; it's about adding smart layers of confirmation that give you an edge.
A great way to strengthen your trading signals is to combine the Keltner Channel with indicators that track different market dynamics, like momentum and volume. A simple but effective pairing is the Keltner Channel with a momentum oscillator like the Relative Strength Index (RSI) or the Stochastic Oscillator.
Imagine you see the price touch the lower Keltner band. By itself, that could be a buy signal. But if you also notice the RSI showing a bullish divergence—where the price hits a new low but the RSI makes a higher low—the signal becomes much stronger. This divergence hints that the downward push is losing steam and a reversal is more likely on the horizon.
Deepening Analysis with Volume and Multi-Timeframe Views
Volume is another crucial piece of the puzzle. A breakout above the upper Keltner band is interesting, but a breakout that happens on significantly higher-than-average volume is a real statement. It suggests that institutional money is behind the move, giving it conviction. Without that volume spike, a breakout is more likely to be a "fakeout" that quickly fizzles. Adding a simple volume-by-price indicator can instantly tell you if a breakout has the fuel to keep going.
Another pro-level technique is multi-timeframe analysis. A setup might look promising on your main 1-hour chart, but what’s the story on the 4-hour or daily chart? A solid Keltner Channel strategy involves checking the higher timeframe to make sure you're trading with the larger trend, not fighting it. For example, if you spot a long entry on the 1-hour chart, but the daily chart shows the price is stuck firmly below its 20-period EMA centerline, you might decide to sit this one out. This simple check can save you from taking low-probability, counter-trend trades.
For those looking to bring more powerful tools into their process, an AI Agent for Finance Investment Analysis can provide a different kind of support, helping to sort through large datasets and spot underlying market trends.
Advanced Position Management: Scaling In and Out
Finally, professional traders rarely think in terms of a single all-or-nothing entry and exit. Instead, they often manage their positions by scaling. Instead of jumping in with your full position size at the first signal, you could start with a partial position. If the trade moves in your favor and shows more strength—like bouncing successfully off the centerline EMA—you can then add to your position.
This scaling method works for exits, too. Rather than closing your whole position at one price target, you could sell a portion to bank some profits and let the rest of the position run with a trailing stop, perhaps using the Keltner centerline as your guide. This flexible approach to position management helps you squeeze more profit from your winning trades while still managing your risk. It’s these thoughtful adjustments that can turn a basic Keltner Channel strategy into a robust, professional trading system.
Building Your Path to Consistent Trading Results
Knowing how to build a Keltner Channel strategy is one thing, but turning that knowledge into consistent results is where the real work begins. A profitable strategy on paper doesn't mean much until you can execute it in a live market. This journey is all about patience, discipline, and following a structured plan to build both your skills and your confidence. It doesn't start with risking real money; it starts with a dedication to the process.
The first step is always paper trading. The objective here isn't to rack up fake profits but to truly get a feel for your strategy's rhythm and mechanics. Your goal should be to place at least 50 to 100 trades, sticking to your rules without any exceptions. Keep a detailed journal for every single trade: why you entered, how you managed it, and where you exited. This repetition builds the mechanical discipline you'll need when the pressure is on.
From Practice to Performance
Once your paper trading demonstrates you can follow the rules and that the strategy has a positive outcome, you're ready for a live account—but with minimal risk. I mean starting with a position size so small that the financial gain or loss feels insignificant. The true test at this stage is psychological. Can you stick to your plan when actual money is at stake, even if it's just a few dollars?
This is the point where many traders face the emotional side of systematic trading. The temptation to second-guess a signal, or to grab a small profit on a winning trade before your exit rule is met, can be intense. To get past this, you need two things:
- Unwavering Discipline: You have to trust the rules you've backtested. If your strategy says to hold a position until the price closes below the centerline EMA, you do it. No negotiations.
- Continuous Improvement: Your trading journal is your single most important tool. Spend time each week reviewing your performance. Did you follow the plan on every trade? Are there any mistakes you keep making? This feedback loop is essential for refining your execution and building real confidence.
Long-Term Mindset and Adaptation
A successful Keltner Channel strategy isn't something you create once and then forget about. Markets are always changing. While the core ideas behind the Keltner Channel are solid, you have to stay observant. It's a good practice to review your strategy's performance on a quarterly basis to make sure it's still effective in the current market environment. This isn't about constantly tinkering with your settings, but about making small, data-backed tweaks when they're clearly needed.
Real trading confidence doesn't come from a handful of big wins. It's built by executing a solid plan with discipline over hundreds of trades. Manage your expectations, embrace the learning curve, and put your focus on flawless execution instead of just the profits.
Ready to build, test, and refine your own professional-grade Keltner Channel strategy? Explore ChartsWatcher and see how our powerful backtesting and scanning tools can help you find your trading edge.
