Ichimoku Cloud Strategy: Trading Secrets That Actually Work
Why the Ichimoku Cloud Actually Works (And Why Most Traders Get It Wrong)
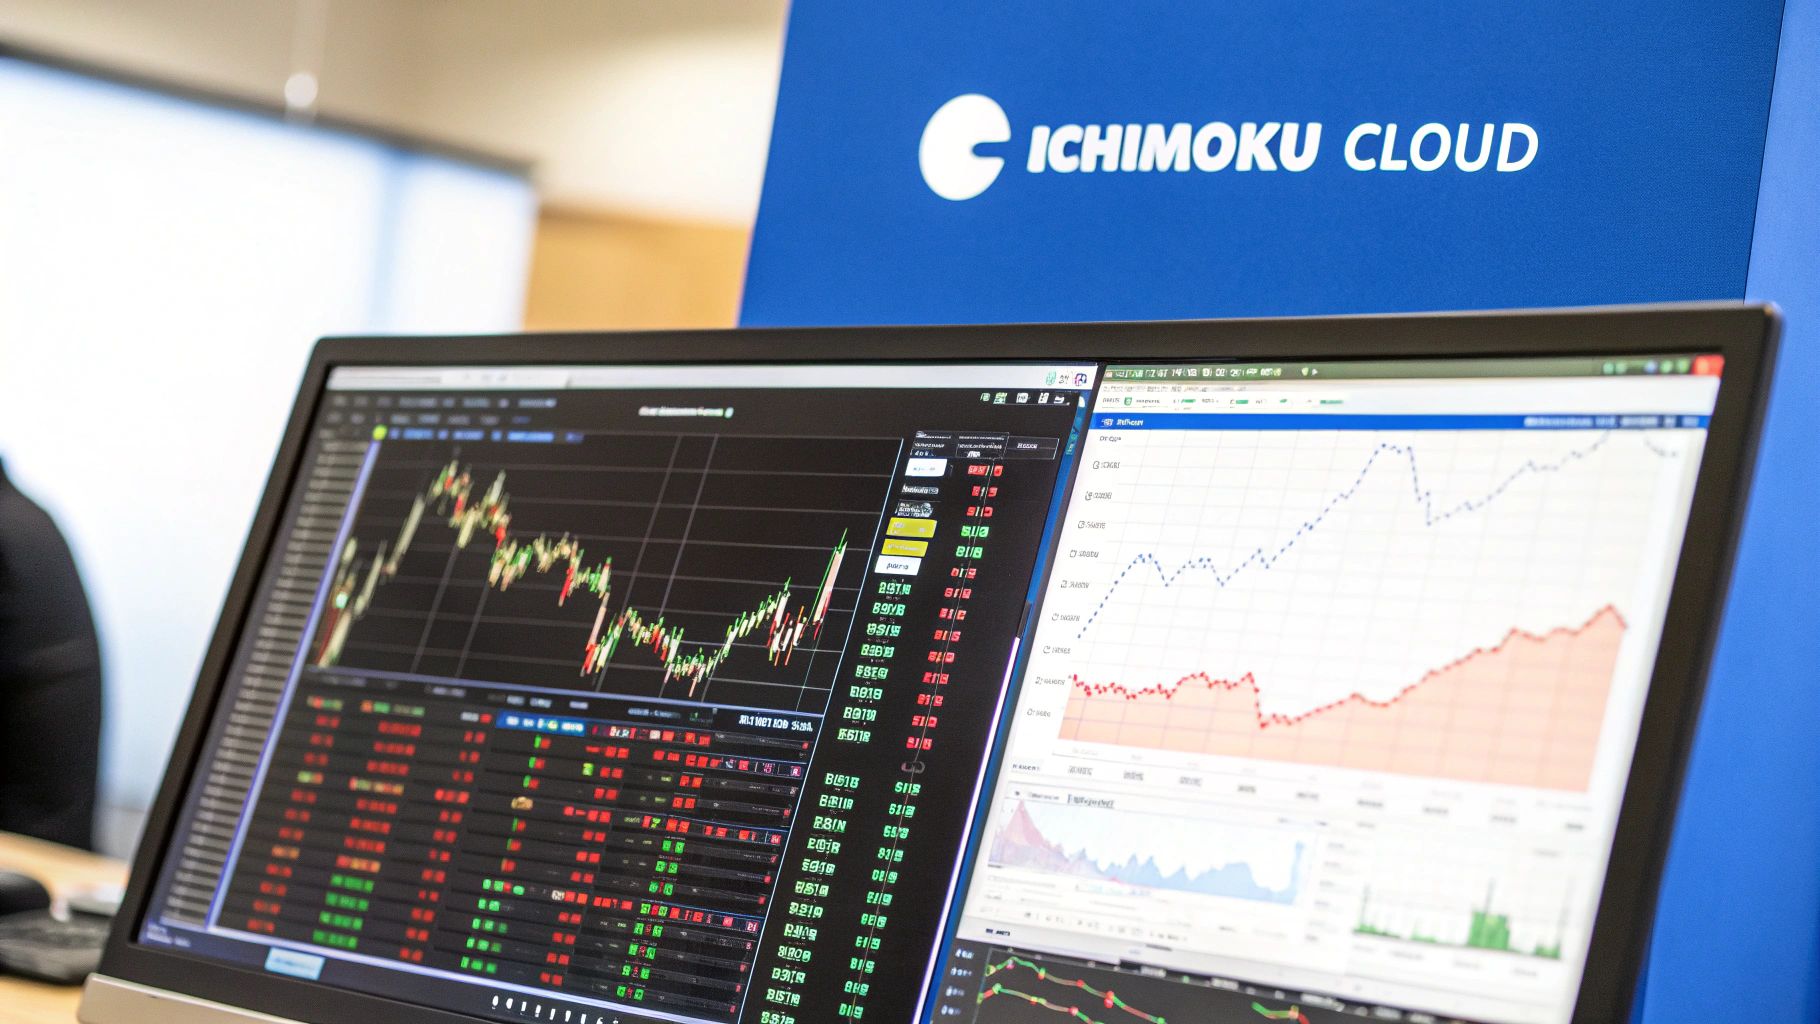
When you first pull up the Ichimoku Cloud on a chart, it's easy to feel overwhelmed. It looks like a jumble of colorful lines, and many traders either give up or try to use it like any other technical indicator. That’s where they go wrong. The Ichimoku system isn't just an indicator; it's a complete framework for analyzing market behavior at a glance. Its real power comes from how its five components work in sync to give you a full picture of price action—something a couple of moving averages can't do.
What makes an effective Ichimoku Cloud strategy so powerful is its focus on equilibrium. Picture the market as a constant tug-of-war between buyers and sellers. The Ichimoku Cloud, or Kumo, is the visual representation of where that battle is fiercest. When the price is stuck inside the cloud, the market is balanced and uncertain. A clean break above or below the cloud signals a winner has emerged, and a new trend is likely forming. This is far more insightful than just waiting for two lines to cross.
A System Built on Foresight, Not Hindsight
The true brilliance of the Ichimoku system lies in its ability to look ahead. While most technical tools are reactive, telling you what has already happened, the Kumo is projected 26 periods into the future. This gives you a unique edge: you can see potential areas of support and resistance before the price even reaches them. This isn't about fortune-telling; it's about identifying probable zones of conflict based on historical price data.
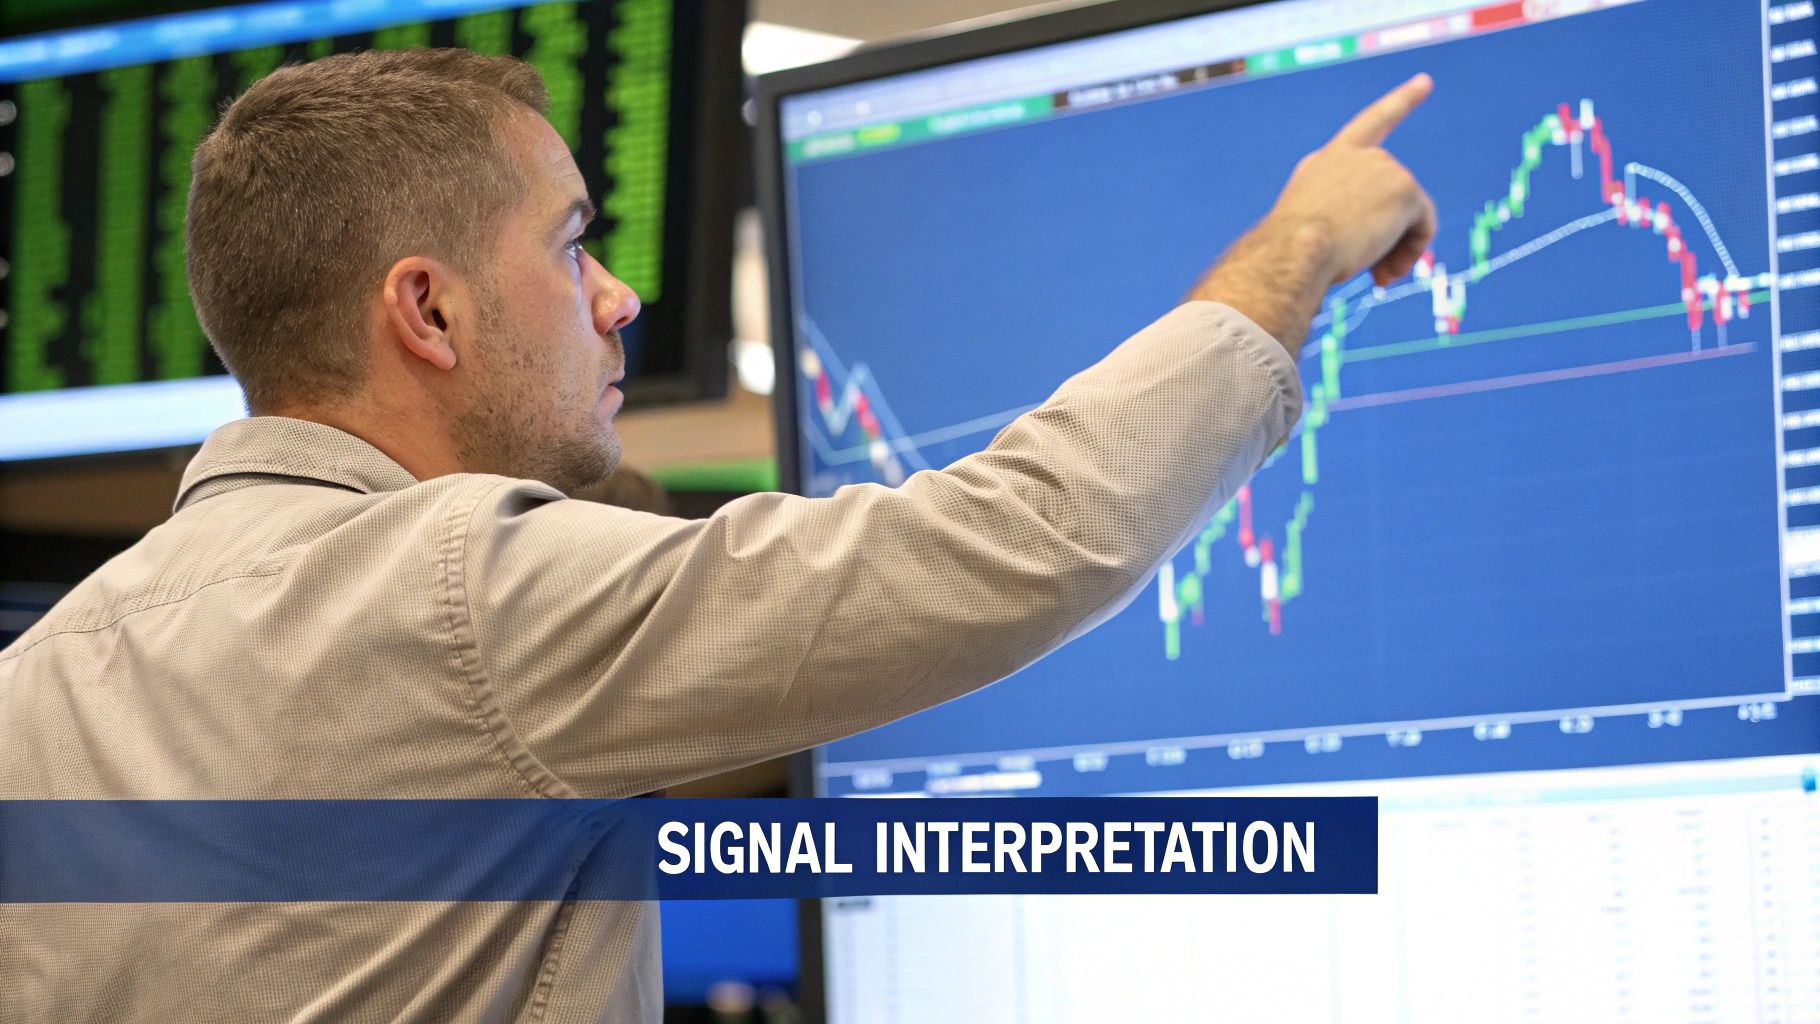
This screenshot shows a textbook bullish setup where the price has broken out above the Kumo.
Look at how all the pieces fall into place: the price is above the cloud, the Tenkan-sen is above the Kijun-sen, and the future cloud is green. This alignment points to a strong, established uptrend.
This all-in-one approach was exactly what its creator intended. Developed by Japanese journalist Goichi Hosoda in the 1930s and released to the public in the 1960s, the Ichimoku Cloud was designed to offer a complete market summary at a single glance. By combining trend, momentum, and dynamic support and resistance, it provides both backward- and forward-looking information. This helps traders spot potential trend changes much sooner than with other tools, which is why it remains a favorite in markets from Japanese equities to modern forex and crypto trading. You can find a great historical summary and explanation of the Ichimoku Cloud's core principles on Investopedia.com.
Common Missteps That Lead to Failure
So, if it’s so effective, why do so many traders struggle with it? The most frequent mistake is cherry-picking signals. For instance, a trader might see a Tenkan-sen/Kijun-sen cross and immediately open a position without checking the other elements. That's like trying to drive a car by only looking at the speedometer and ignoring the windshield.
Here are the most common ways traders get it wrong:
- Ignoring the Cloud: Taking a buy signal when the price is trading below the Kumo is a classic mistake. You're fighting the main trend, and the house usually wins. The cloud is your ultimate trend filter.
- Forgetting the Chikou Span: The Chikou Span (or Lagging Span) is your final confirmation. A buy signal isn't fully validated until the Chikou Span is also trading above the price from 26 periods ago, with no major obstacles in its way.
- Trading in a Choppy Market: The Ichimoku system performs best in clear, trending markets. When the price is whipping back and forth inside a flat, directionless cloud, the signals become unreliable. In these situations, the smartest trade is often no trade at all.
By treating Ichimoku as a complete, integrated system—where all five elements must agree to generate a high-probability signal—you can sidestep these common pitfalls and start using it effectively.
Building Your Professional Ichimoku Trading Setup
Moving from theory to a live trading screen is where the rubber meets the road. A cluttered or poorly set up chart can make you second-guess your decisions or, even worse, miss a great trade entirely. The whole point is to make high-probability setups practically jump off the screen at you, and that process starts with getting the Ichimoku indicator configured correctly on your trading platform.
Most modern charting software, like TradingView or the popular ChartsWatcher platform, includes the Ichimoku Cloud as a standard indicator. Adding it is usually just a click away, but the real work starts when you customize it. The default settings (9, 26, 52) are a solid foundation for many markets, especially those that run 24/5 like forex, since they were originally based on historical Japanese trading schedules. However, for markets with different hours, like the 24/7 crypto world, many traders find success by tweaking these inputs to better match that market's unique rhythm.
Customizing for Clarity and Speed
With the indicator on your chart, your next task is to make it visually clean. A messy chart is a trader's worst enemy. A common practice among experienced traders is to adjust the colors and transparency of the Kumo (the cloud) to make it less distracting while still showing its crucial support and resistance levels. For instance, you might use a muted green for a bullish Kumo and a soft red for a bearish one, setting the opacity to around 25%. This keeps the cloud visible without hiding the price action inside it.
Here’s a simple visual that breaks down the standard periods for each Ichimoku component, which are the building blocks of the entire system.
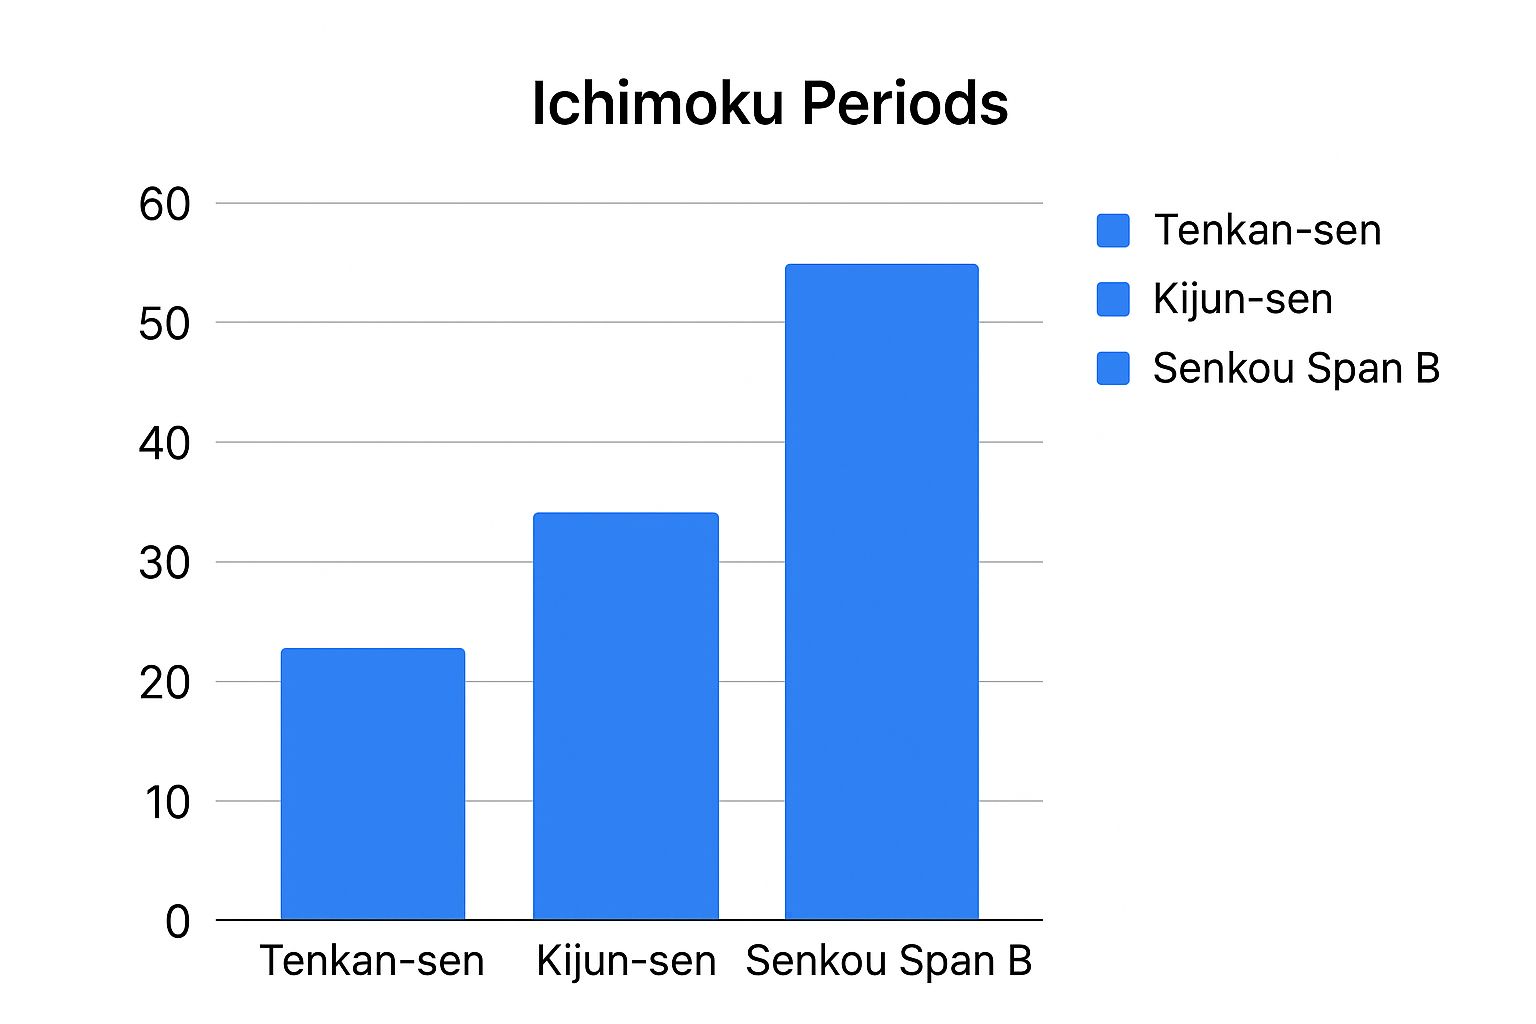
As the infographic shows, the Senkou Span B (52) has the longest lookback period, making it the slowest-moving and most significant baseline in the system.
Before we dive into tweaking parameters for different markets, let's look at how the standard settings compare and where you might consider making adjustments.
Ichimoku Settings Comparison Across Different Markets
Optimal parameter settings for various asset classes and timeframes
| Market Type | Tenkan-sen | Kijun-sen | Senkou Span B | Best Timeframe | Notes |
|---|---|---|---|---|---|
| Forex (Majors) | 9 | 26 | 52 | 4-Hour, Daily | The standard settings work exceptionally well due to the 24/5 trading nature of the market. |
| Stocks (Equities) | 7 | 22 | 44 | Daily, Weekly | Some traders adjust to a 5-day trading week (7, 22, 44) instead of the original 6-day (9, 26, 52). |
| Cryptocurrencies | 10 | 30 | 60 | 6-Hour, Daily | The 24/7 market often benefits from slightly longer periods to smooth out weekend volatility. |
| Commodities (Gold, Oil) | 9 | 26 | 52 | Daily | Standard settings are very effective, as these markets have long-established trends. |
| Intraday (All Markets) | 20 | 60 | 120 | 5-min, 15-min | For faster timeframes, traders often double or triple the standard inputs to reduce noise. |
This table gives you a starting point for experimentation. The goal isn't just to change the numbers but to find settings that best capture the trend and momentum for the specific asset and timeframe you are trading.
Integrating Tools and Setting Alerts
While the Ichimoku system is a beast on its own, some traders like to pair it with a momentum oscillator like the Relative Strength Index (RSI) for an extra layer of confirmation. The trick is to keep it simple and avoid "analysis paralysis" from adding too many indicators. If you do add an RSI, keep its display clean in a separate pane below your main price chart.
Finally, a truly professional setup works for you even when you aren't at your desk. Most platforms let you set up alerts for key Ichimoku events. I highly recommend setting notifications for:
- Price crossing above or below the Kumo.
- A fresh Tenkan-sen/Kijun-sen cross.
- The Chikou Span clearing past price action.
These alerts turn your chart from a passive analysis tool into an active trading assistant, making sure you never miss a potential setup that aligns with your trading plan. This isn't about making your charts look pretty; it's about building an efficient, professional-grade trading environment that fosters disciplined decisions.
Spotting High-Probability Setups That Actually Pay Off
A successful Ichimoku Cloud strategy comes down to one crucial skill: telling the difference between a textbook signal and a genuine, high-probability setup. Anyone can see one line cross another, but a profitable trader learns to spot the specific market conditions that make a signal worth trading. This is where you move beyond the basics and start recognizing patterns in a real-world context, where the alignment of all five Ichimoku components is what truly matters.
The most powerful setups often kick off with a Kumo breakout. This is when the price makes a decisive move and closes either above or below the cloud, hinting at a shift from a balanced market to a new trend. But not all breakouts are the same. A weak breakout might just see the price crawl out of a very thin cloud before losing steam and reversing. A strong breakout, on the other hand, is an explosive move out of a thick cloud, showing that a serious amount of buying or selling pressure has taken over.
Reading the Momentum of a Breakout
The initial breakout is just the start. To be sure the move has genuine momentum, you need to see what the other Ichimoku elements are doing. A top-quality setup will show a "three-line" confirmation, where the price, the Tenkan-sen (Conversion Line), and the Kijun-sen (Base Line) are all stacked up in the direction you want to trade.
For a bullish setup, here’s what that looks like:
- Price is trading clearly above the Kumo.
- The Tenkan-sen has crossed above the Kijun-sen.
- The future Kumo is also bullish (Senkou Span A is above Senkou Span B) and ideally getting thicker.
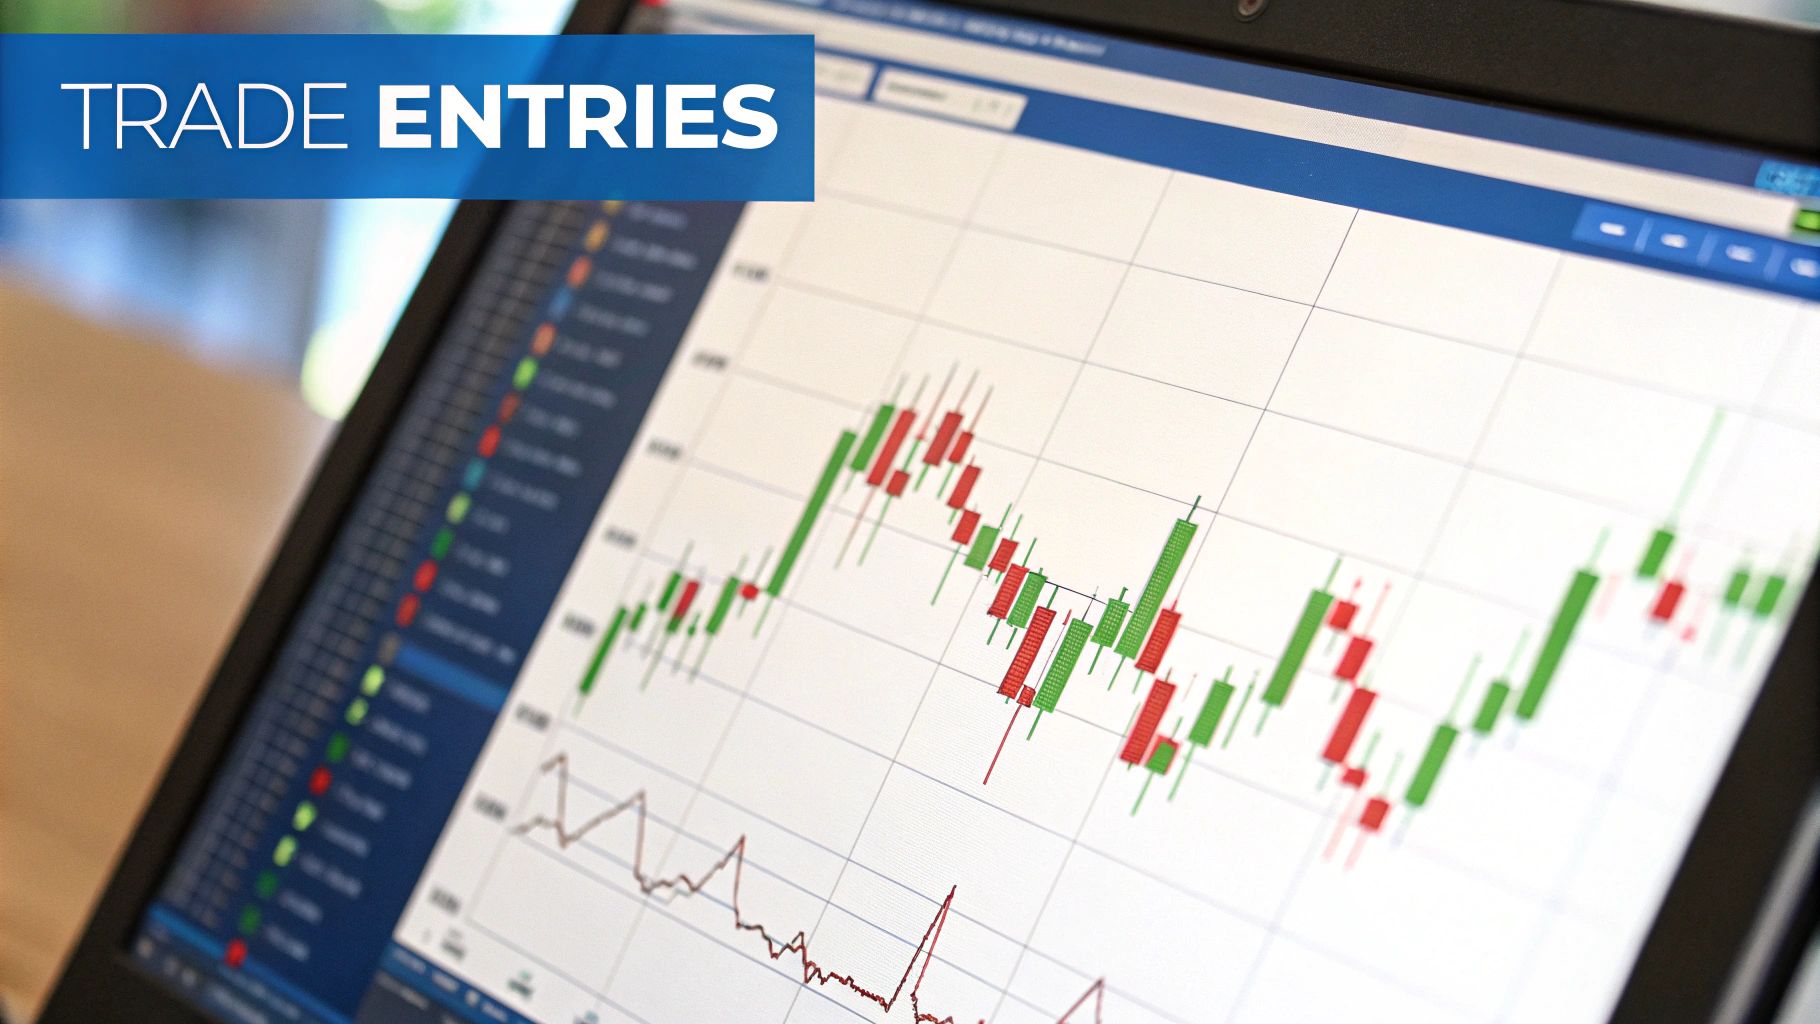
This chart is a perfect example of a strong bullish Kumo breakout where everything aligns for a high-probability long entry.
You can clearly see the price punching through the cloud, followed by the Tenkan-Kijun cross. The future Kumo is also green and expanding, which projects continued strength.
The opposite holds true for bearish setups. Waiting for this kind of confluence is a great way to filter out those "head-fake" moves that trap traders who jump in too early. The thickness of the future Kumo is another subtle but vital clue. A thick, rising future cloud suggests there’s strong support for the new uptrend, giving you more confidence to stay in the trade.
The Ultimate Confirmation: The Chikou Span
Many traders, especially when they're new to Ichimoku, make the mistake of ignoring the Chikou Span (Lagging Span). This is a huge mistake. The Chikou Span is your final, non-negotiable confirmation—the system's built-in fact-checker. Since it plots the current closing price 26 periods in the past, it tells you how today's price stacks up against the price action from about a month ago (on a daily chart).
A high-probability buy signal is only truly solid when the Chikou Span is trading above the price from 26 periods ago and has open space in front of it, with no price candles in its way. This shows that the current momentum is strong enough to have broken past recent resistance. On the flip side, if you see a bullish breakout but the Chikou Span is stuck under past price action, that's a major red flag that the move might not have enough power. If you're interested in building a solid trading framework, take a look at our guide on 8 high-probability trading setups to boost your trading.
By patiently waiting for all the pieces to fall into place—the Kumo breakout, the Tenkan-Kijun cross, and the Chikou Span confirmation—you seriously stack the odds in your favor. This methodical process is the heart of a professional Ichimoku Cloud strategy. It turns the indicator from a confusing jumble of lines into a clear roadmap for finding trades that are actually worth your time and capital.
Risk Management Strategies That Protect Your Capital
Great entries might get all the glory, but smart risk management is what keeps you in the trading game long enough to see profits. This is where successful traders really set themselves apart from the crowd. A solid Ichimoku cloud strategy isn’t just about nailing the perfect breakout; it’s about protecting your capital when the market inevitably turns against you. Without a disciplined risk plan, even the clearest signals can lead to a busted account.
It's time to move past the generic "risk 1% of your account" advice. To trade Ichimoku effectively, you need to tailor your risk to the specific setup you see on the chart. Not all signals carry the same weight, and your position size should reflect that reality.
Dynamic Stop-Loss Placement: Working With the Cloud
One of the quickest ways to lose money with Ichimoku is by using a tight, arbitrary stop-loss. This indicator is built on zones of support and resistance, not exact price levels. Placing a stop just a few pips away from your entry is practically asking to be shaken out by normal market fluctuations. Instead, let the Ichimoku components themselves be your guide for stop placement.
Here are a few practical ways I like to set my stops:
- For Kumo Breakouts: When I take a long trade after the price breaks above the Kumo, I’ll often place my initial stop-loss just below the Senkou Span B line. For an uptrend, this is the bottom edge of the cloud. It represents a major historical equilibrium point and frequently acts as a powerful support level.
- For Trend-Following Trades: If you’re jumping into an already established trend, the Kijun-sen is your go-to line. In a strong uptrend, it's common for the price to pull back to the Kijun-sen before continuing its climb. Setting your stop just below this line gives your trade room to breathe without risking too much of your profit.
- For Aggressive Entries: On a quick Tenkan-Kijun cross entry, the Tenkan-sen can act as a very tight, initial trailing stop. Be warned, though—this approach is best suited for fast-moving markets and requires a lot of experience to manage effectively.
This dynamic method ensures your risk is defined by the market’s actual structure, not a random number.
Adjusting Position Size Based on Signal Strength
Just as your stop-loss should be dynamic, your position size should be too. A strong breakout from a thick, well-established Kumo is a much higher-confidence signal than a breakout from a thin, twisted cloud. It only makes sense to risk more on the better setup.
To put this into practice, you can create a simple grading system for your trades:
- A+ Setup (Full Position): All Ichimoku elements are perfectly aligned. The Kumo is thick and supportive, the breakout is decisive, and the Chikou Span is clear of any price obstacles. On a setup like this, I might risk my standard 1%.
- B Setup (Half Position): Most signals look good, but there's a minor flaw. Maybe the Kumo is a bit thin, or the Chikou Span is about to run into some resistance. In this scenario, I’d cut my risk in half, to just 0.5% of my capital.
- C Setup (No Trade): The signals are contradictory, and the cloud is flat or choppy. This is a clear sign to stay on the sidelines and wait for a better opportunity.
This approach forces you to be more selective, allocating your risk capital only to the highest-probability trades.
To help you structure your own rules, here’s a table outlining how you might adjust risk parameters based on what the market is doing.
Risk Management Rules by Market Condition
Recommended risk parameters for different market environments
| Market Condition | Max Risk Per Trade | Stop Loss Placement | Position Size | Exit Strategy |
|---|---|---|---|---|
| Strong Trend | 1% | Below Kijun-sen or Senkou Span B | Full | Trail stop with Kijun-sen; take partial profits at key levels |
| Weak Trend | 0.5% | Below recent swing low or opposing side of a thin Kumo | Half | Set a fixed price target; be quick to take profits or break even |
| Ranging/Choppy | 0.25% or No Trade | Outside the range boundaries (wide) | Quarter or None | Exit at the opposite side of the range; avoid trading inside the Kumo |
| High Volatility | 0.75% | Wider than usual, below major support/resistance | Reduced | Use a volatility-based stop (e.g., ATR multiple) |
This table provides a framework for staying disciplined. Remember, your goal is to ensure your biggest losses don't come from your weakest trade ideas.
Protecting your capital is a deep topic, and if you want to explore more proven strategies, check out this detailed guide on mastering day trading risk management. Trading is a game of probabilities. Your ability to manage drawdowns—and embrace small, controlled losses as a sign of discipline—is what will ultimately define your success.
Real Performance Data: What This Strategy Actually Delivers
It’s easy to get excited about perfect chart setups, but the real test of any trading approach is how it performs over the long run with real money on the line. So, let's pull back the curtain and talk about the numbers. The Ichimoku Cloud strategy is often praised for its ability to catch trends, but what does that actually mean for your bottom line? The honest answer is: it depends heavily on the market you’re trading.
An Ichimoku Cloud strategy isn’t a magic bullet that prints money in every market condition. It’s a trend-following system, which means it thrives in markets with clear, sustained direction and tends to struggle in choppy, sideways environments. This is not just a theoretical claim; backtesting data provides a clear picture of its strengths and weaknesses across different asset classes.
A Tale of Two Markets: Where Ichimoku Excels and Where It Falters
To get a concrete idea of performance, let's look at some hard data. One comprehensive backtest examined the strategy's performance using default parameters across a variety of assets, revealing a fascinating story of mixed results. For a highly volatile and trend-driven asset like Bitcoin, the Ichimoku Cloud strategy produced an impressive compound annual growth rate (CAGR) of 78.05%, significantly outperforming a simple buy-and-hold return of 59.8%. This is a classic example of Ichimoku catching and riding a powerful trend.
However, when applied to the S&P 500, the strategy’s CAGR was 5.2%, slightly underperforming the buy-and-hold benchmark of 6.9%. This difference highlights a key takeaway: the strategy’s effectiveness is directly tied to an asset’s tendency to trend. You can explore the complete breakdown of these results and learn more about the quantitative findings of this Ichimoku strategy backtest.
The results for the Nasdaq QQQ ETF offer another interesting insight. While the strategy’s 7.7% CAGR was just below the 7.92% buy-and-hold return, the system was only invested in the market about 63% of the time. This suggests increased capital efficiency, as the strategy kept traders on the sidelines during less favorable, choppy periods, effectively delivering a higher return for the time it was exposed to risk. This ability to filter out noise is one of its most underrated features.
Understanding Drawdowns and Win Rates
Beyond just returns, risk management metrics are where this strategy often shines. The same backtest showed that for midcap equities (MDY ETF), the strategy managed to reduce the maximum drawdown by over 50% compared to buying and holding. This means that while it might not have beaten the overall return, it did so with significantly less portfolio pain, which is crucial for staying in the game long-term.
Here’s a simplified breakdown of what you can generally expect:
- Win Rate: For a well-executed trend-following Ichimoku Cloud strategy, win rates often hover between 40% and 55%. This might sound low, but it's not the whole story.
- Risk-to-Reward Ratio: The goal isn't to win every trade. It's to make your winning trades significantly larger than your losing trades. A successful Ichimoku trader aims for risk-to-reward ratios of 1:2, 1:3, or even higher, allowing a sub-50% win rate to be very profitable.
- Performance in Trending Markets: In strongly trending markets (like growth stocks in a bull run or cryptocurrencies), the strategy is designed to capture the majority of a large move, leading to outsized gains.
- Performance in Ranging Markets: In sideways, choppy markets, the strategy will likely produce a series of small, frustrating losses. Recognizing these conditions and staying out is a key skill.
While analyzing the Ichimoku Cloud's specific performance metrics is crucial, broader insights into your overall investment success can be gained through effective portfolio analysis tools. These tools can help you see the bigger picture and understand how this strategy fits within your entire financial plan. Ultimately, the raw data shows that the Ichimoku Cloud strategy is a powerful tool for certain market types, but it demands realistic expectations and a deep understanding of its limitations.
Next-Level Techniques: Modern Enhancements That Work
One of the most effective enhancements is a disciplined approach to multi-timeframe analysis. This technique involves checking a higher timeframe (like the daily or weekly chart) to get the big picture on the primary trend. Then, you zoom into a lower timeframe (like the 4-hour or 1-hour chart) to pinpoint your entry and exit points.
For instance, if the daily chart shows a strong bullish trend with the price way above a thick, green Kumo, you should only be hunting for bullish setups on your 4-hour chart. This could mean looking for Kumo breakouts or Tenkan-Kijun crosses to the upside. This simple alignment keeps you from fighting the larger market momentum.
Dynamic Position Sizing and Algorithmic Execution
Another powerful technique is dynamic position sizing, which is based on the strength of the trading signal. Instead of risking the same fixed percentage on every trade, you can adjust your position size based on the quality of the setup. A breakout from a thick, well-established cloud is a much stronger signal than a breakout from a thin, twisted cloud. By committing more capital to your A+ setups and less to B-grade ones, you naturally give more weight to your highest-probability trades.
This is where algorithmic approaches can offer some great insights. You don't need to be a coding expert, but understanding how automated systems use Ichimoku can improve your manual trading. Algorithmic strategies can execute trades based on a precise set of rules—for example, buying only when the price, Tenkan-sen, and Kijun-sen are all above the cloud and the Chikou Span is unobstructed. Studying these rule-based systems can help you build more discipline into your own trading plan.
The Rise of AI and Machine Learning
The combination of classic indicators and artificial intelligence is opening up new possibilities for traders. Recent studies show how machine learning can be applied to an Ichimoku cloud strategy to improve its performance. For example, a 2025 study paired Ichimoku signals with a machine learning algorithm called XGBoost to identify subtle patterns in price behavior.
The model dynamically adjusted its positions, allocating 50% of its capital on an initial signal and adding more on later confirmations. This method refined entries and exits beyond what traditional analysis alone could achieve. This fusion of classic technical analysis and modern data science represents an exciting frontier. You can explore the full details and learn more about these machine learning findings and their impact on Ichimoku.
By layering these advanced techniques onto your existing knowledge, you can evolve your Ichimoku trading from a static set of rules into a dynamic, adaptable strategy that’s better equipped for the challenges of modern markets.
Your Complete Ichimoku Implementation Roadmap
Knowing the theory is one thing, but turning it into a profitable trading plan is where the real work begins. A solid Ichimoku cloud strategy isn’t just about spotting chart patterns; it’s about building a professional routine around how you execute, manage, and review your trades. Whether you're in the markets for hours or weeks, this framework will give you the structure to start applying what you've learned right away.
Getting good with Ichimoku takes patience, but you can definitely speed up the learning process with a structured approach. Instead of trying to master every single signal at once, break it down into manageable milestones.
Your First 90 Days: A Realistic Timeline
Jumping straight into live trading with a new, complex indicator is a recipe for disaster. Instead, give yourself a 90-day ramp-up period to build confidence and skill methodically.
- Month 1: Observation and Paper Trading. Your only job this month is to get a feel for the indicator's rhythm. Spend your time identifying Kumo breakouts, Tenkan-Kijun crosses, and Chikou Span confirmations without a single dollar on the line. Log at least 50 paper trades, noting every detail of the setup, your entry, and the eventual outcome.
- Month 2: Live Trading with Micro-Risk. Now it's time to feel the heat, but with a tiny position size. Risk no more than 0.25% of your capital per trade. The goal here isn't to get rich; it's to experience the psychological pressure of having real money at stake. Keep logging your trades and focus relentlessly on following your rules.
- Month 3: Scaling Up and Refining. If you've proven you can stick to your plan, it's time to increase your risk to a more standard 0.5% - 1% per trade. This is where you'll start fine-tuning your exit strategies and learning to tell the difference between an A+ setup and a mediocre one.
Essential Daily Routine and Checklist
Consistency is the key to long-term success in trading. Before the market even opens, running through a simple checklist can prepare you mentally and help you spot the best opportunities for the day.
Pre-Market Checklist:
- Higher Timeframe Analysis: What’s the big picture? Check the daily and weekly charts. Is the price trading above or below the Kumo? This tells you the primary trend you should be aligning with.
- Identify Key Levels: On your main trading chart, mark the current locations of the Kijun-sen and the Senkou Span B. These are your most important dynamic support and resistance zones for the session.
- Scan for Setups: Are any assets getting close to a Kumo breakout? Has there been a recent Tenkan-Kijun cross that confirms the larger trend?
- Check the News: Are there any major economic reports or events scheduled? High-impact news can cause unexpected volatility and throw technical setups off course.
This simple roadmap creates a repeatable process for finding, executing, and managing your trades. To make this process even more efficient, a powerful tool like ChartsWatcher can help you scan the entire market for these specific Ichimoku setups, ensuring you never miss a high-probability opportunity.
