
Insights from ChartsWatcher
How to Use Stock Screeners: Build a Clear, Repeatable Scan
A stock screener turns a research question into a shortlist. Start with the type of stock you want to investigate, choose a few measurable conditions, and check what each result actually means. Passing a screen is not a recommendation to buy.
Reviewed September 17, 2026.
Start with a question, not a collection of indicators
“Which stocks are unusually active this morning?” is a useful screening question. “Which stocks will go up?” is not something a screener can establish.
For intraday research, separate three decisions:
- Universe: which prices, markets, and securities belong in your research?
- Activity: how much trading must be happening, over which interval?
- Event or condition: do you want stocks currently meeting criteria, or a notification when something happens?
In ChartsWatcher, a toplist describes matching stocks; an alert reports a configured event. See price alerts versus scanner alerts before choosing your starting point.
Build a small example screen
Suppose your hypothetical research list should contain stocks priced between $10 and $50, with at least 500,000 shares traded during the selected daily period and elevated recent activity. These numbers illustrate configuration, not recommended trading thresholds.
| Condition | Example setting | What to verify |
|---|---|---|
| Price | $10–$50 | The field is a share price, not market capitalization |
| Absolute volume | Minimum 500,000; daily period | Which session the total covers |
| Relative volume | Minimum 200%; five-minute timeframe | This is a candle comparison, not full-day relative volume |
ChartsWatcher’s relative-volume filter compares the current candle with the average of the previous fifteen candles. A reading of 200% means twice that average. An unfinished candle can change before it closes.
If your question concerns activity accumulated by the current time of day, use the separate same-time relative-volume metric. Do not substitute one definition for the other.
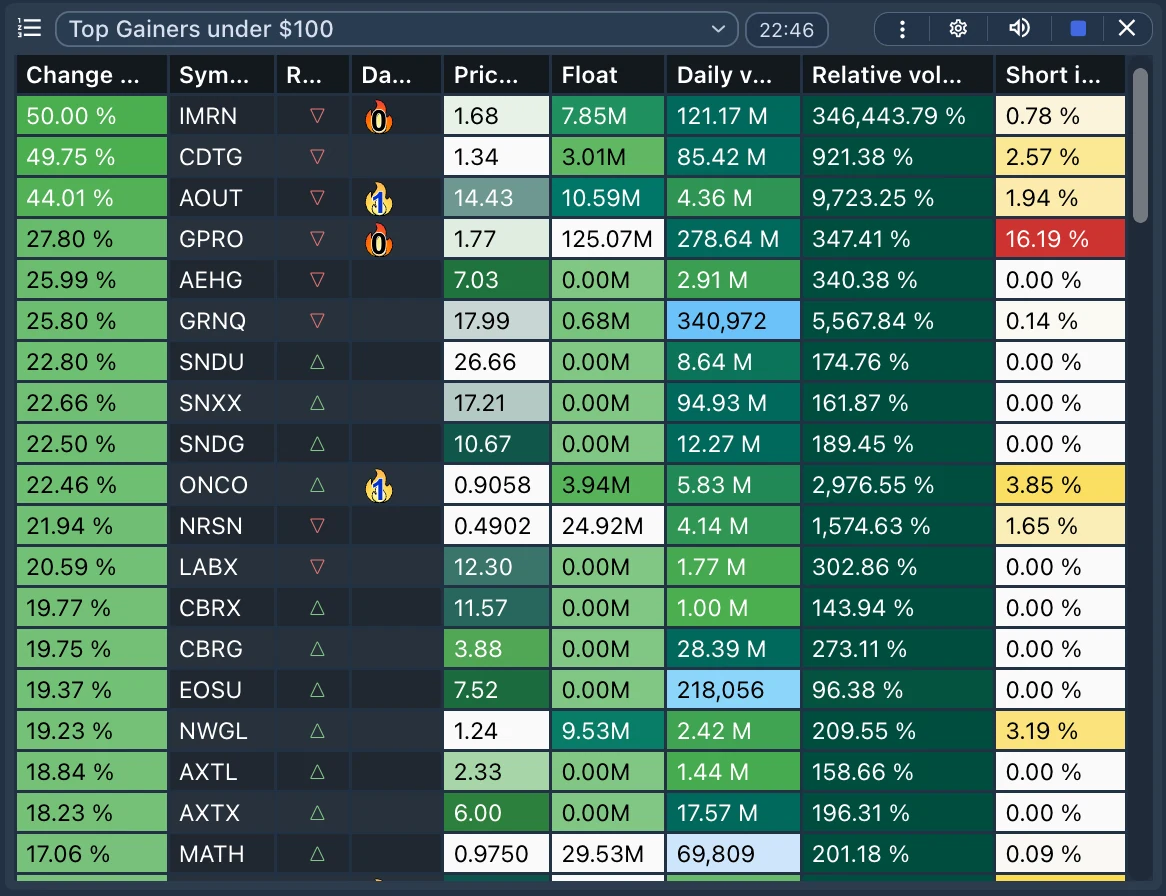
Interface illustration; not a live result from the example settings.
Inspect results before adding more filters
Review a handful of matching symbols. Check the chart, recent news, bid–ask spread, and whether the activity is sustained or concentrated in one candle. A large share count alone does not guarantee easy execution.
If the list is empty, remove one condition at a time. Check units, minimum and maximum bounds, session coverage, and data freshness. A minimum of 200 in a percentage field is not the same as entering 2. Our empty-scanner checklist covers these checks in detail.
If the list is too broad, tighten the condition that directly answers your research question. Adding unrelated indicators can hide useful candidates without improving the quality of the shortlist.
Save a process you can review
Record the settings, observation time, and why each candidate did or did not fit. Change one rule at a time so you can understand its effect. Historical testing and subsequent observation can expose weak assumptions, but neither guarantees future returns.
Start with the free scanner directory, then use the unusual-volume workflow to develop a more specific research process.
Educational information only. Scanning identifies conditions; it does not establish a profitable trade.