How to Read Options Chain: A Guide for Smarter Trades
When you first pull up an options chain, it can look a lot like you've stumbled upon a secret code. But it's far simpler than it looks. Just think of it as a detailed, real-time menu for every options contract available for a particular stock.
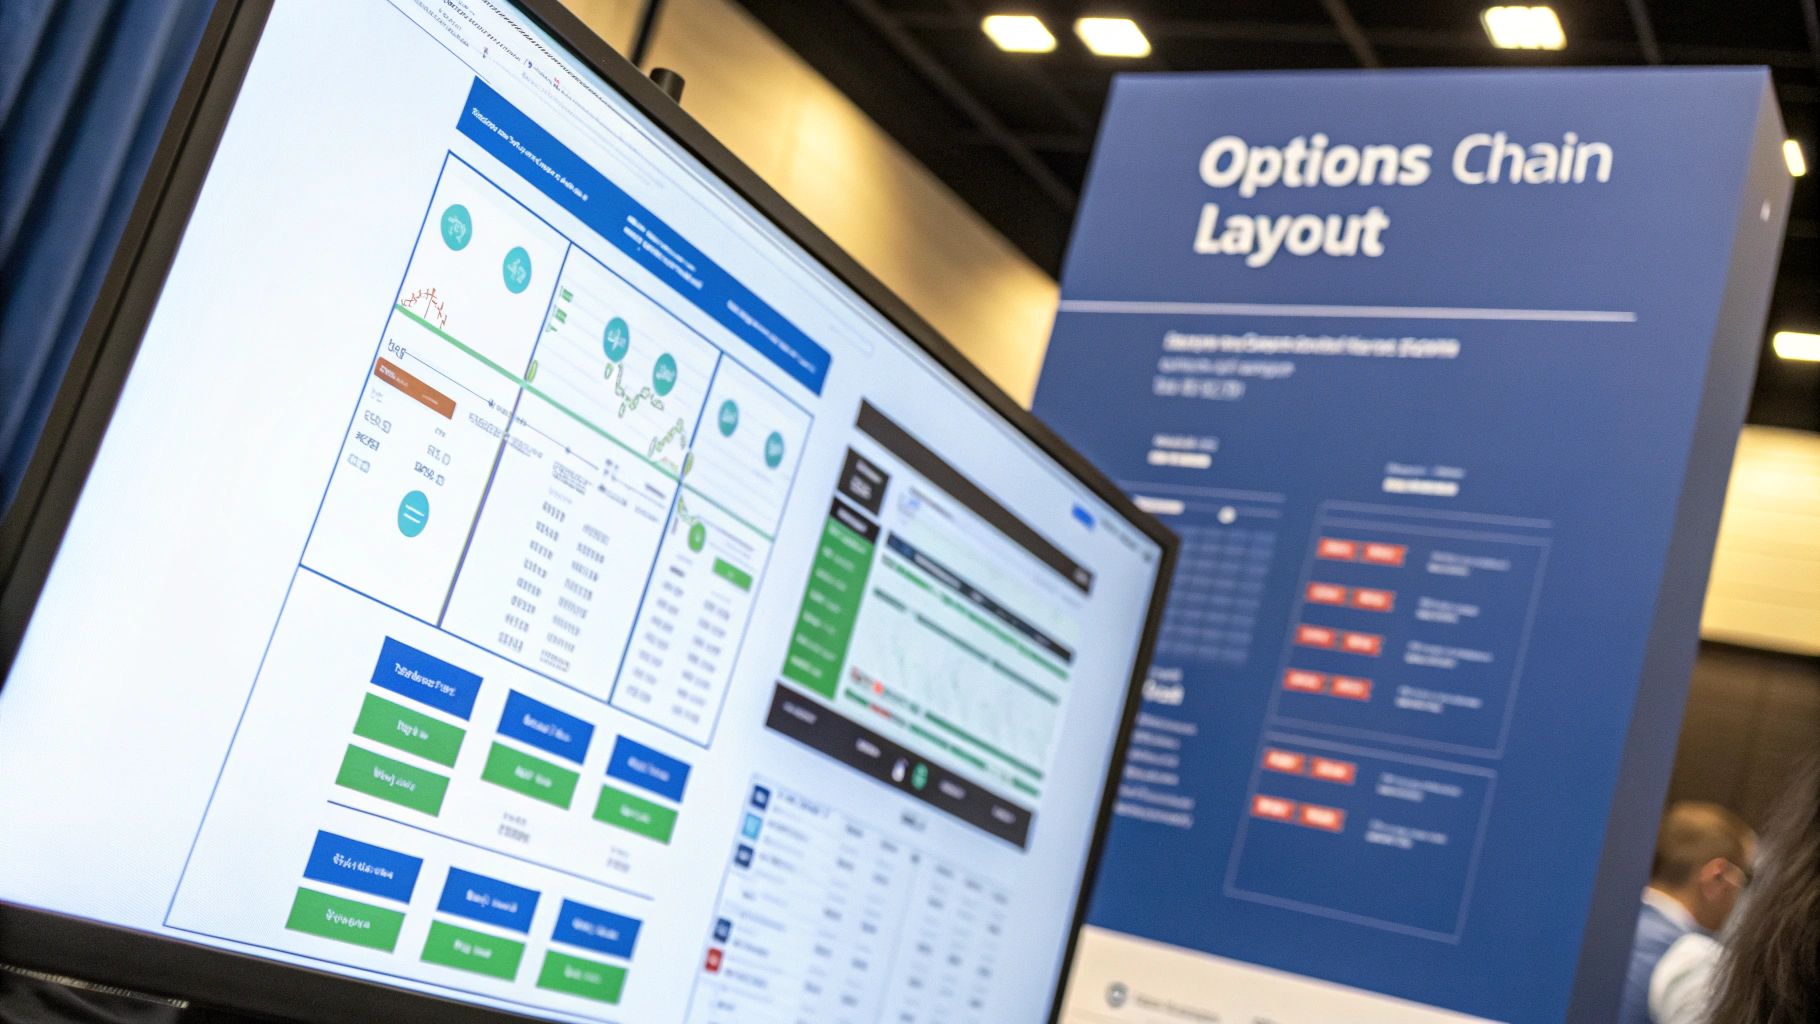
Getting the basic layout down is the first step. Once you do, navigating platforms like ChartsWatcher becomes second nature.
The entire grid is organized around two fundamental choices, usually displayed side-by-side:
- Call Options: These give you the right (but not the obligation) to buy the stock at a set price. You'd trade calls if you're bullish and think the stock's price is headed higher.
- Put Options: These give you the right to sell the stock at a set price. Puts are your go-to when you're bearish and expect the stock's price to drop.
The Backbone of Every Trade
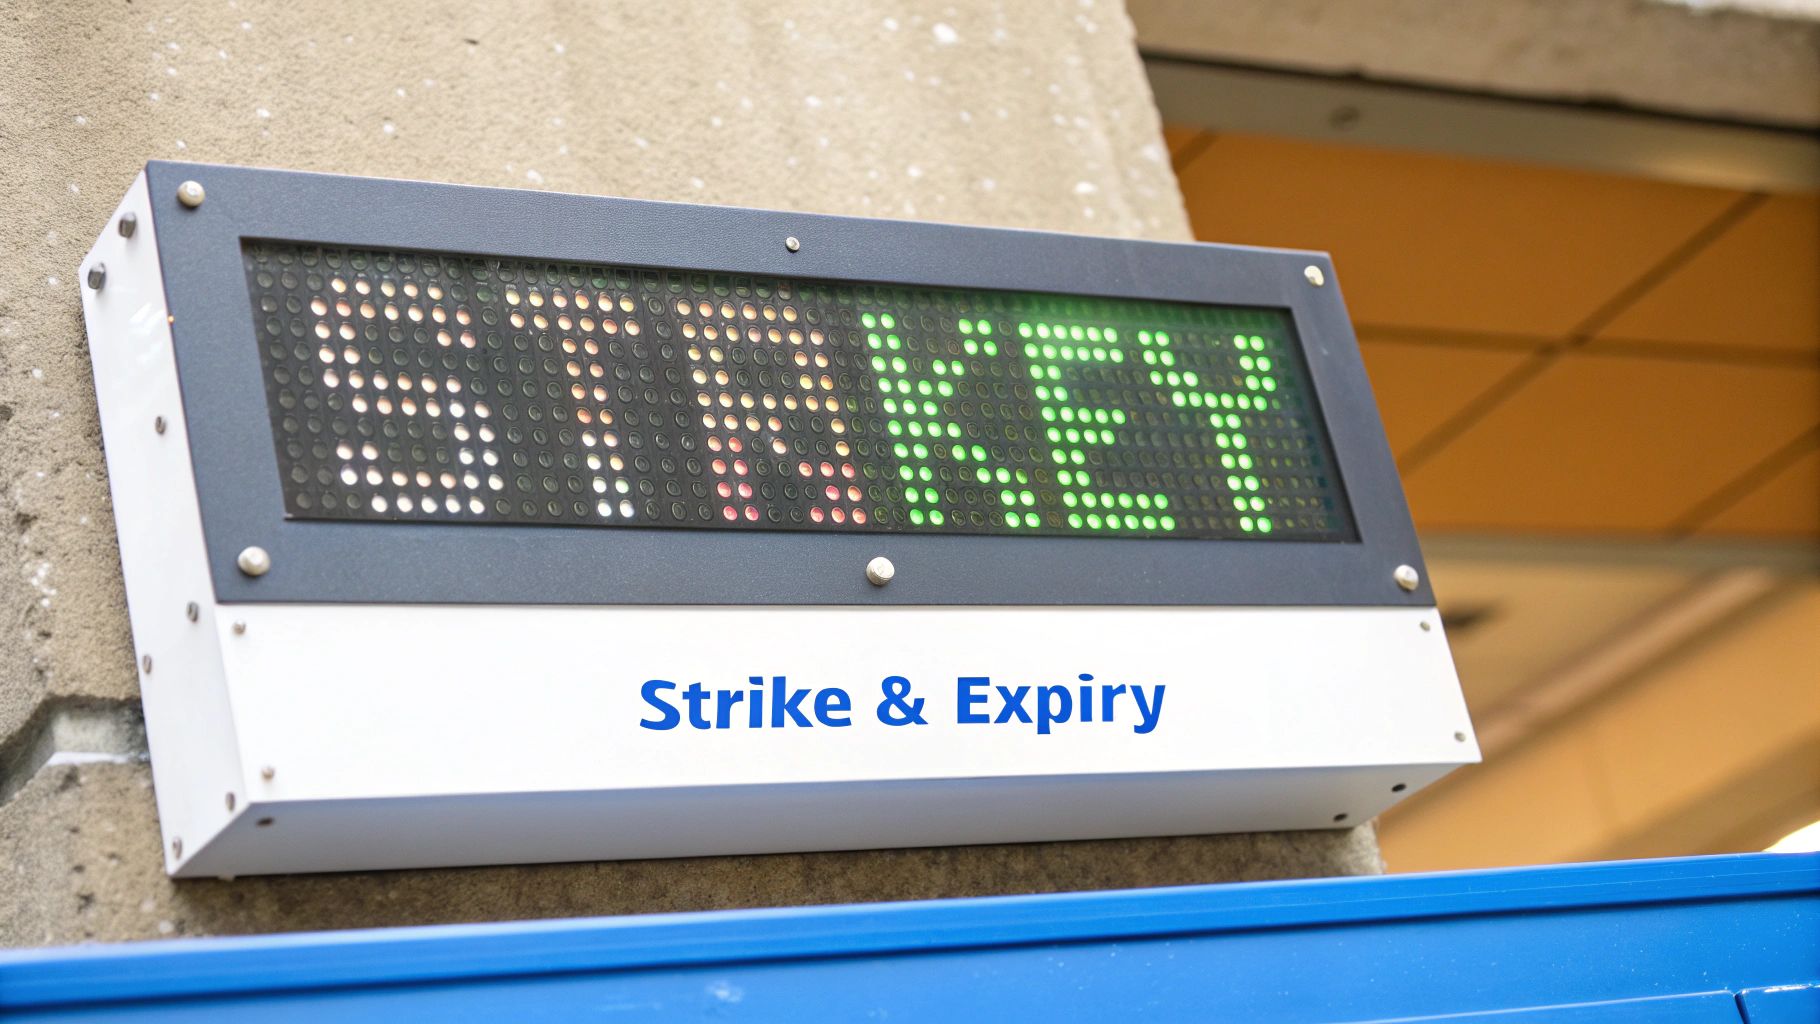
Right down the middle of the chain, you'll see the strike price column. This lists all the predetermined prices at which you can buy or sell the underlying stock. Fanning out from that central column are all the different expiration dates you can choose, from just a few days away to more than a year out.
These two components—the strike price and the expiration date—are the absolute backbone of every single options trade you'll ever make.
Before you ever place a trade, it's a good idea to get a feel for the market's activity. For instance, the Chicago Board Options Exchange (Cboe) might report that over 2.6 million index option contracts changed hands in a single afternoon. This kind of data isn't just trivia; it gives you a live snapshot of market sentiment.
When you see a huge number of puts being traded, it can signal that traders are looking for downside protection. A spike in call volume, on the other hand, suggests bullish bets are piling up. Metrics like volume and open interest show you exactly which contracts are the most active, helping you steer clear of illiquid options that have painfully wide spreads.
To make sense of it all, let's break down the main columns you'll encounter. While every platform has a slightly different layout, these core components are universal.
Key Components of an Options Chain at a Glance
This table covers the essential metrics you'll find in any options chain. Understanding what each one represents is crucial for making informed, strategic decisions.
| Component | What It Tells You | Why It Matters |
|---|---|---|
| Strike Price | The price at which the option can be exercised (buy/sell the stock). | This is the central pillar of your trade. It determines whether your option is in-the-money, at-the-money, or out-of-the-money. |
| Expiration Date | The final day the options contract is valid. | Time is a critical factor. Shorter expirations are riskier but cheaper; longer expirations give your trade more time to work out but cost more. |
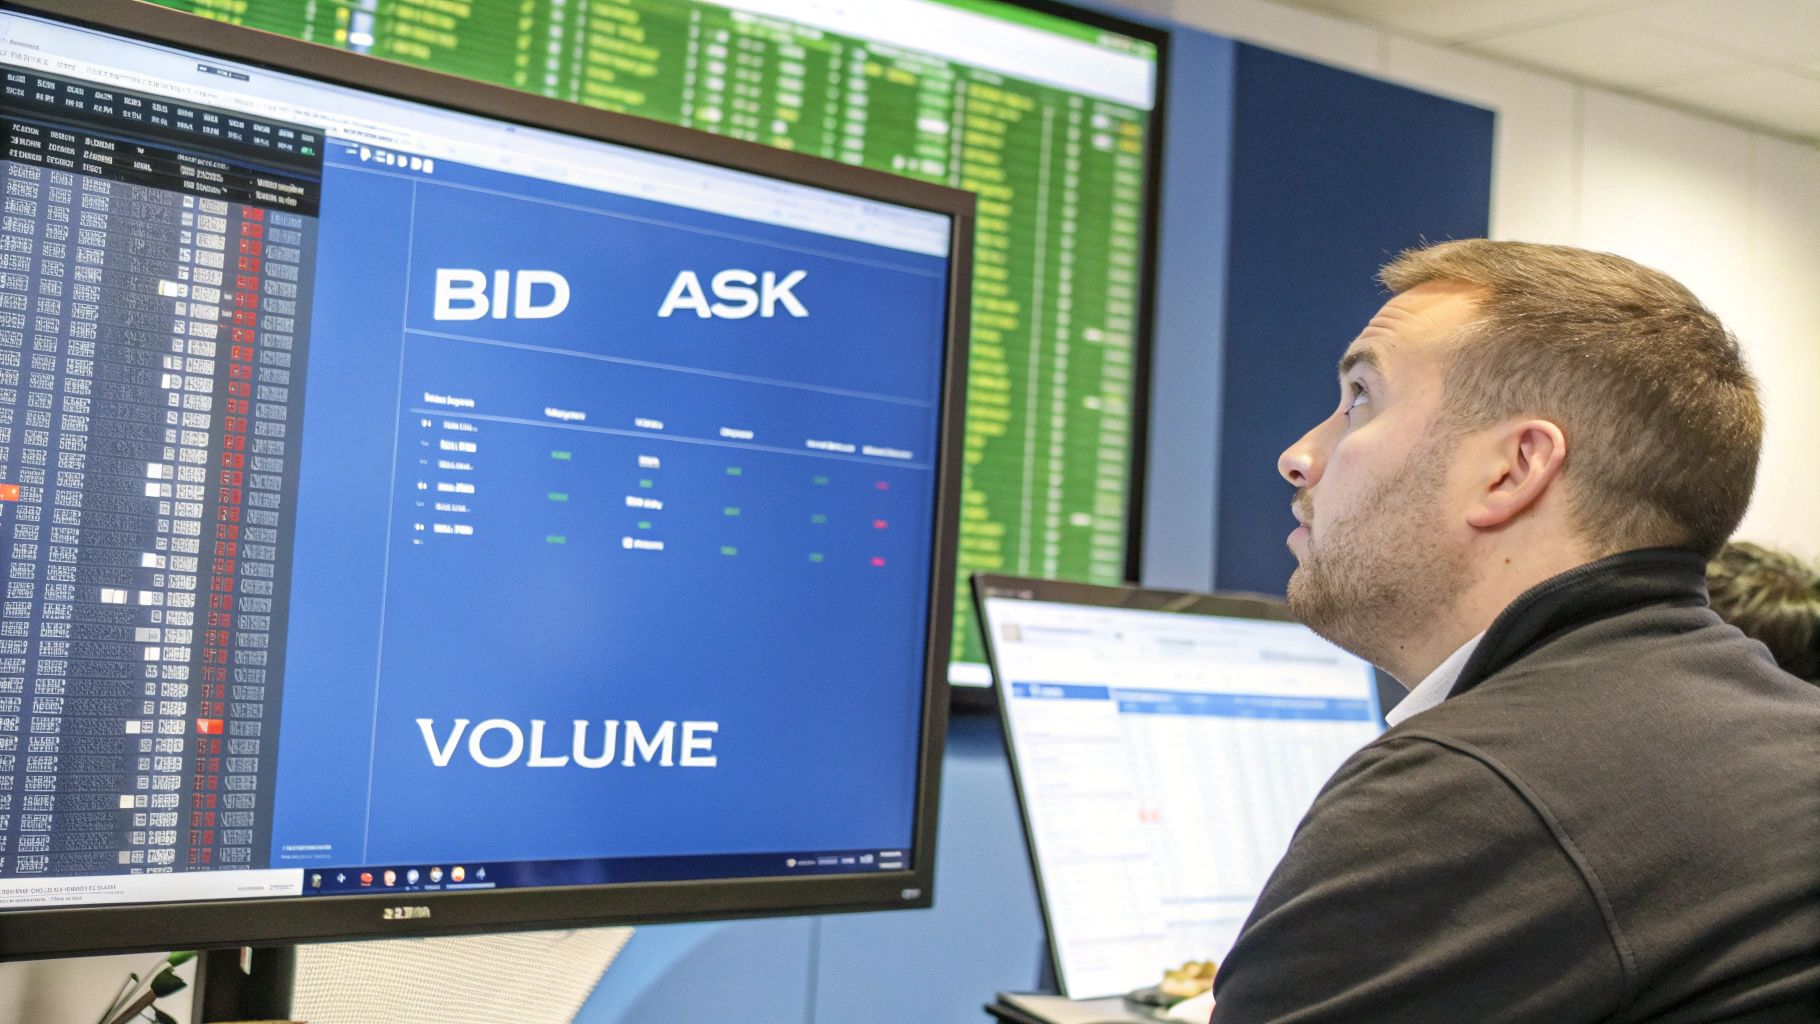
| Bid/Ask | The current highest price a buyer will pay (Bid) and the lowest price a seller will accept (Ask). | The difference, or spread, shows the option's liquidity. A tight spread means it's heavily traded; a wide spread can make it costly to enter and exit. |
| Last Price | The price at which the most recent trade for that contract occurred. | It gives you a quick reference point for the contract's most recent valuation, but the Bid/Ask is more important for current pricing. |
| Volume | The total number of contracts traded during the current session. | High volume indicates strong current interest and better liquidity. It tells you how active a specific contract is today. |
| Open Interest | The total number of outstanding contracts that have not yet been settled or closed. | This shows the depth of the market for that contract. High open interest signals that many traders have positions, which usually means better liquidity. |
Knowing these components isn't just about reading data; it's about interpreting the story the market is telling. A contract with high volume and high open interest is where the real action is.
Finding Your Trade Strike Price and Expiration
Alright, now that you've got the basic layout down, we can get into the strategic part of reading an options chain. This is where the magic happens. Your focus boils down to three interconnected pillars: the strike price, the expiration date, and the option's "moneyness." These three elements work together, defining the entire risk and reward profile of your potential trade.
The strike price is your anchor. It’s the predetermined price where you lock in the right to buy (for a call) or sell (for a put) the underlying stock. Think of it as your entry point—it’s the foundation for figuring out your breakeven price and potential profit.
Choosing the Right Expiration Date
Next up is deciding how much time you need for your trade to play out. Options chains will show you contracts expiring in just a few days (weeklies) all the way out to over a year away (LEAPs). Making this choice is a constant battle against an invisible force that traders call time decay, or Theta.
- Weekly Options: These are cheap and can offer huge returns on short-term moves. The catch? Their value melts like an ice cube on a hot sidewalk, making them a high-risk gamble if your timing isn't perfect.
- Monthly or Longer-Dated Options: These contracts are more expensive because you're literally buying more time. They're less sensitive to the daily noise of the market and give your trade thesis a much longer runway to come true, but they do require more cash upfront.
A classic rookie mistake is buying too little time just to save a few bucks on the premium. If you think a stock will make a move over the next month, buying a weekly option is a recipe for disaster. You could be right about the stock's direction but still lose your entire premium to time decay.
The expiration date you pick directly sets how much premium you'll pay and how fast that premium will evaporate.
Understanding Your Option's Moneyness
Finally, you tie it all together with "moneyness." It's just a simple way to describe where the strike price is in relation to the stock's current price. Most trading platforms, including ChartsWatcher, highlight this, often using colors to make it obvious at a glance.
Moneyness falls into three simple buckets:
- In-the-Money (ITM): These options already have intrinsic value. For a call, the stock price is above the strike. For a put, the stock price is below the strike. They are the most expensive but are also considered the safer bets.
- At-the-Money (ATM): The strike price is sitting right around the current stock price. These options are extremely sensitive to even small moves in the stock.
- Out-of-the-Money (OTM): These options have zero intrinsic value; they're pure speculation on a future price move. A call is OTM if the stock is trading below the strike, and a put is OTM if it's trading above it. They're the cheapest and carry the most risk.
Let's use a real-world example. Imagine a tech stock is trading at $152 right before its earnings report. A bullish trader, feeling aggressive, might buy an OTM call with a $155 strike that expires in two weeks. It’s a cheap contract, but the stock needs to make a significant jump just to break even.
On the other hand, a more conservative trader might buy an ITM call with a $145 strike. They'll pay a much higher premium, but they’re buying a higher probability of success. The options chain lets you see both of these scenarios side-by-side, helping you weigh the cost, risk, and potential reward in seconds.
Reading Market Sentiment with Volume and Open Interest
Alright, let's move beyond the basics like strike prices and expiration dates. Two of the most revealing columns on any options chain are Volume and Open Interest. Getting a feel for these numbers is like learning to read the market's body language—it tells you where the real money is flowing and where traders are placing their bets.
Think of it this way: a great price on an option is useless if you can’t get your order filled without a ton of slippage. Volume and Open Interest are your guides to an option's liquidity and the collective mood of other traders.
Volume is simple enough: it’s the total number of contracts for a specific option that have traded hands today. It’s the daily buzz. High volume means lots of active interest, which usually translates to tighter bid-ask spreads and a smoother entry or exit for your trade.
Open Interest, on the other hand, is the total number of contracts that are still open—positions that haven't been sold, exercised, or expired. This is a cumulative number that shows you where real capital is parked, reflecting longer-term conviction at a certain strike.
Volume Versus Open Interest
It’s easy to confuse the two, but they tell very different stories. Nailing down this distinction is crucial for reading the tape correctly.
- Volume: This is all about intraday activity. It's the story of today's trading session and resets to zero every morning.
- Open Interest: This is the total number of outstanding contracts. It’s the big picture, updated just once a day.
Here’s a practical scenario: you spot an option with massive open interest but surprisingly low volume for the day. What does that suggest? A whole lot of traders are sitting tight on their positions, likely waiting for a big move in the underlying stock.
Now, flip it. High volume but a small change in open interest often means day traders are running the show, jumping in and out of positions within the same session.
A classic rookie mistake is getting fixated on the "Last Price" column. A contract might show a recent trade, but if its volume is near zero and the bid-ask spread is a mile wide, that last price is completely irrelevant. Always, always check for healthy volume to make sure you're looking at a tradable option.
Using Data to Spot Where the Market Is Focused
Trading activity isn't spread out evenly; it's highly concentrated. For instance, on a given day, 1,727 ETFs might soak up 43% of all options volume, while a staggering 1,637 individual stocks see zero options traded. This shows you how capital and attention get funneled into a select group of highly liquid names.
This is where an options chain transforms from a price list into a serious analytical tool. A sudden, unusual spike in call volume compared to put volume can be a huge bullish flag. Conversely, a surge in puts might signal bearish bets or major players hedging their portfolios.
Learning to spot these anomalies is at the heart of reading an options chain like a pro. When you compare a contract's current volume to its recent average, you can often see where the "smart money" is quietly placing its bets right before a major price move. It's the same principle traders use when analyzing order flow and market depth to get an edge. To go even deeper on that topic, check out our guide on understanding Level 2 market data.
Decoding Implied Volatility and the Greeks
Alright, you’ve got the basic layout of the options chain down. Now it’s time to dig into the metrics that really separate the casual observers from the consistently profitable traders. We're talking about Implied Volatility (IV) and a handful of risk metrics known as "the Greeks."
These aren't just random numbers filling up the columns; they're the engine under the hood, dictating an option's price, risk, and potential reward.
Implied Volatility is easily one of the most powerful concepts you'll ever learn in options trading. In simple terms, it's the market's forecast of how much a stock's price is expected to move. A high IV tells you the market is bracing for a big swing, which pumps up the price of options. On the other hand, a low IV suggests things are expected to stay calm, making options relatively cheap.
Think of it like buying insurance right before a hurricane is scheduled to make landfall. As the storm gets closer, the perceived risk skyrockets, and so do the insurance premiums. IV works the same way. It often spikes just before major events like earnings announcements or big company news, inflating the price of both calls and puts. Understanding this can save you from overpaying for options right when the hype is at its peak.
Meet the Greeks: Your Risk Management Toolkit
Beyond IV, every options chain worth its salt will show you the Greeks. These are calculations that measure how sensitive an option’s price is to different factors. Don't get scared off by the math—let's just focus on what they actually do for you as a trader.
Here are the main Greeks you need to know and what they're telling you:
-
Delta: This is your price sensitivity gauge. It shows how much an option's price should move for every $1 change in the underlying stock. A Delta of 0.60 means your option's premium will increase by about $0.60 if the stock pops up by $1. It's a quick way to gauge an option's directional exposure.
-
Theta: This is the silent killer of option value—time decay. Theta shows you how much value an option loses every single day as it ticks closer to expiration. If your option has a Theta of -0.05, it's losing five cents of its value each day, all else being equal. It’s a constant headwind for option buyers.
-
Vega: This one measures an option's sensitivity to changes in Implied Volatility. An option with a Vega of 0.10 will see its price jump by ten cents for every 1% rise in IV. This is a huge deal around news and earnings, where IV can expand and contract rapidly.
-
Gamma: This metric shows you the rate of change of Delta. It tells you how much an option's Delta will change for every $1 move in the stock. Gamma is at its highest for at-the-money options that are close to expiring, making them incredibly responsive but also packing a lot of risk.
Understanding the Greeks is like having a full dashboard for your trade. It lets you see exactly how your position will react to shifts in price, time, and volatility. You can manage risk proactively instead of just reacting when the market moves against you.
Let’s put it into practice. Imagine you're bullish on a stock and you're staring at two different call options on the chain.
The first is a short-term, out-of-the-money contract. It has a low Delta but a sky-high Gamma and Theta. The second is a longer-term, in-the-money option. This one has a high Delta but much lower Gamma and Theta.
The first option is your classic lottery ticket—a high-risk, high-reward bet that needs a quick, explosive move to pay off. The second option is a steadier position, better suited for a gradual uptrend. The options chain, through the Greeks, lays out the precise risk profile of each choice, letting you pick the exact contract that fits your strategy like a glove.
A Practical Walkthrough of an Options Chain
Theory is great, but let's get our hands dirty with a real-world scenario. This is where the concepts really start to click—when you apply them to a live options chain.
Imagine you're watching a tech company, we'll call it InnovateCorp (Ticker: INVT), currently trading at $185 per share. They just dropped news about a groundbreaking new product, and you're feeling bullish. You think the stock has room to run over the next couple of months.
It's time to pull up the INVT options chain on a platform like ChartsWatcher and see if we can build a trade.
Setting Your Timeline and Strategy
First things first: you need an expiration date that gives your prediction time to actually happen. Since you're looking out a couple of months, grabbing a weekly option would be lighting money on fire. The time decay (Theta) would be brutal.
Instead, a contract expiring in about 90 days feels right. It gives the stock enough breathing room to move without you sweating every tick of the clock.
Now, you have to pick a strike price. This really comes down to your personal appetite for risk.
- The Aggressive Play (OTM): You could go for a $195 call. Because it's Out-of-the-Money, it's cheap. But the stock needs to make a serious move just for you to break even. This is your classic higher-risk, higher-reward bet.
- The Conservative Play (ITM): On the flip side, a $175 In-the-Money call is an option. It's more expensive since it already has intrinsic value, but it gives you a much better shot at being profitable and a lower breakeven point.
For this example, let's split the difference. A slightly Out-of-the-Money $190 call looks interesting. It’s affordable enough to not break the bank but isn't a total lottery ticket.
Verifying Liquidity and Price
Before you even think about hitting the buy button, you need to check the vital signs for that $190 call. A quick scan shows a daily Volume of 2,500 contracts traded and an Open Interest of 12,000.
Those are healthy numbers. It signals a liquid market, which means the bid-ask spread should be tight, and you won't have trouble getting in or out of the trade.
Next up is Implied Volatility (IV). The current IV is sitting at 35%. Is that a good deal or are you overpaying for the option? To figure that out, you need some historical context.
This infographic breaks down the simple but critical process of using IV to guide your strategy.
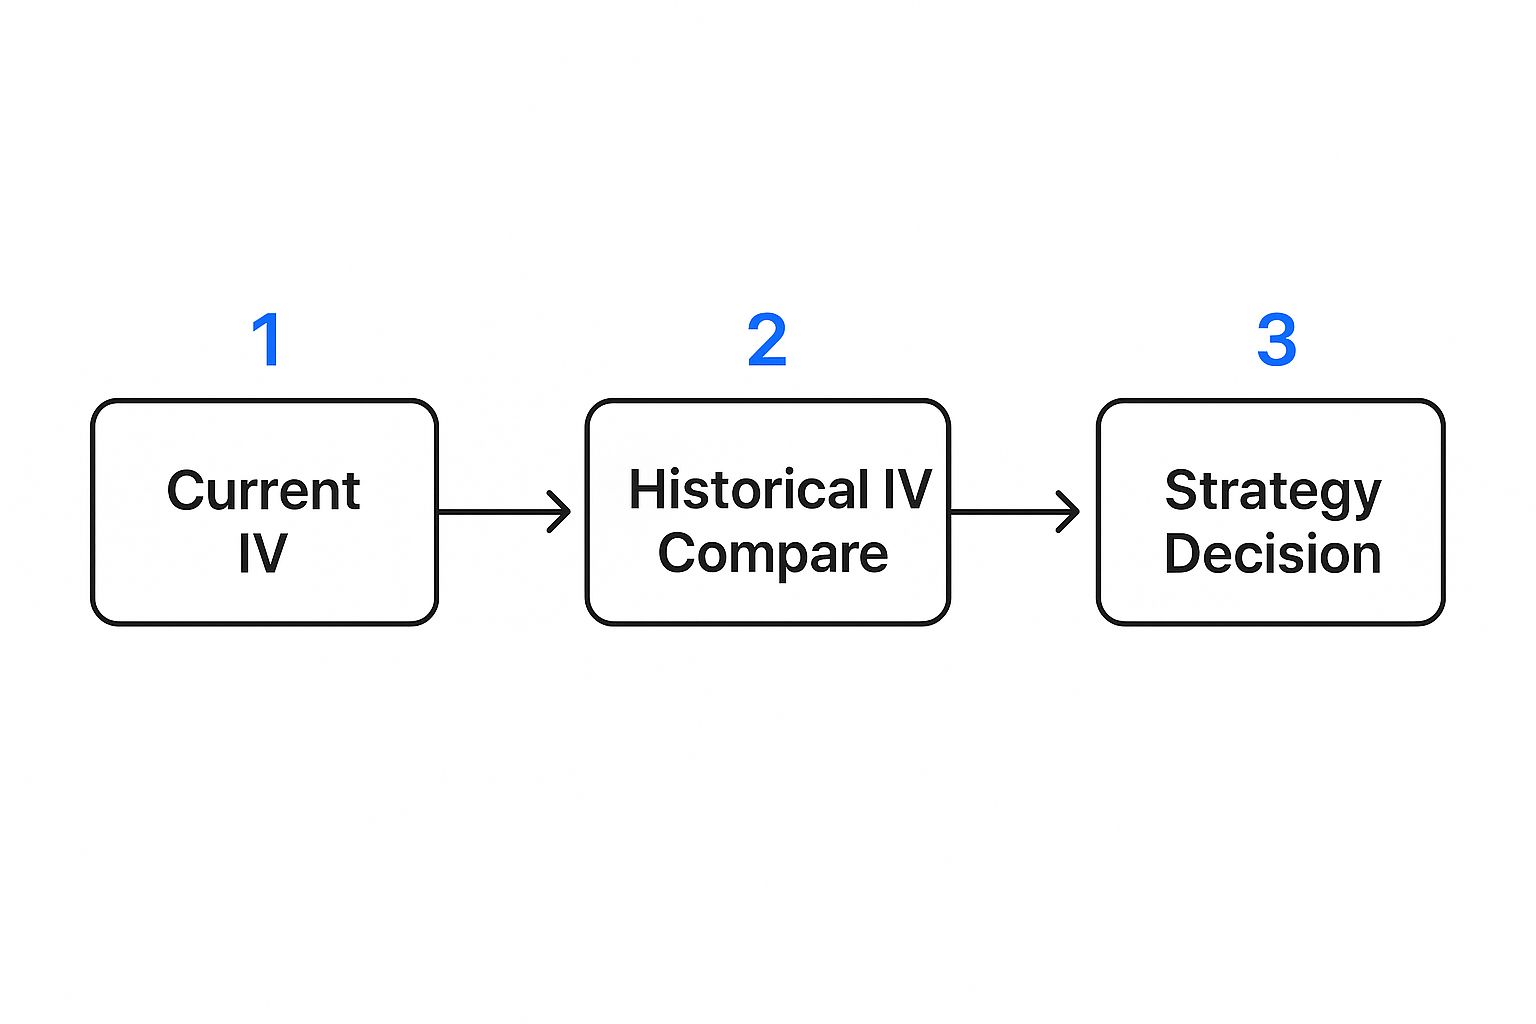
As the diagram shows, you don't just look at the current IV in a vacuum. You have to compare it against its past levels to judge if options are cheap or expensive, which in turn helps you decide what kind of trade to put on.
Making the Final Decision
Let's say you discover that INVT's historical IV has bounced between 25% and 60% over the last year. At 35%, the current IV is clearly on the lower end of its range. This suggests the option's premium isn't jacked up, making a long call strategy much more appealing.
Finally, you give the Greeks a quick once-over. The $190 call has a Delta of 0.45. What does that mean? For every $1 the stock price moves up, your option's value should increase by about $0.45. This is a key piece of information for calculating your potential profit and managing how much capital you put into the trade.
This whole process—from picking an expiration date to analyzing the Greeks—is how a trader transforms that overwhelming grid of numbers into a clear, actionable idea. It’s a repeatable framework you can use on any stock, at any time.
With over 1.6 million unique US equity option symbols created since 2013 across 18 different exchanges, having a structured approach is non-negotiable. Mastering this skill turns the options chain from a source of data overload into your most powerful analytical tool. If you want to dive deeper into the charts themselves, check out our complete guide for beginner investors on how to read stock charts.
Common Questions About Reading Options Chains
As you start spending more time with options chains, the theoretical knowledge gives way to practical questions. These are the "what if" scenarios and real-world quirks that trip up new traders. Let's walk through some of the most common hurdles you'll encounter so you can build confidence and troubleshoot on the fly.
Why Is the Bid-Ask Spread So Wide on Some Options?
A wide bid-ask spread is the market's way of screaming "low liquidity!" It’s a dead giveaway that very few buyers and sellers are active in that specific contract right now.
You can always confirm this suspicion by glancing over at the Volume and Open Interest columns. If those numbers are tiny—or even zero—you know the market for that option is thin. Trading these is a bad idea because the spread becomes a hidden cost; you'll likely overpay to get in (at the ask) and get less than you'd like to get out (at the bid). That difference eats directly into your potential profits before the trade even gets going.
For anyone still getting their sea legs, it's far smarter to stick with contracts that have high volume and tight spreads. This ensures you can get in and out of your positions smoothly and at fair prices.
What Does It Mean When an Option Shows No Bids?
Seeing a bid price of $0.00 is a massive red flag. Don't ignore it. It means that, at this very moment, there isn't a single person in the entire market willing to buy that option from you. At any price.
This usually happens with contracts that are ridiculously far Out-of-the-Money (OTM) or are just a few hours away from expiring completely worthless. The probability of them ever becoming profitable is practically zero. You might find a seller willing to take your money for one, but turning around and selling it later could be impossible.
Avoid options with no bids like the plague. If you can't sell your contract, you're stuck. This locks in a 100% loss of whatever premium you paid, simply because there's no exit door.
How Do I Use the Options Chain for Different Strategies?
The options chain is your playbook, regardless of the strategy you’re running. The only thing that changes is which columns you prioritize.
-
Looking to run a Covered Call? You’ll scan the 'call' side for a strike that's a bit Out-of-the-Money. Your eyes should go straight to the Bid price—that’s the premium you'll collect. Then, you'll want to check the Delta to get a rough estimate of the odds of the stock actually hitting that price by expiration.
-
Selling a Cash-Secured Put? Now you’re on the 'put' side, looking for an OTM strike at a price where you’d genuinely be happy to own the stock. Again, the Bid price tells you exactly how much income you'd generate on your collateral while you wait.
In both cases, your final check should always be on Volume and Open Interest. This confirms the market is liquid enough for you to trade efficiently without getting burned by a wide spread.
Which Expiration Date Should I Choose?
This is one of the most critical decisions you'll make, and it hinges entirely on your trade thesis. There’s no universal "best" answer, only what’s right for your specific forecast.
Short-term expirations, like weeklies, are cheaper and more sensitive. But they suffer from brutal time decay (Theta). This makes them a tool for capitalizing on quick, explosive price moves you expect to happen now.
Longer-term expirations, like monthlies or even LEAPs, will cost you more premium upfront. The tradeoff? They give your trade more breathing room to develop and are less affected by day-to-day market noise.
A solid rule of thumb is to align your expiration date with your prediction's timeline. If you believe a big catalyst will move the stock in the next two months, choose an expiration date well beyond that event to give your thesis time to play out.
Ready to stop just reading the data and start using it to find your edge? With ChartsWatcher, you get a powerful, real-time platform where you can customize your view of the market. Track options chains, set precise alerts, and analyze charts all in one place.
