How to Read Bid and Ask Size to Master Market Liquidity
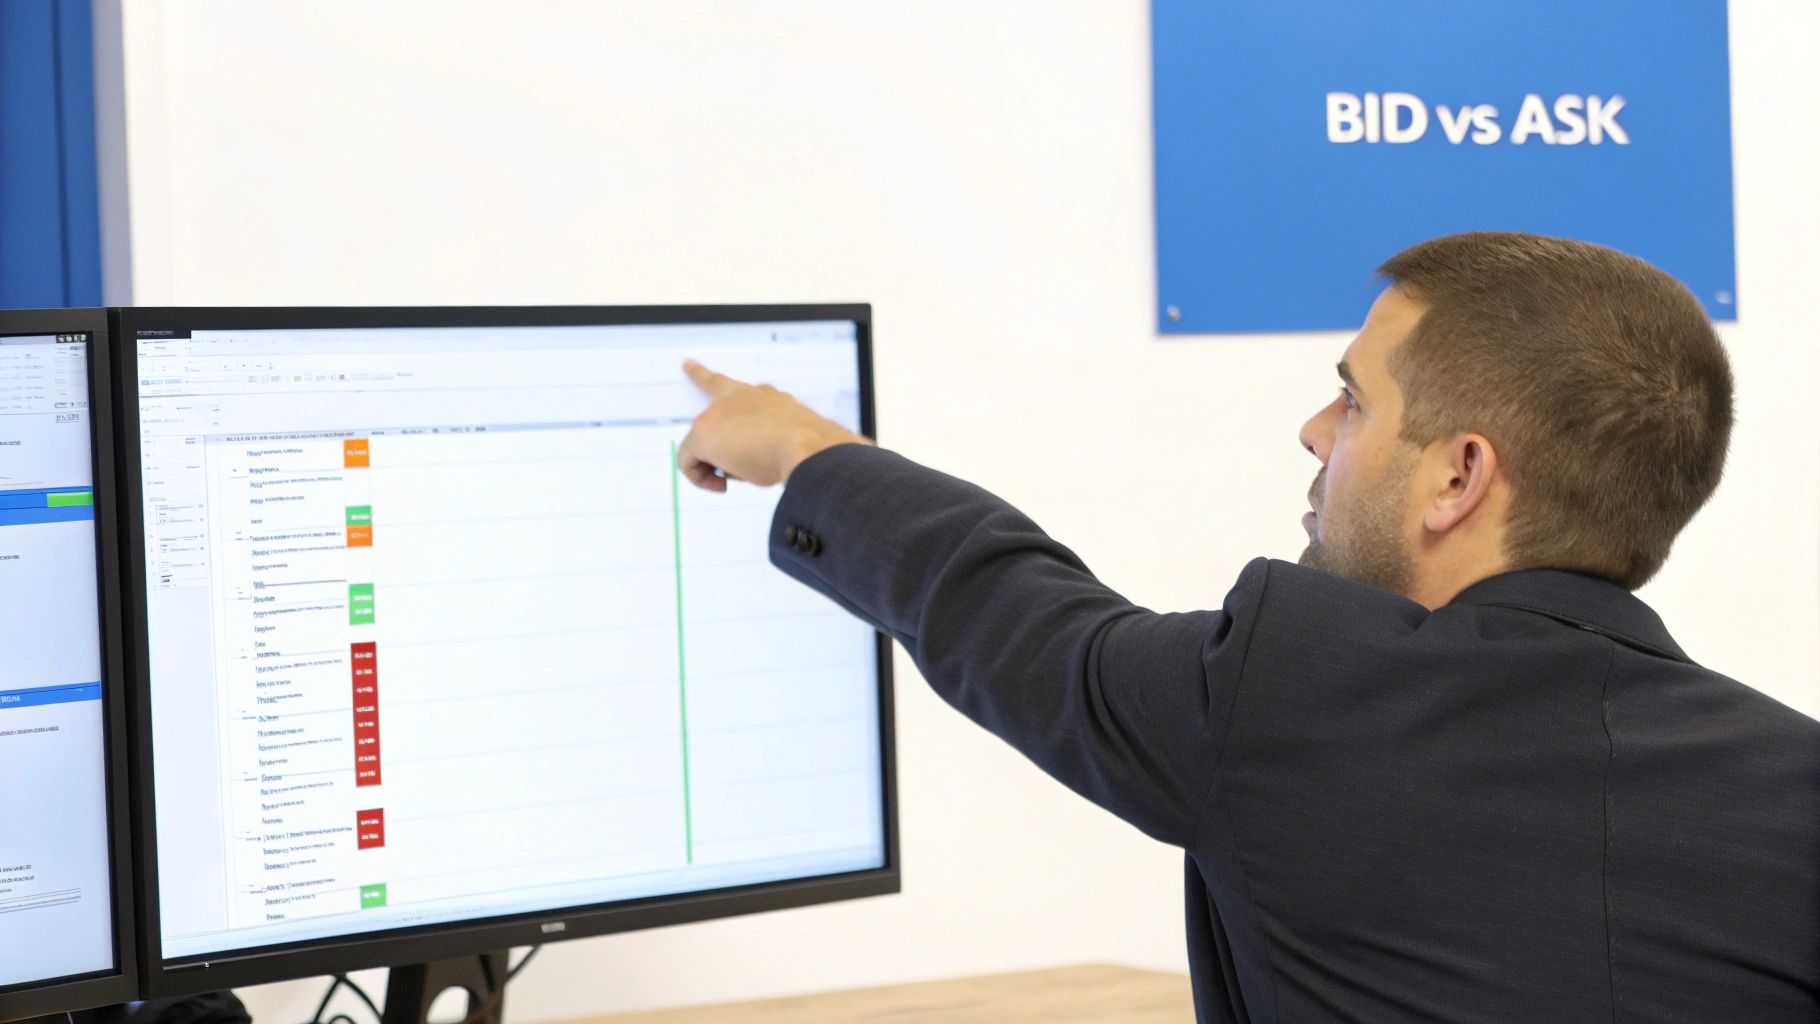
When you pull up a stock chart, the price you see is just the tip of the iceberg. Beneath the surface, there's a constant tug-of-war between buyers and sellers, and the real story is told by the bid size and the ask size.
The bid size is the total number of shares that buyers are ready to purchase right now at a specific bid price. Think of it as the visible demand. On the flip side, the ask size represents the total number of shares sellers are offering at a specific ask price—the visible supply.
These two numbers show you the depth of the market's order book in real-time.
Decoding the Market's True Intentions
Looking at a stock's price without considering the bid and ask size is like watching a silent movie. You see the action, but you miss the dialogue. These sizes reveal the conviction behind the price.
Imagine a live auction. The bid price is what someone is shouting they'll pay. The bid size tells you how many people are lined up behind them, ready to pay the same. It's the difference between one interested buyer and a crowd.
Likewise, the ask price is what sellers are hoping to get, but the ask size shows you just how much inventory they're trying to move. Is it one seller with a small lot, or a massive wall of shares waiting to be sold? This data gives you an immediate, powerful snapshot of supply and demand.
To break it down even further, here’s a quick comparison:
Bid vs Ask Size at a Glance
This table breaks down the fundamental differences between bid and ask size and what each side represents in the market.
| Concept | Bid Size | Ask Size |
|---|---|---|
| Who is it? | Buyers (Demand) | Sellers (Supply) |
| What does it represent? | The number of shares people want to buy at a specific price. | The number of shares people want to sell at a specific price. |
| What does a large size suggest? | Strong buying interest or a potential support level. | Heavy selling pressure or a potential resistance level. |
| Market Action | A trader wanting to sell immediately will hit the bid. | A trader wanting to buy immediately will hit the ask. |
Understanding this simple dynamic is the first step to reading the order book like a pro.
The Power of Level 2 Data
While a basic stock quote (Level 1) shows you the single best bid and ask price, the real magic happens when you look at Level 2 data. This is where you see the entire order book stacked up.
Level 2 data brings bid and ask sizes to life, showing you the quantity of shares waiting at multiple price levels. This is how you spot where support and resistance are forming before they show up on a chart.
A huge stack of orders on the bid side acts like a "demand wall," often stopping a stock from falling further. Conversely, a massive ask size creates a "supply wall" that can put a lid on any rally. For traders, these are critical, real-time clues about the market's short-term mood.
For example, in a liquid stock like Apple (AAPL), it's not uncommon to see bid sizes of 10,000 shares or more at key levels during busy trading hours. On the other hand, during major events like the March 2020 crash, bid sizes on S&P 500 stocks reportedly collapsed by an average of 45% intraday as sellers completely overwhelmed the buyers. You can dig into historical data like this using resources for bid and ask sizes from Kibot.
Key Takeaway: The bid and ask size transform the price from a static number into a dynamic measure of buying and selling pressure. It is the first and most critical layer of analysis for understanding market liquidity and order flow.
Why This Matters for Traders
Getting a handle on this concept is your first real step toward reading the market's mind. When you can see the balance—or, more importantly, the imbalance—between buyers and sellers, you can start anticipating price moves with much greater confidence.
This knowledge helps you:
- Gauge Market Liquidity: See how easily you can get in and out of a trade without dramatically moving the price.
- Identify Support and Resistance: Spot where large orders are clustered, creating obvious price floors and ceilings.
- Confirm Trading Signals: Use a sudden shift in size to validate a breakout or breakdown on your chart.
By looking beyond the price and incorporating the bid and ask size into your analysis, you stop guessing and start seeing what the big players are actually doing. It’s a genuine edge.
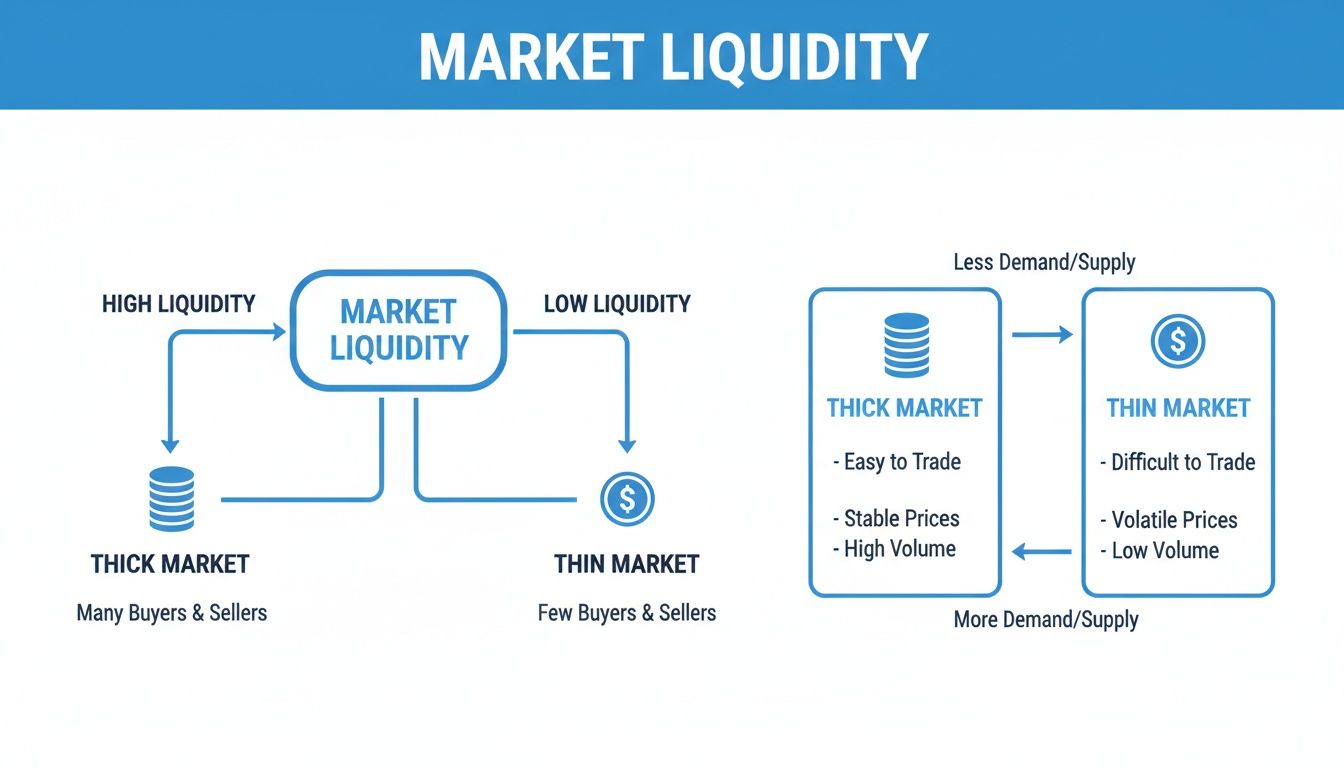
Gauging Market Liquidity Through Size
Understanding the numbers on your screen is one thing, but translating them into a real-time assessment of the market’s health is what gives a trader an edge. The bid and ask size are your go-to tools for gauging liquidity—which is really just a fancy way of asking, "How easily can I buy or sell this thing without knocking the price around?"
Think of it like a real-world marketplace. A market with deep, active liquidity is like a bustling city square packed with thousands of buyers and sellers. You can move a ton of product without anyone really noticing or changing the going rate. We call this a "thick" market.
Now, imagine a deserted roadside stand with one seller and maybe one person kicking the tires. A single large purchase could wipe out their inventory and send the price soaring. That’s a "thin" market—unstable and risky.
Differentiating Thick and Thin Markets
A thick market is easy to spot: you'll see large and consistent bid and ask sizes. For a blue-chip stock, it's not uncommon to see thousands of shares available on both sides of the order book across several price levels. This depth gives you the confidence to execute a sizable trade with minimal slippage, which is the painful difference between the price you thought you’d get and the price you actually got.
On the flip side, a thin market will show tiny sizes, often just a few hundred shares, on the bid and ask. Small-cap stocks and less-traded ETFs are famous for this. Trying to jump in with a large order here is a recipe for disaster. You could easily chew through all the available shares at the current price, forcing the rest of your order to be filled at progressively worse prices and pushing the market against you.
Key Insight: Analyzing bid and ask size before you trade is a crucial risk check. A thick market offers stability and a clean entry or exit. A thin market screams higher volatility and the potential for costly slippage.
How Size Signals Stability and Risk
The stability you get from a thick market is a huge part of risk management. When you see a massive wall of bids stacked up below the current price, it’s acting as a strong support level. It would take a tremendous amount of selling to chew through all that demand, giving your long position a valuable buffer if things turn sour.
Conversely, a large ask size acts as resistance. This wall of supply can put a lid on any upward price movement, signaling that it’s going to take some serious buying power to break through to higher levels. For a deeper dive into how these levels form, check out our guide on what market depth is and how to read it.
Here’s a practical look at how this plays out:
- Blue-Chip Stock (e.g., MSFT): You might see a bid size of 5,000 shares and an ask size of 4,500 shares. This signals deep liquidity. A trader could buy or sell 1,000 shares and barely make a ripple.
- Volatile Small-Cap Stock (e.g., XYZ): The bid size might be a measly 200 shares with an ask size of 300 shares. If you tried to dump 1,000 shares here, you’d blow through the entire bid and watch the price collapse as your order fills at lower and lower levels.
This contrast becomes even more critical in highly leveraged markets like futures. During moments of extreme stress, the bid and ask sizes tell a dramatic story. For example, historical tick-by-tick data shows that during the 2018 Volatility Spike, the average bid size for E-mini S&P 500 futures shot up to 1,200 contracts as buyers desperately tried to prop up the market. At the same time, ask sizes swelled to 950 contracts amid a frantic rush to hedge. You can explore more of these fascinating historical futures data patterns on Tickdata.com.
By taking just a few seconds to assess the bid and ask size, you can get an immediate feel for an asset’s underlying stability. This simple check helps you avoid the classic trader’s trap of getting into a position you can’t get out of, grounding your strategy in the market's real-time reality.
Spotting Hidden Institutional Order Flow
If you really want to understand what's happening in the market, you have to look beyond the surface. The bid and ask size don't just tell you about general liquidity; they offer a rare window into the world of institutional players—the whales of the market. While retail traders might just hit "buy" or "sell," the big funds have to be much more careful. They're trying to move huge positions without tipping their hand and sending the price screaming in the wrong direction.
But here's the secret: even when they're trying to be sneaky, they leave footprints. Their sophisticated order types create distinct, recognizable patterns in the order book. If you know what to look for, you can start to see what the big money is really doing.
First, it’s critical to understand why institutions are so picky about where they trade. They need deep pools of liquidity to operate effectively, as shown below.
This is why they stick to "thick" markets. A thin market would be completely disrupted by their massive orders, but a thick one can absorb the volume, allowing them to get in and out with minimal price impact.
Unmasking Iceberg Orders
One of the oldest tricks in the institutional playbook is the Iceberg Order. Let's say a hedge fund wants to buy one million shares of a stock. If they just dropped that massive buy order onto the bid, everyone would see it. The price would immediately launch upward before they could even get half their order filled. Bad business.
Instead, they break it up. They'll show only a small fraction of their total order, maybe a bid for 10,000 shares. But as soon as a seller hits that bid and it gets filled, poof—another 10,000 shares instantly appear at the exact same price. This constant reloading or "refreshing" is the dead giveaway of an iceberg.
Trader's Insight: When you see a large bid or ask size that just won't go away, no matter how much volume hammers into it, you're almost certainly watching an iceberg. It signals a huge, hidden buyer or seller is defending that price with everything they've got.
Identifying Potential Spoofing
Next is a more deceptive pattern to watch out for: spoofing. This is an illegal and manipulative tactic where a trader places a large, visible order they have no intention of actually executing. Their only goal is to create a false sense of supply or demand to bait other traders.
For example, a spoofer might flash a huge bid order to create the illusion of strong support, tricking others into buying. Then, just as the price gets close enough to fill their order, they pull it. Vanished. They might even immediately flip and start selling. The tell-tale sign of spoofing is a giant bid or ask that disappears into thin air right before it's about to be tested.
To get a better handle on these order book mechanics, check out our trader's guide to Level 2 data for a deeper dive.
Witnessing True Absorption
Finally, we have absorption, which is one of the most powerful (and legitimate) events you can see in the order flow. This is when a massive, real order on the bid or ask acts like a brick wall, soaking up every single market order thrown at it without moving an inch.
Imagine aggressive sellers are dumping shares, hitting the bid over and over. But there’s a colossal bid size at a key support level that just eats up every share they can sell. That’s absorption. It’s a clear signal that a major buyer is absorbing all the selling pressure. Once the sellers are exhausted, the price often snaps back violently in the other direction. The same is true on the ask; if a giant ask wall absorbs all the buying pressure, a reversal down is often imminent.
You often see these institutional footprints most clearly during times of market stress. During the 2020 COVID lows, for instance, the average bid sizes for at-the-money SPX options exploded by 300%, jumping from around 125 contracts to over 500. That was institutions scrambling for downside protection. In fact, data shows that during major S&P drops, as much as 85% of all volume was hitting the bid—a firehose of selling being absorbed by these huge protective orders. You can dig into these kinds of patterns yourself in the CBOE's market statistics archives.
Learning to spot these patterns is a game-changer. You start to see the market not as random noise, but as a strategic chess match between its biggest players. The key is knowing how to read their moves.
Turning Bid-Ask Imbalances into Trading Signals
So far, we’ve learned how to read the raw numbers and spot the footprints of institutional players. Now, it's time to translate those observations into concrete, actionable trading signals. The most direct way to do this is by analyzing bid-ask size imbalances—a powerful tell of short-term market pressure.

Think of the order book as a classic balance scale. When the bid and ask sizes are roughly equal, the scale is level. But when one side gets significantly heavier, the scale tips, often foreshadowing the direction of the next price move.
This imbalance reveals the immediate, aggressive sentiment brewing under the surface. It’s not just about who’s present; it’s about who is more desperate to get their orders filled right now.
Calculating and Monitoring the Imbalance Ratio
To make this concept practical, we need to quantify it. We can do this with a simple ratio that compares the buying and selling interest directly.
Imbalance Ratio = Total Bid Size / Total Ask Size
A ratio of 1.0 indicates a perfectly balanced market. But the real signals, the ones that matter to us, live at the extremes. For example, a ratio of 3.0 means there are three times as many shares stacked on the bid as there are on the ask. That’s a loud and clear signal of intense buying pressure.
On the flip side, a ratio of 0.33 (or 1 divided by 3) shows that the ask size is three times larger than the bid size, signaling heavy selling pressure. This simple calculation transforms the complex, flashing numbers of the order book into a single, easy-to-read metric.
Key Takeaway: A significant bid-ask size imbalance is a direct measure of supply and demand aggression. A ratio skewed heavily toward the bid suggests buyers are in control, while a ratio skewed toward the ask points to seller dominance.
Translating Imbalances into Actionable Signals
Once you start tracking this ratio, you can build a framework for spotting potential trade entries. While there's no single magic number, most short-term traders look for ratios that show a clear, undeniable disparity.
Here are some common thresholds used to flag potential trading signals:
- Strong Bullish Signal: An imbalance ratio of 3:1 or higher (e.g., 30,000 shares on the bid vs. 10,000 on the ask). This tells you aggressive buyers are soaking up supply and could be ready to push the price higher.
- Strong Bearish Signal: An imbalance ratio of 1:3 or lower (e.g., 10,000 shares on the bid vs. 30,000 on the ask). This suggests sellers are overwhelming buyers, and the price may be poised for a drop.
- Moderate Signal: Ratios between 2:1 and 3:1 (or 1:2 and 1:3) can still be significant, especially when they pop up at key technical levels on your chart.
It's crucial to remember that what constitutes a "large" imbalance can vary by stock. A thinly traded small-cap might show wild ratios more often than a highly liquid blue-chip. The key is to get a feel for what’s normal for the specific asset you're trading.
The Critical Role of Confirmation
An imbalance signal is a powerful clue, but it's rarely enough to act on alone. Like any good indicator, it performs best when it confirms what you’re already seeing on the chart.
Think of it as the final green light for your trade idea. You need to combine the signal with other technical factors to build a high-probability setup.
A High-Probability Long Setup Example:
- Price Action: The stock pulls back to a known support level or a key moving average.
- Chart Pattern: A bullish candle pattern, like a hammer or an engulfing candle, forms right at that support.
- Imbalance Signal: You see the bid size suddenly swell to a 4:1 ratio over the ask size, showing that aggressive buyers are stepping in to defend that exact level.
In this scenario, the imbalance isn't just a random number; it’s real-time proof that your technical analysis is on the money. It shows that real buyers are actively defending the support level you identified. This convergence of signals provides the confidence needed to pull the trigger, bridging the gap between analysis and decisive action.
Weaving Size Analysis Into Your Risk Management
Smart trading isn’t about just finding the home runs; it's about protecting your capital when you're wrong. And trust me, you will be wrong. This is where weaving bid and ask size into your risk management becomes a game-changer. It shifts you from reacting to price drops to proactively managing danger before it even hits your chart.
This whole process kicks off before you even think about clicking the "buy" button: position sizing. The liquidity, staring right back at you in the bid and ask sizes, should dictate how much skin you put in the game. Jumping into a thinly traded stock with a huge position is a rookie mistake. If that trade sours, there’s simply nobody on the other side to buy your shares without the price completely collapsing on you. That’s how you get killed by slippage.
A disciplined trader always adjusts their size to the market's depth.
- Thick Markets: Big, stable bid sizes? That’s your green light for a standard position. You know you can get out if you need to.
- Thin Markets: Small, flickering bid sizes? That’s a massive warning sign. You have to dial back your position size, sometimes dramatically, to make sure you can escape cleanly.
This one simple check can keep you from getting stuck in a trade you can't get out of.
Spotting Liquidity Gaps and Red Flags
Beyond just sizing up your entry, the real-time order flow is your personal alarm system. One of the scariest things you can witness is a "liquidity gap," where the bids or asks just… disappear. Picture this: you're long a stock, it starts ticking down, and you glance at the Level 2. That solid wall of bids that gave you confidence? It's gone. Evaporated.
That, my friend, is a five-alarm fire. It means buyers have pulled their support, and there's no floor left to stop the fall. A trader watching the bid size sees this happening in the moment and can punch out immediately. The trader just watching a chart won't know what hit them until the price is already in a freefall.
Trader’s Rule: Never, ever ignore the sudden disappearance of bids below your entry or asks above your short. It’s often the very first sign that the market structure holding your trade together is crumbling.
Your Early Warning System in Action
Let's make this real. Imagine you're long a stock that's grinding up nicely above a key support level at $50. You’ve got your stop-loss tucked just below it at $49.80.
As the price drifts back down to test $50, you're watching the order book. That big, beautiful bid size of 20,000 shares that was sitting at $50 is getting chewed through by aggressive sellers. You see it drop to 10,000, then 5,000, and now it's a measly 1,000 shares. This is your early warning. That support is about to crack.
Instead of just sitting there waiting for your $49.80 stop to get steamrolled in a wave of selling, you can exit while there's still a little bit of bid support left. This proactive exit, triggered by the decaying bid size, gets you out at a better price and saves you from the waterfall of stop-loss orders that are about to get triggered the second that level officially breaks.
When you pay attention to bid and ask size, you’re not just trading—you're watching the real-time battle for control. It lets you manage your risk based on what the market is about to do, not just what it’s already done. That's how you stay in this game for the long haul.
Putting It All into Practice with Trading Tools
Knowing the theory behind bid and ask size is one thing. Actually using it to make money in a fast-moving market? That's a completely different ballgame. To turn these order flow concepts into a real trading edge, you have to get your hands dirty and set up your tools to filter out the noise and flag the events that actually matter.
This isn't about using default settings. It's about building a workspace that actively feeds you actionable information. The whole point is to translate the patterns we've discussed—imbalances, absorption, and liquidity shifts—into clear, unmissable visual cues and alerts right on your screen.
Configuring Your Level 2 and Order Book
First things first: you need to optimize how you see Level 2 data. A standard, scrolling list of numbers is just a recipe for information overload. Your goal should be clarity at a glance.
Start by customizing the colors and highlighting in your trading platform. Set a rule to automatically light up any bid or ask size that blows past a certain threshold—for instance, anything over 10 times the average size. This small tweak instantly draws your eye to unusually large orders, which could be a sign of institutional activity or a major support or resistance level forming in real-time.
Next, consolidate the noise. Many platforms, including ChartsWatcher, let you aggregate the order book, which groups multiple price levels together. This paints a much clearer picture of the total supply and demand sitting around key prices, instead of showing you a fragmented list of tiny individual orders.
The screenshot below from ChartsWatcher shows a highly customized dashboard that pulls together alerts, charts, and toplists to keep a close eye on the market action.
A setup like this allows a trader to see critical alerts and imbalances right alongside the price chart, directly connecting what's happening in the order flow to the behavior on the chart.
Creating Scans and Alerts for Imbalances
Trying to spot these setups manually is a losing game. You're always reacting, always a step behind. You need to be proactive, and that's where custom scans and alerts come in.
The single most powerful alert you can build is one based on the bid-ask size imbalance ratio we covered earlier.
Using a tool like ChartsWatcher, you can build a real-time market scanner that follows a few simple rules:
- Define Your Universe: Start with a specific group of stocks, like the S&P 500.
- Set the Imbalance Condition: Create a filter where
(Total Bid Size / Total Ask Size) > 3.0. This will hunt for stocks where the buying pressure is at least three times stronger than the selling pressure. - Add a Volume Filter: To make sure the signal is legitimate, add a minimum volume requirement, like
Volume > 500,000shares. - Create the Alert: Finally, tell the system to notify you the second a stock meets all these criteria.
Practical Application: Imagine an alert fires for a 3:1 bid-to-ask ratio on a stock that's pulling back to its 50-day moving average. This is a high-probability setup. The technical level gives you the context, and the bid size imbalance provides the real-time confirmation that buyers are stepping in to defend that price.
When you build these automated systems, you stop hunting for signals and let the opportunities come to you. You’re essentially creating a personal assistant that watches the market's order flow for you, pointing out the exact moments of imbalance that could signal your next trade.
Answering Your Top Questions About Bid and Ask Size
Once you start digging into bid and ask size, a few key questions almost always pop up. Let's tackle them head-on, because getting these answers straight will give you a ton of confidence when you're in a live market.
What's a Good Bid-to-Ask Imbalance Ratio?
This is probably the number one question I get. While there isn't a single magic number that works for everything, a common rule of thumb many traders use is a ratio of 3:1 or higher. If the bid size is three times larger than the ask size, it’s a pretty strong signal that demand is stepping up.
But here’s the critical part: context is everything. What’s considered a huge imbalance for a volatile small-cap stock might be just another Tuesday for a massive, high-volume ETF. Your job is to get a feel for what's normal for the asset you trade. The real edge comes from spotting when the size deviates significantly from its typical behavior.
Is That Large Order Real or Fake?
This is the million-dollar question. How do you know if that giant wall of bids is a genuine institution loading up or just a spoofer trying to manipulate the market? The truth is in how the order behaves under pressure.
Spoofing is all about creating a false impression. A trader will place a huge order they have zero intention of letting fill, hoping to spook others into buying or selling. The tell-tale sign of a fake order is that it vanishes into thin air the second the price gets close enough to be filled. It's a ghost.
A real institutional order, on the other hand, wants to get filled. An iceberg order, for instance, will absorb share after share at its price level and then refresh to show more size. It stands its ground and defends its price.
Key Insight: A real, large order is there to do business and will absorb pressure. A fake order is a bluff—it will fold the moment it's challenged, revealing the manipulator's true intent.
Does Size Analysis Work for All Asset Classes?
Finally, traders often ask if these principles apply beyond the stock market. The answer is a resounding yes, but you have to know the lingo for each market. The core concept—that size reveals supply and demand—is universal.
The way it's measured just changes a bit:
- Stocks: Size is usually shown in shares (or round lots of 100), representing a direct piece of the company.
- Options: Size is displayed in contracts, where one contract typically represents 100 shares of the underlying stock.
- Futures: Size is also in contracts, but the value of each contract is tied to whatever commodity or index it tracks.
Even though the units are different, a massive bid size in any of these markets signals the same thing: strong buying interest at that price. Once you understand these small distinctions, you can apply size analysis to pretty much anything you trade.
Ready to stop guessing and start seeing what the big players are doing? With ChartsWatcher, you can build custom scans and alerts to automatically find critical bid-ask imbalances in real-time. Get the edge professional traders rely on. Explore the tools at https://chartswatcher.com.
