How to Find Momentum Stocks Your Practical Guide
Finding momentum stocks is all about spotting equities in a strong upward trend and jumping on board, expecting that trend to continue. The core idea is brilliantly simple: winners tend to keep winning, at least for a good while. This approach prioritizes raw price action over deep fundamental value, which makes it a fantastic tool for riding powerful market waves.
What Is Momentum Investing Really
Before you even think about building screeners or pulling up charts, it's crucial to get the why behind momentum investing. This isn't about randomly chasing hot stocks you saw on social media. It's a systematic method that has its roots in market psychology and behavioral finance.
The strategy works because of how we, as humans, react to the market. Emotions like herd mentality and our often-delayed reaction to good news can cause a stock's price to move in one direction for a surprisingly long time.
Think about it: a stock starts performing well, and it catches people's attention. That fresh interest brings in a flood of new buyers, pushing the price even higher and creating a self-feeding loop. This cycle churns along until a major event or a big shift in market sentiment finally breaks the spell.
The Psychology Behind the Price
Understanding the "why" is just as critical as the "how." A stock's relentless climb is usually powered by real, tangible catalysts that get investors excited. These triggers often include things like:
- Positive Earnings Surprises: When a company smashes Wall Street's earnings estimates, it’s a clear signal of strong business health. That tends to attract a whole new wave of investment.
- New Product Launches: A game-changing product or service can generate massive buzz, driving up both sales and the stock price.
- Favorable Industry Trends: Sometimes, a whole sector gets a lift from new regulations, a tech breakthrough, or a change in what consumers want.
This isn't some fleeting theory, either. Momentum is a recognized market factor with a long history of solid performance. Digging into the data, the momentum factor has been one of the most powerful drivers of excess returns in global stock markets. For instance, between 1999 and 2016, global momentum strategies frequently beat other factor-based approaches, sometimes by staggering margins of 20% to nearly 50% in a single year.
Key Takeaway: Real momentum investing isn't about blind speculation. It's about finding stocks with strong, verifiable reasons for their climb and having a solid plan to ride that trend while keeping your risk in check.
Sustainable Trend Versus Speculative Bubble
One of the most critical skills you'll develop is telling the difference between a stock in a healthy, sustainable uptrend and one that's just caught in a speculative bubble. A sustainable trend is usually backed by improving fundamentals—think growing revenue or expanding market share.
A bubble, on the other hand, is often fueled by pure hype and irrational excitement, with no solid foundation to stand on.
To build a repeatable process for finding true momentum stocks, you have to focus on data-driven signals. This means using a mix of technical indicators and some qualitative checks to confirm that the trend is both strong and legitimate. When you do this, you stop chasing market noise and start making informed decisions. Our guide on top momentum trading strategies dives much deeper into how you can build a robust framework for just this purpose.
Mastering the Key Momentum Indicators
 Finding momentum stocks isn't just about spotting a price chart that's going up. Anyone can do that. The real skill is in figuring out the strength and sustainability of that move.
That’s where specific indicators come in. These are the tools that separate traders who chase every brief spike from those who proactively find trends with real staying power. They help you answer the million-dollar question: is this trend for real, or am I about to buy the top?
Measuring Trend Strength and Longevity
One of the most solid signals I look for is the relationship between different moving averages. Think of them as more than just lines on a chart; they smooth out the day-to-day noise to show you the true underlying trend.
A classic setup, and for good reason, is the "golden cross." This is when the shorter-term 50-day moving average pushes up and over the longer-term 200-day moving average. It’s a powerful sign that recent buying pressure is overwhelming the long-term sentiment, often kicking off a major bullish run. If a stock is trading well above both of these averages, you know you're looking at a confirmed, healthy uptrend.
Another incredibly simple yet effective method is just looking at a stock's proximity to its 52-week high. It sounds basic, but it's backed by solid data. In fact, academic studies have shown that portfolios built on buying recent top performers can generate significant excess returns—one study found winning portfolios earned an average of 1.23% in monthly returns. You can dig into the research behind momentum strategies yourself.
Gauging Speed and Overbought Conditions
While moving averages tell you the direction, other indicators measure the speed of the move and whether the trend is getting exhausted. This is critical for timing your entry and not getting caught in a pullback.
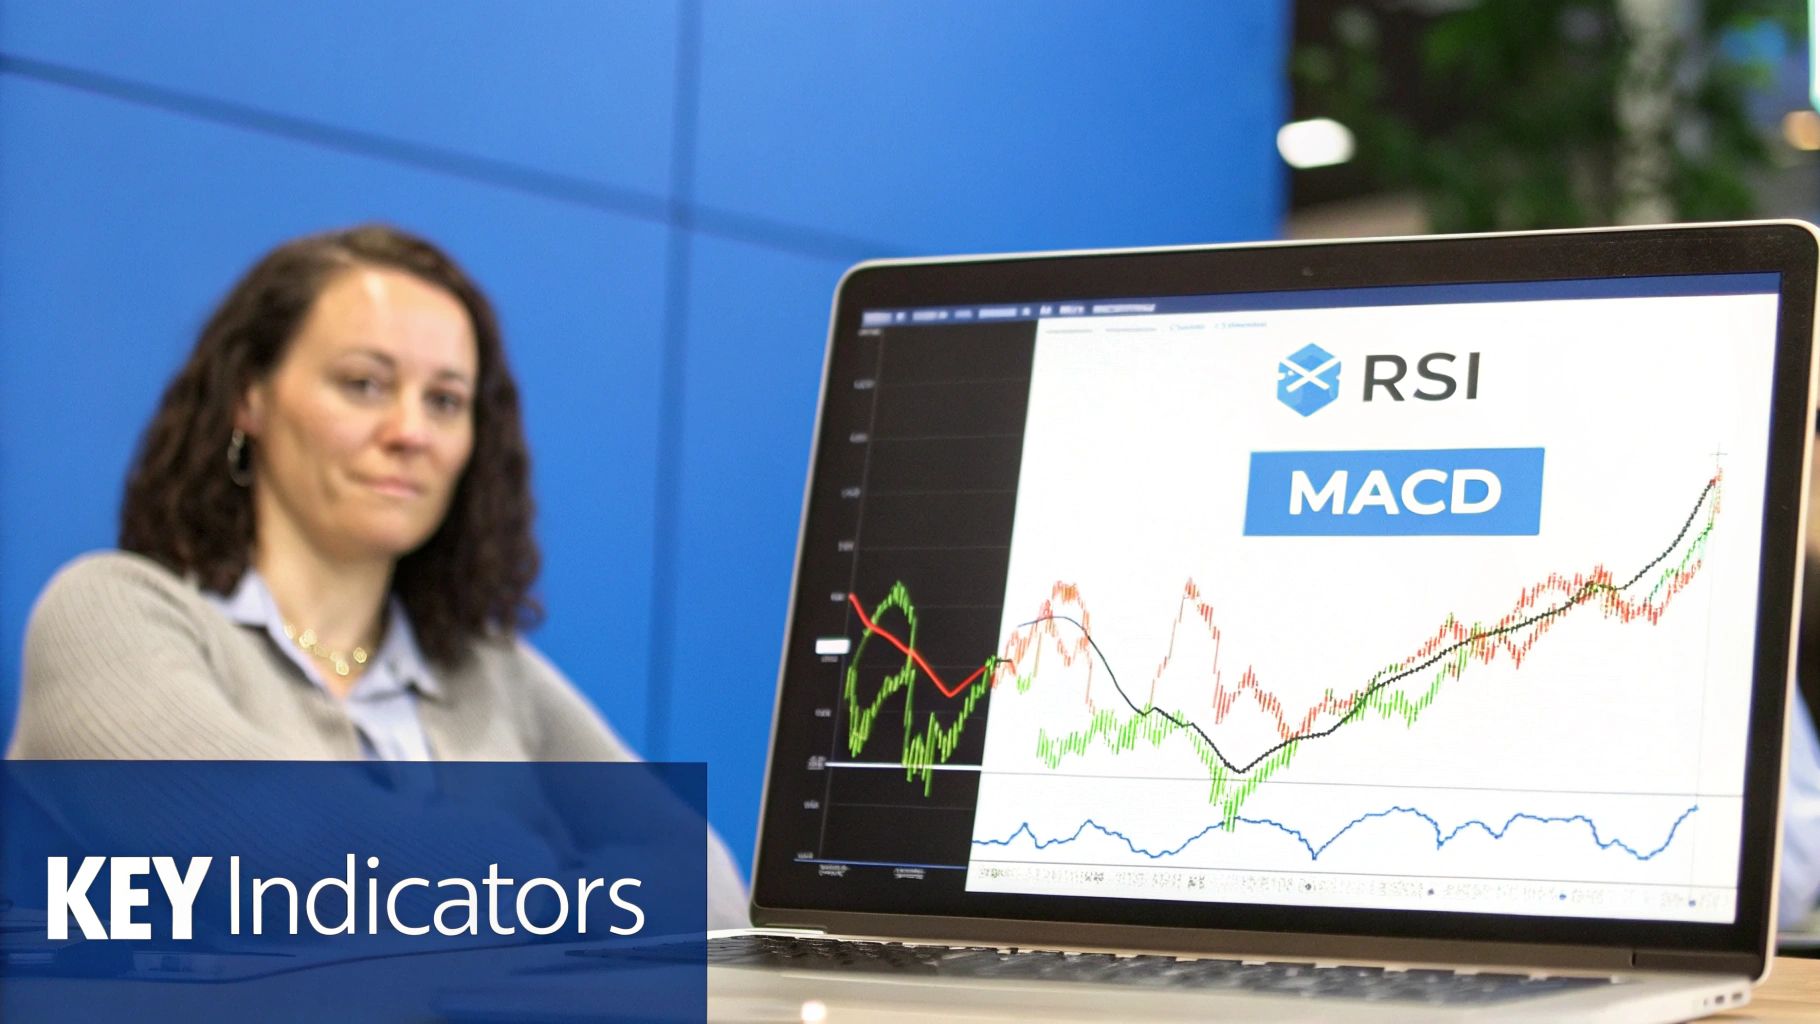
My go-to for this is the Relative Strength Index (RSI). It’s a simple oscillator that measures the velocity of price changes on a scale from 0 to 100.
- Overbought Signal: An RSI reading over 70 is a warning flag. It suggests a stock has moved too far, too fast, and might be due for a breather.
- Oversold Signal: On the flip side, a reading below 30 can signal an oversold condition, though we're less concerned with this when hunting for strong uptrends.
For momentum trading, a stock living in the 50-70 RSI range is often the sweet spot. This shows consistent, strong buying pressure without being dangerously overextended. It’s the sign of a healthy, sustainable move.
Another great tool is the Rate of Change (ROC). This one is straightforward: it measures the percentage price change over a specific period. A rising ROC means momentum is actually accelerating, which is exactly the kind of confirmation you want to see.
Here's a pro tip for building your screen: analyze price performance over the last 6 to 12 months but tell your screener to ignore the most recent month. This clever little trick helps you find stocks with sustained, long-term strength while filtering out the noise from short-term, volatile pops that could fizzle out just as quickly.
Essential Momentum Indicator Settings
To bring it all together, here’s a quick-reference table for the indicators I rely on most. These aren't set in stone, but they're the standard settings that have worked well for me and countless other traders.
| Indicator | Common Setting | What It Signals | Best Used For |
|---|---|---|---|
| Moving Averages | 50-day and 200-day | Confirms the primary trend direction and strength. | Identifying long-term uptrends and "golden cross" signals. |
| 52-Week High | Within 5-10% of high | Indicates strong, sustained buyer interest and institutional support. | Finding market leaders with proven performance. |
| RSI | 14-period | Measures the speed of price change to identify overbought/oversold conditions. | Gauging if a trend is sustainable or becoming exhausted. |
| ROC | 12-period | Measures the percentage price change, showing if momentum is accelerating. | Confirming the strength and velocity of a current trend. |
Think of these settings as your starting point. As you gain more experience, you might tweak them to fit your specific style, but they provide a solid foundation for any momentum screening strategy.
How to Build Your Own Stock Screener
Knowing the theory behind momentum is one thing, but actually putting it to work is where the magic happens. For that, the single most powerful tool you have is a stock screener. Instead of getting lost trying to manually sift through thousands of stocks, a screener cuts through the noise. It instantly narrows down the entire market to a focused, manageable list of stocks that meet your precise criteria.
Let's walk through building a real-world momentum screener from scratch using a platform like ChartsWatcher. This isn't just a theoretical exercise—these are the exact filters you can plug in right now to start uncovering potential winners.
Setting Your Foundational Filters
Before we even touch the momentum-specific stuff, we need to build a solid foundation. The first job is to filter out the junk: the illiquid, low-quality, or tiny micro-cap stocks that are often too volatile and a nightmare to trade. You want to focus your energy on established companies where you can actually get in and out of a position without a fuss.
Start by setting these baseline filters:
- Market Capitalization: Set a minimum of $2 billion. This immediately gets rid of the smaller, more speculative companies and points you toward more stable mid-cap and large-cap names.
- Average Daily Volume: Require at least 500,000 shares traded on average. This is a crucial liquidity filter. It ensures there are plenty of buyers and sellers, so you can execute your trades efficiently.
- Share Price: I like to set a minimum price of $10 per share. This is a simple way to avoid penny stocks, which are notorious for manipulation and wild swings that have nothing to do with real momentum.
These initial settings clean up your universe of stocks, making sure anything that makes it through is a viable candidate for a real portfolio. With that groundwork laid, we can start layering on the actual momentum criteria.
The process is pretty straightforward: you define your core criteria, apply specific momentum filters, and then analyze what comes out the other side.
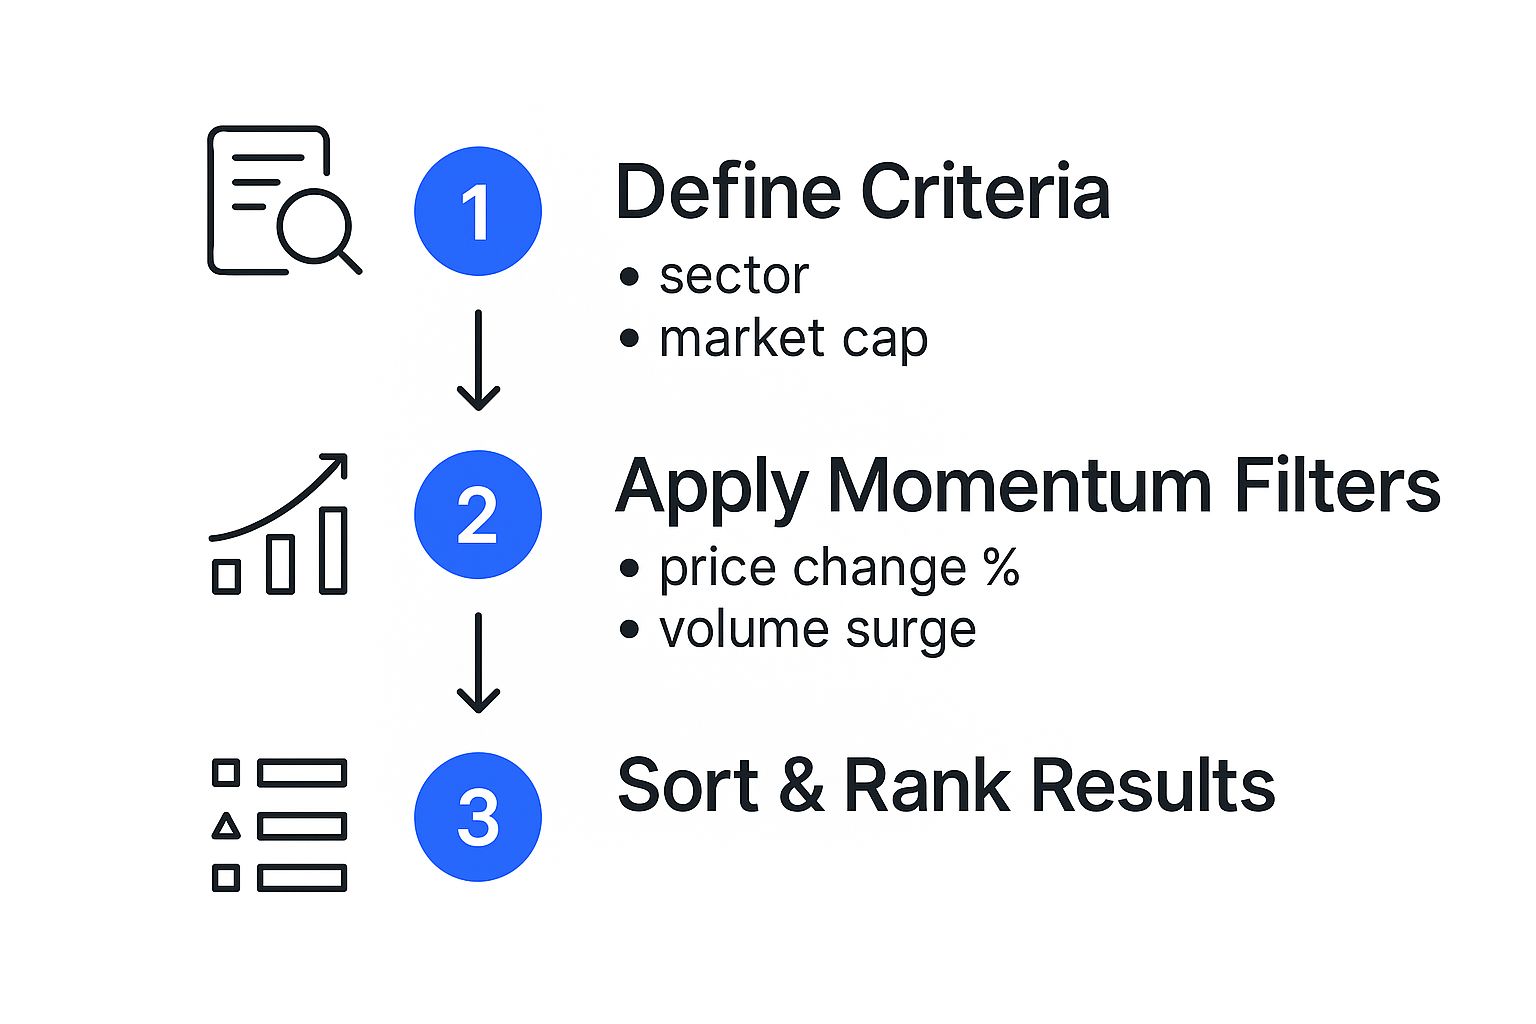
This simple workflow is the heart of the process, turning a massive ocean of equities into a focused list of high-potential candidates.
Applying Core Momentum Criteria
With our baseline established, it's time to add the filters that actually hunt for strong price trends. This is where we tell the screener, in no uncertain terms, what "strong performance" looks like in a quantifiable way. A good momentum screen always looks at performance across different timeframes to confirm a trend is both powerful and sustained.
Here are the momentum-specific filters to configure:
- Price vs. 52-Week High: Filter for stocks trading within 15% of their 52-week high. This is a classic momentum signal. It tells you the stock is a proven winner and continues to attract buyers, pushing it toward new highs.
- Performance Over Multiple Periods: Set criteria to identify consistent strength. A great starting point is requiring the stock to be up at least 25% over the past six months and 50% over the past year. This combination finds stocks with durable upward trends.
- Moving Average Confirmation: Make sure the current price is above both the 50-day and 200-day simple moving averages. This is a fantastic confirmation that both the short-term and long-term trends are aligned and bullish.
A pro tip I've picked up over the years: when you set performance filters, consider excluding the most recent month. For example, screening for 11-month performance ending one month ago helps you dodge stocks that just had a speculative, short-term pop. Instead, it surfaces names with more durable, sustained momentum.
Once these filters are in place, you’ve built a powerful engine for finding high-quality momentum stocks. Our comprehensive guide on how to use a stock screener offers even more smart investing tips to refine your process. The goal is to create a repeatable system that consistently surfaces the market's strongest performers, week after week.
How to Analyze Your Screener Results
So, your screener just spat out a list of 50 high-flying stocks. It’s a great feeling, right? But hold on—this isn't your final shopping list. It's just the start of the real work. The data has shown you what's moving, but now you need to find out why it's moving and if there's enough gas in the tank for the trend to continue.
This is where you separate the real opportunities from the traps. A stock can show incredible momentum for all the wrong reasons—a short squeeze, a flimsy rumor, or a one-off news headline. Your job is to dig a layer deeper and find the legitimate forces driving the price.
The Rapid Qualitative Check
Before you even think about looking at a chart, the first thing you should do is a quick qualitative check. Think of it as a reality check, where you uncover the story behind the numbers. You’re hunting for a clear, fundamental reason for the stock's strength.
Just ask yourself one simple question: What's the catalyst?
- Earnings Reports: Did the company just crush their earnings report, beat expectations, and raise their guidance for the future? This is a classic, powerful driver of momentum.
- New Products or Partnerships: Is there a lot of buzz around a new product launch? Or maybe they just announced a major partnership that opens up entirely new revenue streams?
- Sector-Wide Strength: Is the stock just riding a massive wave lifting the entire sector? Think about the AI boom—a rising tide was lifting a lot of tech stocks, creating strong tailwinds.
- Positive News Coverage: Has there been a string of positive analyst upgrades or favorable industry press?
This whole process shouldn't take more than five minutes per stock. A quick search on a financial news site usually tells you everything you need to know. If you can’t find a clear, compelling reason for the rally, it's often best to just move on.
My Personal Rule: No clear catalyst, no trade. Relying solely on price action without understanding the "why" is a surefire way to buy the top of a speculative bubble. Real, sustainable momentum is always backed by a real story.
Confirming the Trend with Chart Analysis
Once a stock passes your initial smell test, it's time to pull up the chart. You're not doing a deep, complex technical dive here. Instead, you're doing a quick visual confirmation to make sure the trend looks healthy and to spot a sensible entry point.
Your focus should be squarely on the price action and key moving averages. You want to see a clean, steady uptrend where the stock is consistently making higher highs and higher lows. The price should be trading comfortably above its 50-day and 200-day moving averages, which tells you that both the short-term and long-term trends are pointing in the right direction.
Stay away from charts that look like a vertical rocket ship. A stock that has gone parabolic is often exhausted and vulnerable to a nasty pullback. What you really want to see is a controlled climb with periods of consolidation. These are the healthy pullbacks where the stock takes a breather before its next leg up. Those consolidation phases often provide the best, lowest-risk entry points, letting you buy into strength without chasing the absolute peak.
Smart Risk Management for Momentum Stocks

The thrill of momentum investing is undeniable. It's all about finding stocks with the potential for those rapid, outsized returns we all chase. But let's be real: what goes up can—and often does—come down just as quickly.
Protecting your capital isn't just a boring footnote; it's the absolute core of a successful momentum strategy. A sharp reversal, what traders often call a "momentum crash," can wipe out weeks or even months of hard-won gains in a matter of days. If you don't have a plan to protect your downside, you're not trading—you're just gambling on the greater fool theory, hoping someone else buys your shares at a higher price before the party ends.
Your Defensive Playbook
When it comes to risk management, the most powerful tool you have is the stop-loss order. It's simple: you decide on a price to sell your position before you even enter the trade. This single action takes emotion completely out of the equation when things get hairy.
Here are a couple of popular ways to set them:
- Fixed Percentage Stop: This is a straightforward approach. Many traders set a hard stop-loss 7-8% below their entry price. It's a clear line in the sand that limits your potential loss on any single trade.
- Moving Average Stop: Another great technique is to place your stop just below a key moving average, like the 50-day. If the stock price breaks below that critical support level, it's a very strong signal that the upward trend is losing steam.
It's crucial to remember that momentum runs in cycles. History shows us that extreme rallies are often followed by painful reversals in the next year. In fact, some analysts suggest there's at least a 2-to-1 probability against these high-flyers outperforming after a monster run-up. You can learn more about the risks of momentum cycles from the pros.
Diversification and Profit Taking
You've heard it a million times, but it's especially true here: never put all your eggs in one high-flying basket. Spreading your capital across 5 to 10 different momentum stocks, preferably from various sectors, can cushion the blow if one of your picks suddenly turns against you. A problem with one company or an entire industry won't sink your whole portfolio.
Just as important is knowing when to cash in your chips. No trend lasts forever. If a stock has had a massive run but is starting to show signs of exhaustion—like a bearish divergence on the RSI or a break of its trendline—don't be afraid to sell a portion of your position.
Locking in gains is the name of the game. A small profit is always, always better than watching it turn into a big loss.
A Few Common Questions
Even with a solid game plan, you're bound to have some questions. It's perfectly normal. Let's tackle some of the most common ones I hear from traders just getting started with momentum.
How Long Does a Typical Momentum Trade Last?
This is the classic "it depends" answer, but it's true. The duration of a momentum trade is dictated entirely by your personal trading style and timeframe.
A day trader might be in and out in a few hours, riding a quick intraday surge. On the other hand, a swing trader could comfortably hold a winning stock for several weeks or even months, as long as the upward trajectory remains intact.
The real key isn't the calendar; it's the trend's health. You should let the stock's own price action tell you when to get out. An exit signal, like a decisive break below the 50-day moving average, is a far better guide than a predetermined holding period.
Can I Use Momentum Investing in a Bear Market?
Absolutely, but you have to flip your thinking. In a bear market, strong, sustained upward moves are few and far between. They're often just short-lived sucker rallies.
Instead of looking for stocks to buy, you can apply the exact same principles to find stocks with powerful downward momentum. These become prime candidates for short-selling.
If shorting isn't your game, you can also shift your focus to defensive sectors that might be holding up better than the broader market. Or, and there's no shame in this, you can simply sit in cash and preserve your capital until strong, healthy uptrends start to emerge again.
A Quick Heads-Up: Momentum strategies tend to have higher portfolio turnover than your typical buy-and-hold approach. This means you'll likely rack up more in transaction costs and could face a bigger tax bill from short-term capital gains. Always factor these costs into your bottom line.
Is Momentum Investing the Same as Growth Investing?
It's a common point of confusion, but they are fundamentally different strategies, even though their paths often cross.
Growth investing is all about the company's story and its numbers. Growth investors are looking for businesses with stellar fundamentals—things like rapidly growing earnings, soaring revenue, and expanding market share. The belief is that a great company will eventually have a great stock price.
Momentum investing, at its core, is a pure price-action game. It doesn't ask why a stock is going up; it simply observes that it's going up and jumps on for the ride. A stock can have incredible momentum for reasons totally unrelated to its fundamental growth, and a great growth company can see its stock price go nowhere for months.
Ready to stop hunting and pecking for winners and start systematically finding the market's strongest stocks? ChartsWatcher gives you the powerful, customizable screeners you need to build, test, and execute your momentum strategies like a pro. Build your first professional-grade screener today at chartswatcher.com.
