How to Begin Trading Penny Stocks A Professional Guide
To even think about trading penny stocks, you have to get one thing straight: this is a business, not a get-rich-quick scheme. Forget the lottery ticket mentality. The first step is to build a professional mindset, which means truly understanding the extreme risks, learning how to spot the difference between a real small-cap company and a speculative trap, and sticking to a disciplined strategy backed by data.
If you skip this foundation, the odds are just overwhelmingly stacked against you.
Adopt a Professional Mindset for Trading Penny Stocks

The allure of penny stocks—those stories of explosive, overnight gains—often masks a very harsh reality. New traders get pulled in thinking they can turn a few hundred bucks into a fortune. That exact mentality is why most of them fail. Job number one is to kill that illusion and start treating the market with the seriousness of a business owner.
This starts with a healthy respect for the statistical dangers. Penny stocks, which usually trade for under $5 a share, aren't just smaller versions of big-name companies; they live in a totally different universe of risk.
Sure, a few names like SoundHound AI (SOUN) can produce incredible returns, but the historical data tells a much grimmer story for the average trader. SEC research covering 2018 to 2023 found that over 90% of penny stocks on the over-the-counter (OTC) markets lost money for retail investors. The average annual return? A painful -15.2%. If you want to trade them wisely, you need to internalize these risks. You can find more data on penny stock performance over at XS.com.
Differentiating Legitimacy from Speculation
A huge part of the professional approach is knowing where to look—and where not to. All penny stocks are not created equal. There's a world of difference between a small-cap company listed on a major exchange and some speculative junk stock trading on an OTC market.
- Exchange-Listed Stocks (NASDAQ/NYSE): To be listed here, companies have to meet strict financial reporting rules and keep their stock price above a certain minimum. They’re still volatile, but you get a layer of transparency and regulatory oversight.
- Over-the-Counter (OTC) Markets: These markets have far looser rules, which makes them a breeding ground for manipulation. This is where you'll find the classic pump-and-dump schemes, where fraudsters hype a stock, drive the price up, and then dump their shares, leaving everyone else holding the bag.
A professional trader doesn't chase tips from social media or fall for the hype. They work from a clear plan, manage their risk obsessively, and stick to markets with better transparency and liquidity.
Treat Trading Like a Business
At the end of the day, success comes down to discipline and a commitment to learning. Your trading needs to be structured like any other business, with defined rules, a solid strategy, and metrics to track your performance.
This means keeping meticulous records of your trades, constantly refining your strategy based on what works, and never, ever wavering on your risk management rules. Throw out the lottery mindset and adopt the calculated approach of an entrepreneur. This mental shift is your single best defense against the emotional decisions that blow up amateur trading accounts. It's the bedrock on which every other skill is built.
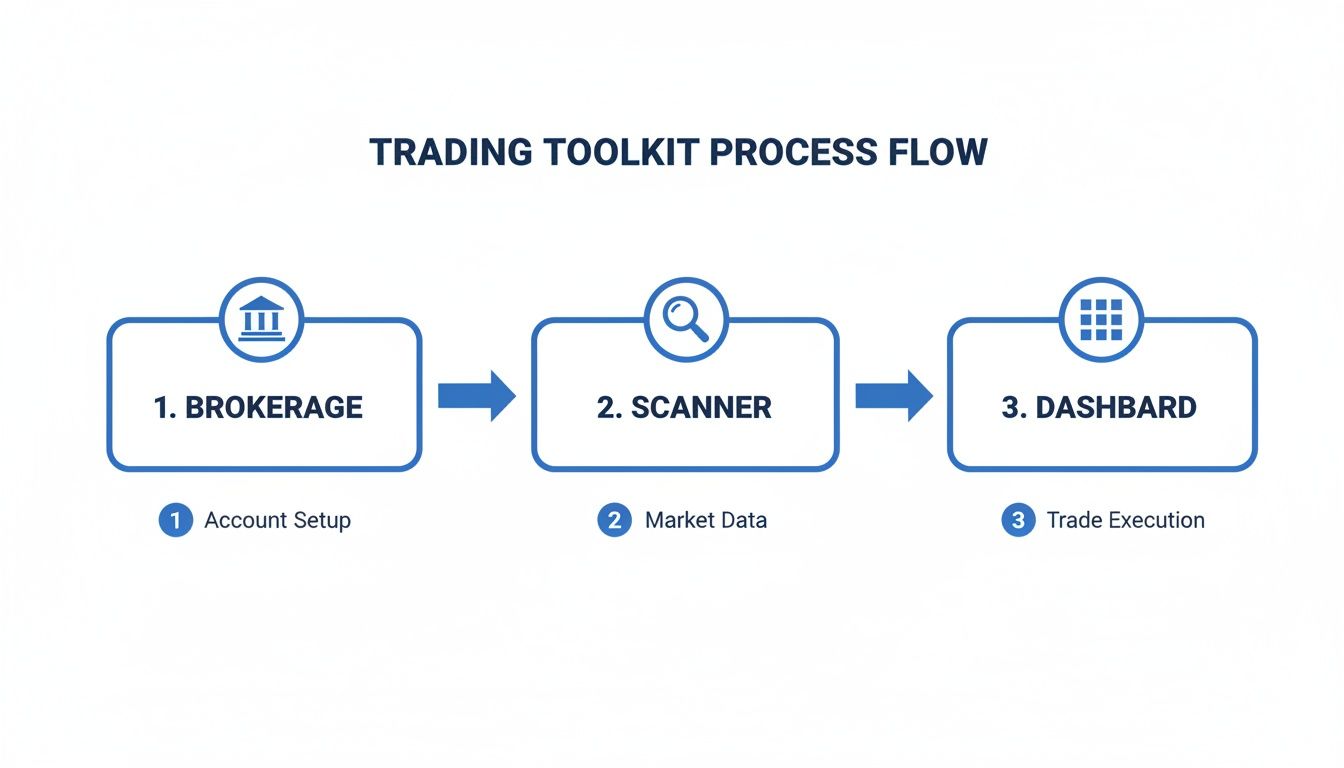
Assemble Your Professional Trading Toolkit
If you want to trade penny stocks seriously, you can't just use your bank's mobile app and some free charting websites. That's the amateur's approach. Professionals build a dedicated arsenal of tools designed for one thing: performance.
Think of it like this: you wouldn't show up to a Formula 1 race with a rusty bicycle. Success in this fast-paced world depends just as much on the quality of your tools as it does on your strategy. Your setup is your command center—it needs to be built for speed, efficiency, and deep market insight.
Choosing Your Brokerage
First things first, you need a brokerage account. This is where the rubber meets the road, and not all brokers are cut out for the unique demands of active penny stock trading. Your choice here directly impacts your bottom line through fees, execution speed, and even the stocks you can trade.
When you're shopping around, here’s what to look for:
- Low Commissions and Fees: Active trading involves a lot of transactions. High fees will bleed your account dry, especially when you're working with smaller position sizes.
- Fast Execution: Prices can whip around in a matter of seconds. A tiny delay in getting your order filled can be the difference between a nice win and an unnecessary loss. Speed is everything.
- Advanced Charting Tools: You need a platform with robust charting that lets you conduct proper technical analysis, draw trend lines, and apply indicators without any clunky workarounds.
- Access to OTC Markets: Some of the biggest moves happen on the Over-the-Counter (OTC) markets. While these stocks are riskier, you'll want a broker that gives you access if your strategy calls for it.
For traders outside the US, there are a few extra hoops to jump through, like dealing with W-8BEN forms and finding brokers that accept international clients. This helpful guide for non-US residents to invest in US stocks breaks down how to navigate those requirements.
Your Most Critical Tool: The Market Scanner
Once your brokerage is ready to go, the single most important tool you'll add is a real-time market scanner. A broker shows you the stocks you already know about; a scanner finds the ones you don't. It’s your eye in the sky, constantly sweeping the entire market for stocks that meet your exact criteria.
A professional trader doesn’t wait for opportunities to appear on the news. They use a scanner to find them before the crowd does. This proactive approach is a fundamental shift from reactive, amateur trading.
A powerful scanner like ChartsWatcher is essential for this. It lets you create custom filters to pinpoint critical events as they happen, such as:
- Sudden, massive surges in trading volume.
- Stocks blasting through key resistance levels.
- Unusual price momentum that stands out from the rest of the market.
- Specific candlestick patterns forming on the chart.
Trying to trade without a scanner is like flying blind. You're just relying on luck and old news.
Setting Up Your Trading Dashboard
The final piece is organizing your tools into an efficient dashboard. A cluttered workspace leads to a cluttered mind and bad decisions. Your goal is to have all critical information visible at a glance so you can react instantly without fumbling through different windows.
A solid dashboard should integrate these key components into one cohesive view:
- Scanner Window: This is your idea factory, feeding you a live list of potential plays that fit your strategy.
- Charting Platform: Keep multiple charts open for your top candidates. This allows for quick, side-by-side analysis of their price action.
- Watchlist: This is your curated list of stocks you are stalking for a potential entry.
- News Feed: A real-time news source is crucial for understanding why a stock might be making a sudden move.
By arranging these elements logically on your screen (or screens), you build an environment designed for focus and rapid decision-making. This professional setup filters out the market noise, letting you concentrate solely on executing your plan.
Build Scans That Uncover High-Probability Setups
Okay, you've got your trading toolkit assembled. Now for the fun part: putting it to work. This is where you transform that overwhelming sea of thousands of stocks into a short, manageable list of real trading ideas. A powerful scanner isn't just a gadget; it's the engine that drives your entire strategy, freeing you from chasing hot tips on Twitter and letting you hunt for opportunities like a pro.
Forget about the generic, pre-built scans that come with most platforms. In the fast-moving world of penny stocks, they’re next to useless. You need to build custom screens that are dialed in to find the exact setups that fit your trading plan. We’ll use ChartsWatcher as a real-world example to build a couple of powerful scans from scratch, showing how each filter layers on top of the next to isolate the best candidates.
This whole process is about creating a systematic workflow. You have your brokerage for execution and your scanner for discovery, working together to create a professional trading operation.
Think of it this way: your scanner is the bridge that takes you from having an account funded to actually finding a stock worth trading.
Constructing a High Relative Volume Scan
One of the most reliable clues that a stock might be about to make a big move is a massive, unusual surge in trading volume. When a stock suddenly trades many times its normal volume, it’s a giant flare signal that big money—whether it’s institutions or a huge wave of retail traders—is flooding in. This is exactly what our first scan is designed to find.
Here’s how you’d build it in a scanner like ChartsWatcher:
- Price Range: Set a filter for stocks trading between $0.50 and $5.00. This keeps us squarely in the penny stock sandbox but weeds out the sketchy sub-penny stocks that are often illiquid and easily manipulated.
- Minimum Daily Volume: Filter for an average daily volume (over the last 30 days) greater than 500,000 shares. This is crucial. It ensures we're only looking at stocks with enough liquidity to get in and out of a trade without getting stuck.
- Relative Volume (Float Adjusted): This is the secret sauce. Set it to flag stocks where today’s volume is at least 5 times greater than its recent average. This is the "something is happening right now" signal we're hunting for.
That simple three-filter combination will immediately give you a list of penny stocks experiencing a significant, out-of-the-ordinary influx of trading activity.
If you want to dive deeper into scanner settings, check out this detailed guide on using a penny stock screener to find winners.
Your scanner dashboard is your command center. You can see your custom scans, top movers, and alerts all in one place, giving you a complete overview of the market at a glance.
Setting Up a Breakout Scan
Another classic, time-tested strategy is trading breakouts. A breakout happens when a stock's price punches through a key resistance level, often signaling the start of a brand new uptrend. A good scanner helps you catch these moves the very moment they happen, not after the fact.
Let's configure a scan to find stocks breaking above their 52-week high—a very powerful bullish signal.
- Price Range: Let's stick with $1.00 to $5.00. Breakouts below $1.00 can be less reliable and often turn into fake-outs.
- Minimum Daily Volume: Again, we want more than 500,000 shares to make sure the stock is actively traded.
- Price vs. 52-Week High: This is our trigger. Set the filter to
Price is within 1% of its 52-Week High. This will pop up on your screen the moment a stock is testing or smashing through a major long-term resistance level. - Float Size: Here’s a great addition. Add a filter for
Float under 50 Million Shares. Low-float stocks—those with a smaller supply of shares available to the public—can move much, much faster and more explosively during a breakout.
Pro Tip: Always combine your breakout scan with a relative volume filter. A breakout on high relative volume (say, 3x or more) is a much stronger, more trustworthy signal than one on weak volume. It confirms there’s real power and conviction behind the move.
Building and saving scans like these is a fundamental shift in how you approach the market. You stop being a reactive trader chasing news headlines and become a proactive hunter who systematically finds high-quality setups. Your scanner becomes your most valuable employee, working 24/7 to bring you the best opportunities the market has to offer, all perfectly tailored to your strategy.
Prove It Works: Backtesting and Paper Trading Your Strategy
So you've built your scans and have a steady stream of high-potential tickers hitting your dashboard. The temptation to dive in and start trading with real cash is immense. Stop. This is the exact moment where professionals separate themselves from gamblers.
Never, ever risk a single dollar on an unproven idea. Before you even think about funding your account, you need to rigorously validate your entire system. This is a non-negotiable, two-part process: first, you'll test against the past with backtesting, then you'll practice in the present with paper trading. Get this right, and you'll build the foundation to survive and thrive in this game.
Does Your Strategy Have a Statistical Edge? Find Out with Backtesting.
Backtesting is like having a time machine for your trading strategy. You take your exact rules—the scan criteria, the entry signals, the exit plan—and unleash them on historical market data. It’s the only way to see how your system would have actually performed over months or even years of real price action.
The whole point here is to gather cold, hard, objective evidence. Does your breakout scan really produce winners over a large sample size? What's the actual win rate? More importantly, how much do you make when you're right versus how much you lose when you're wrong?
This is precisely what advanced tools like the backtesting feature inside ChartsWatcher are built for. You can plug in the parameters of your custom scan and let the software run it against its massive database of historical charts. This is how you transform a hopeful guess into a data-backed system with a quantifiable edge.
A strategy without a positive statistical expectancy is just a recipe for losing money slowly. Backtesting is how you find that expectancy before you put real capital on the line.
The data you'll uncover is priceless. Mastering penny stocks means mastering volatility. These micro-caps swing wildly—recent data shows an average intraday volatility of 8.7% for U.S. penny stocks under $5, completely dwarfing the 1.4% seen in the S&P 500. Using a tool like ChartsWatcher's backtester reveals how to tame that chaos. For instance, backtesting a momentum strategy on high-volume pennies showed it could yield 22% annualized returns from 2020-2025 on filtered setups, compared to a -9% return on unfiltered trades. For more on micro-cap volatility, check out this NerdWallet analysis.
Move to the Live Market, Risk-Free
Once your backtesting confirms the strategy has a statistical edge on paper, it's time to see how you perform with it in a live environment. This is where paper trading comes in.
Paper trading, or simulated trading, is a feature offered by most brokers that lets you place trades with fake money in the live market. The charts are real, the price action is real, the order fills are real. The only thing that isn't real is your P&L.
This step is absolutely critical, and here’s why:
- It tests your execution skills. Can you actually click the buttons, set your stop-loss, and take profits according to your plan when prices are flying around in real-time?
- It reveals your psychological weaknesses. How do you really react when a trade immediately goes against you? Do you follow your rules, or do you freeze up and start to "hold and hope"?
- It builds unshakable confidence. Nothing builds real self-belief like executing your plan successfully over and over, even if it's just with fake money.
If this is new to you, our guide on what is paper trading and how to start risk-free is the perfect place to get up to speed.
Your Paper Trading Game Plan
Don't just mindlessly click buttons here. Treat your paper trading phase with the exact same discipline you'll use with your life savings. Set a clear, tangible goal: execute a minimum of 50-100 paper trades following your strategy to the letter.
As you trade, you need to track your performance like a hawk. Focus on these key metrics:
- Win Rate: The raw percentage of winning trades.
- Profit Factor: Your total gross profit divided by your total gross loss. Anything above 1.0 is profitable; professionals aim for 1.5 or higher.
- Average Win vs. Average Loss: The size of your average winner should be meaningfully larger than your average loser (often called the risk/reward ratio).
- Maximum Drawdown: The biggest percentage drop your account takes from a peak. This shows you the kind of pain your strategy can inflict.
Only after you have consistently positive results over this large sample size should you even consider moving a single cent into your trading account. This methodical process isn't just about proving the strategy—it's about proving to yourself that you have the discipline to execute it.
Execute Trades and Manage Risk Like a Pro
 Once you have a proven strategy in your back pocket, your focus has to pivot to the two things that really define a professional trader: flawless execution and obsessive capital preservation.
Building a profitable scan is only half the battle. Seriously. The other half is won or lost in those critical moments when you actually place and manage your trades. This is where discipline trumps everything. Plenty of traders can find good-looking charts, but very few can manage the trade correctly. The mechanics of placing orders and the unbreakable rules of risk management are what separate the pros from those who quickly blow up their accounts.
Precision in Every Entry and Exit
Your trading plan needs to be razor-sharp, defining your exact entry and exit points before you ever even think about clicking the “buy” button. Just jumping into a stock that's already moving is a surefire way to get burned. Instead, professional traders wait for specific, pre-defined confirmations.
Let’s say you're trading a breakout strategy. Your entry isn't just when the price pokes its head above a resistance level. A much more precise tactic is to wait for a 5-minute candle to actually close above that level, preferably on high volume. This small act of patience filters out a ton of "fake-outs" where the price momentarily spikes before crashing right back down.
Your exit plan needs two equally clear components:
- Price Target: Where are you taking profits? This should be based on something tangible in your technical analysis, like the next major resistance level or a measured move from the breakout point.
- Stop-Loss: At what price will you admit you're wrong and cut the loss? This isn't a suggestion; it's a hard, pre-set order you place in your brokerage platform the moment you enter the trade.
The market doesn't care about your opinion or how much you believe in a stock. A hard stop-loss order is your ultimate defense against hope, emotion, and catastrophic losses. It is the single most important order you will ever place.
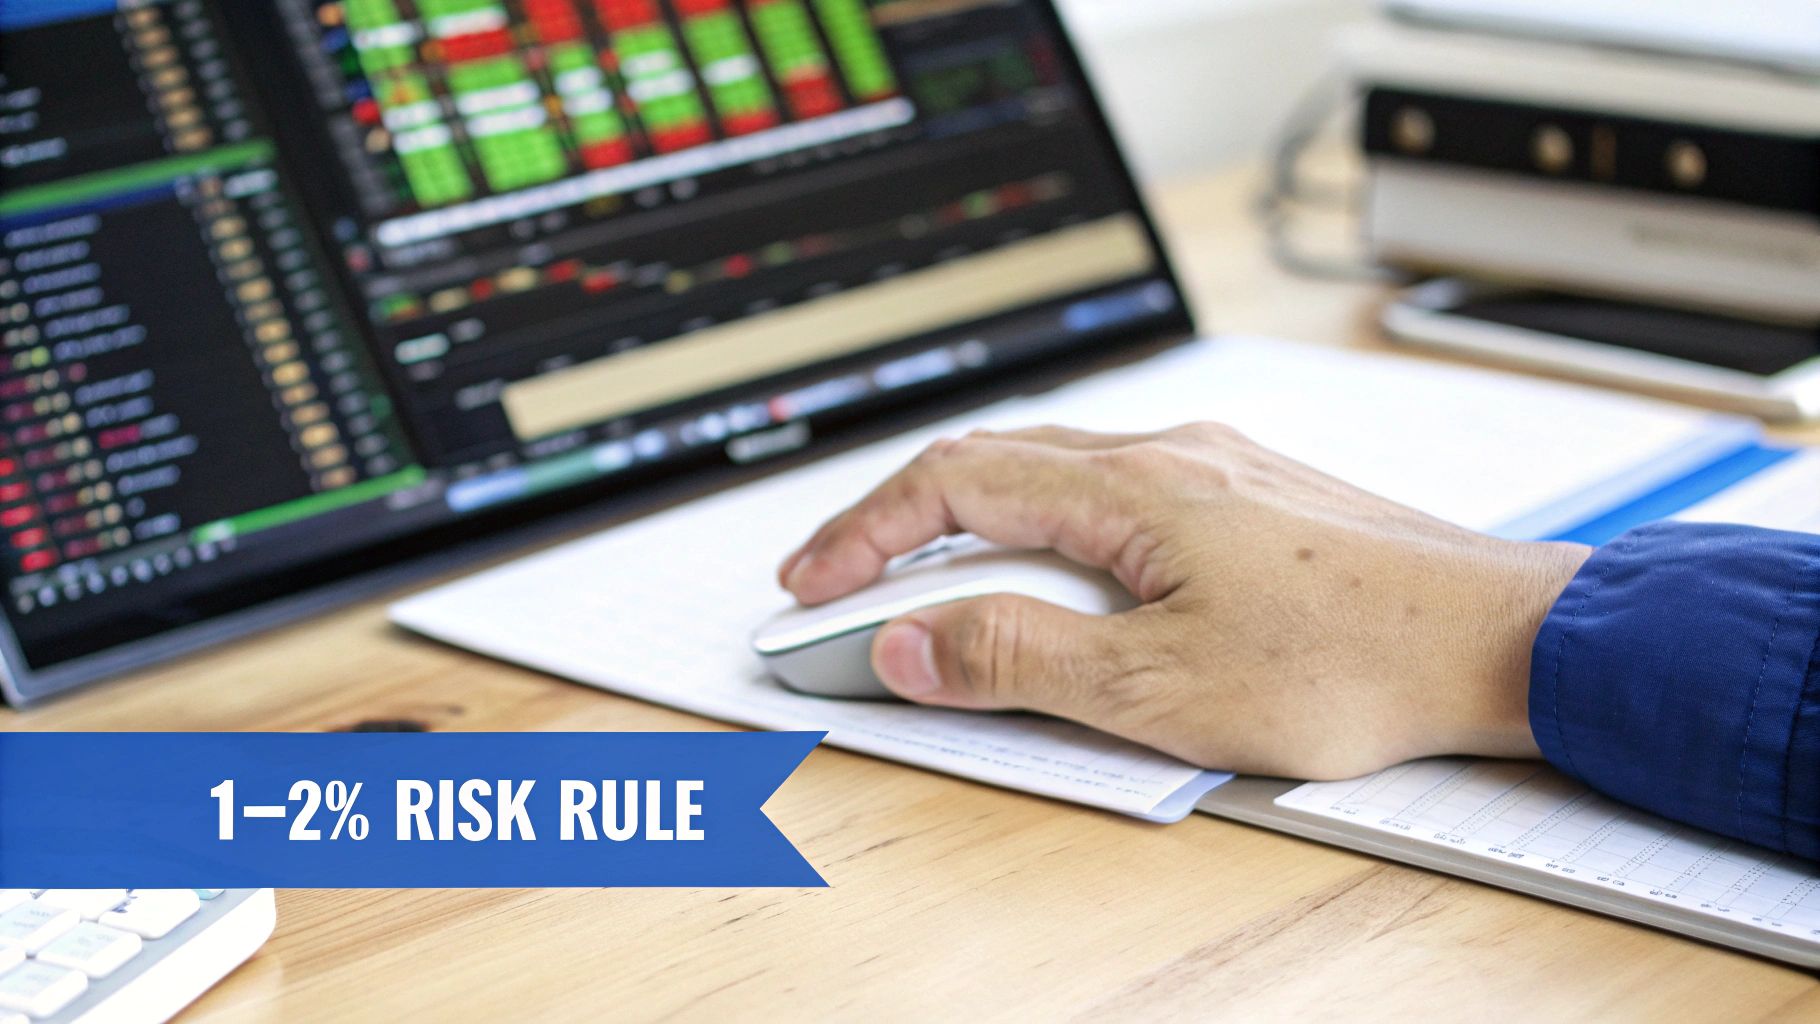
The Cornerstone of Survival: The 1-2% Rule
Listen up, because this is the most important rule in your entire trading business: never risk more than 1-2% of your total trading capital on any single trade. This isn't a guideline; it's the law. This one rule ensures that no single bad trade—or even a string of ten bad trades—can knock you out of the game.
It dictates your position size, which is simply how many shares you buy. The calculation is simple but incredibly powerful.
Let's walk through it. Imagine you have a $5,000 trading account and you decide to risk 1% per trade. That means your maximum acceptable loss on any single position is $50.
Now, your breakout scan flags a stock, XYZ, trading at $2.50. Your analysis shows a logical stop-loss should be placed at $2.30. The distance between your entry and your stop is $0.20 per share. This is your per-share risk.
To figure out your position size, you just divide your maximum dollar risk by your per-share risk: $50 / $0.20 = 250 shares
You would buy 250 shares of XYZ. If the trade works out, fantastic. If it hits your stop-loss, you lose exactly $50, which is just 1% of your account. You take the small hit and live to trade another day, completely unfazed.
Winning the Psychological Battle
Sticking to your plan when real money is on the line and prices are flashing red and green is the hardest part of this job. Fear will scream at you to take tiny profits too early. Greed will whisper temptations to hold on for "just a little more." Hope will try to convince you that a losing trade will eventually "come back."
This is the psychological war you have to win every single day. Your documented trading plan, your hard stop-loss orders, and the 1-2% rule are your weapons. They are designed to take the emotion and guesswork out of your decisions, turning trading into a disciplined, repeatable process.
Of course, after you execute these trades, you'll need to understand the tax implications of your profits and losses. To accurately assess your financial outcomes, you'll need a guide on how to figure capital gains.
Your First 30 Days: A Penny Stock Trading Launch Plan
Okay, let's turn all this theory into action. Think of the next month as your launchpad. What you do now sets the stage for everything that follows, building the disciplined habits of a professional trader from day one.
This isn't just a list of suggestions; it's a structured plan to build your trading business on a rock-solid foundation. Following these steps methodically is how you build confidence, stress-test your systems, and get your head right before a single dollar of real money is on the line.
Weeks 1-2: Building Your Foundation
The first two weeks are all about getting your infrastructure in place and defining your rules of engagement. This is the critical groundwork you absolutely must complete before even thinking about placing a practice trade.
- Select and Fund Your Brokerage: Get your account opened with a broker that offers low fees and fast, reliable execution. This is your most important tool.
- Configure Your Scanner: Time to set up ChartsWatcher. Get it configured and save those specific High Relative Volume and Breakout scans we built earlier. You'll be using these every single day.
- Define Your Risk: This is non-negotiable. Write down your maximum risk per trade (e.g., 1% of your starting capital) and your absolute maximum daily loss limit. This rule will save you from yourself.
- Write Your Trading Plan: Get it on paper. Outline the specific, objective entry and exit criteria for at least one of the strategies we've covered.
Your written trading plan is your constitution. It's the objective document you turn to when the market gets chaotic and emotions try to take over. Do not trade without it.
Weeks 3-4: Execution and Analysis
Now you're ready to step into the simulator. It's time to see how your plan holds up in a live market environment. The goal here isn't just to make "paper" profits; it's to collect data, find your weaknesses, and refine your process.
- Execute 50 Paper Trades: Using your paper trading account, take a bare minimum of 50 trades. Follow your trading plan to the letter, without any deviation.
- Log Every Single Trade: Keep a detailed trading journal. For every trade, you need to record your entry price, exit price, stop-loss level, the reason for taking the trade (the setup), and the final P&L.
- Conduct a Weekly Performance Review: At the end of each week, sit down and analyze your metrics. Calculate your win rate, your average win versus your average loss (your risk/reward ratio), and—most importantly—identify any recurring mistakes or psychological hurdles that keep popping up.
Here is a simple table to help you track your progress over the next month. Print it out, stick it on your wall, and hold yourself accountable.
30-Day Penny Stock Trading Launch Plan
| Week | Key Action Items | Completion Goal |
|---|---|---|
| Week 1 | Research and select a broker. Open and fund the account. Subscribe to and install ChartsWatcher. | Brokerage account funded. Scanner software installed and running. |
| Week 2 | Build and save the High Relative Volume & Breakout scans. Write down your risk rules & trading plan. | Scans are built. A clear, written trading plan is complete. |
| Week 3 | Begin paper trading. Execute at least 25 trades following your plan. Log every trade in a journal. | 25+ trades executed and logged. First weekly review completed. |
| Week 4 | Continue paper trading. Execute another 25+ trades. Conduct a final monthly performance review. | Minimum of 50 total trades completed. Final review identifies strengths & weaknesses. |
This checklist is your guide to starting the right way. By the end of this month, you won't just have a strategy; you'll have real-world data on how it performs and, more importantly, how you perform under pressure. This is the work that separates aspiring traders from consistently profitable ones.
Getting Started: A Few Hard Truths
Diving into penny stocks always kicks up a lot of questions. Beyond the charts and strategies, new traders are usually worried about the practical stuff: how much cash they really need, the rookie mistakes that'll cost them, and whether this whole market is just a minefield of scams.
Let's cut through the noise and get straight to the answers you need. Getting these things right from the start is what separates the traders who last from those who don't.
How Much Money Do I Really Need to Start?
You can technically open a brokerage account with a couple hundred bucks, but let's be honest—that's not a real starting point for serious trading. A tiny account makes proper risk management impossible. That non-negotiable 1-2% rule? Forget about it. A few commissions and a bad streak of trades—which happens to everyone—will wipe you out before you even get your footing.
A much more realistic starting capital is somewhere in the $2,000 to $5,000 range. This gives you enough breathing room to:
- Take meaningful position sizes while still keeping your risk on a tight leash.
- Absorb commissions and fees without it eating a huge chunk of your principal.
- Survive a string of losses—an inevitable part of the game—without blowing up your account.
What's the Single Biggest Mistake New Traders Make?
By far, the most common and devastating mistake is "holding and hoping." It's a classic story. A new trader jumps into a stock because of some social media hype or a hot tip. The moment they buy, it starts to tank. Their plan was to cut the loss small, but they don't.
Instead, they freeze. They hold on, praying for a miraculous turnaround. This emotional decision almost always turns a small, acceptable loss into a catastrophic one that can cripple an account.
Pros cut losses without a second thought. The secret is having a pre-defined exit plan—your hard stop-loss—for every single trade. You have to honor it, no matter what your gut is telling you in the heat of the moment.
Are All Penny Stocks Scams?
No, but you absolutely have to learn how to spot the difference. Plenty of legitimate small companies trade for under $5 a share on major exchanges like the NASDAQ or NYSE. These aren't shady operations; they're subject to strict financial reporting rules, which gives you a layer of transparency.
The real danger zone is the Over-The-Counter (OTC) market. Reporting standards there can be minimal to non-existent, making it a breeding ground for "pump and dump" schemes. In these scams, manipulators artificially inflate a stock's price only to dump their shares on hopeful buyers. A foundational rule for anyone starting out is simple: focus only on exchange-listed companies and always do your homework.
Ready to stop chasing tips and start finding high-probability setups like a professional? ChartsWatcher provides the powerful, real-time scanning and backtesting tools you need to build and validate a winning strategy. Find your edge at https://chartswatcher.com.
