Hanging Man Candlestick Pattern: A Complete Trading Guide
Understanding The Hanging Man Formation And Recognition
The hanging man candlestick pattern is a popular tool used in technical analysis. It's often seen as a strong predictor of bearish reversals. However, understanding its nuances is key to interpreting it correctly. Let's break down the visual structure of the hanging man, explore its implications, and learn how to differentiate it from similar candlestick formations.
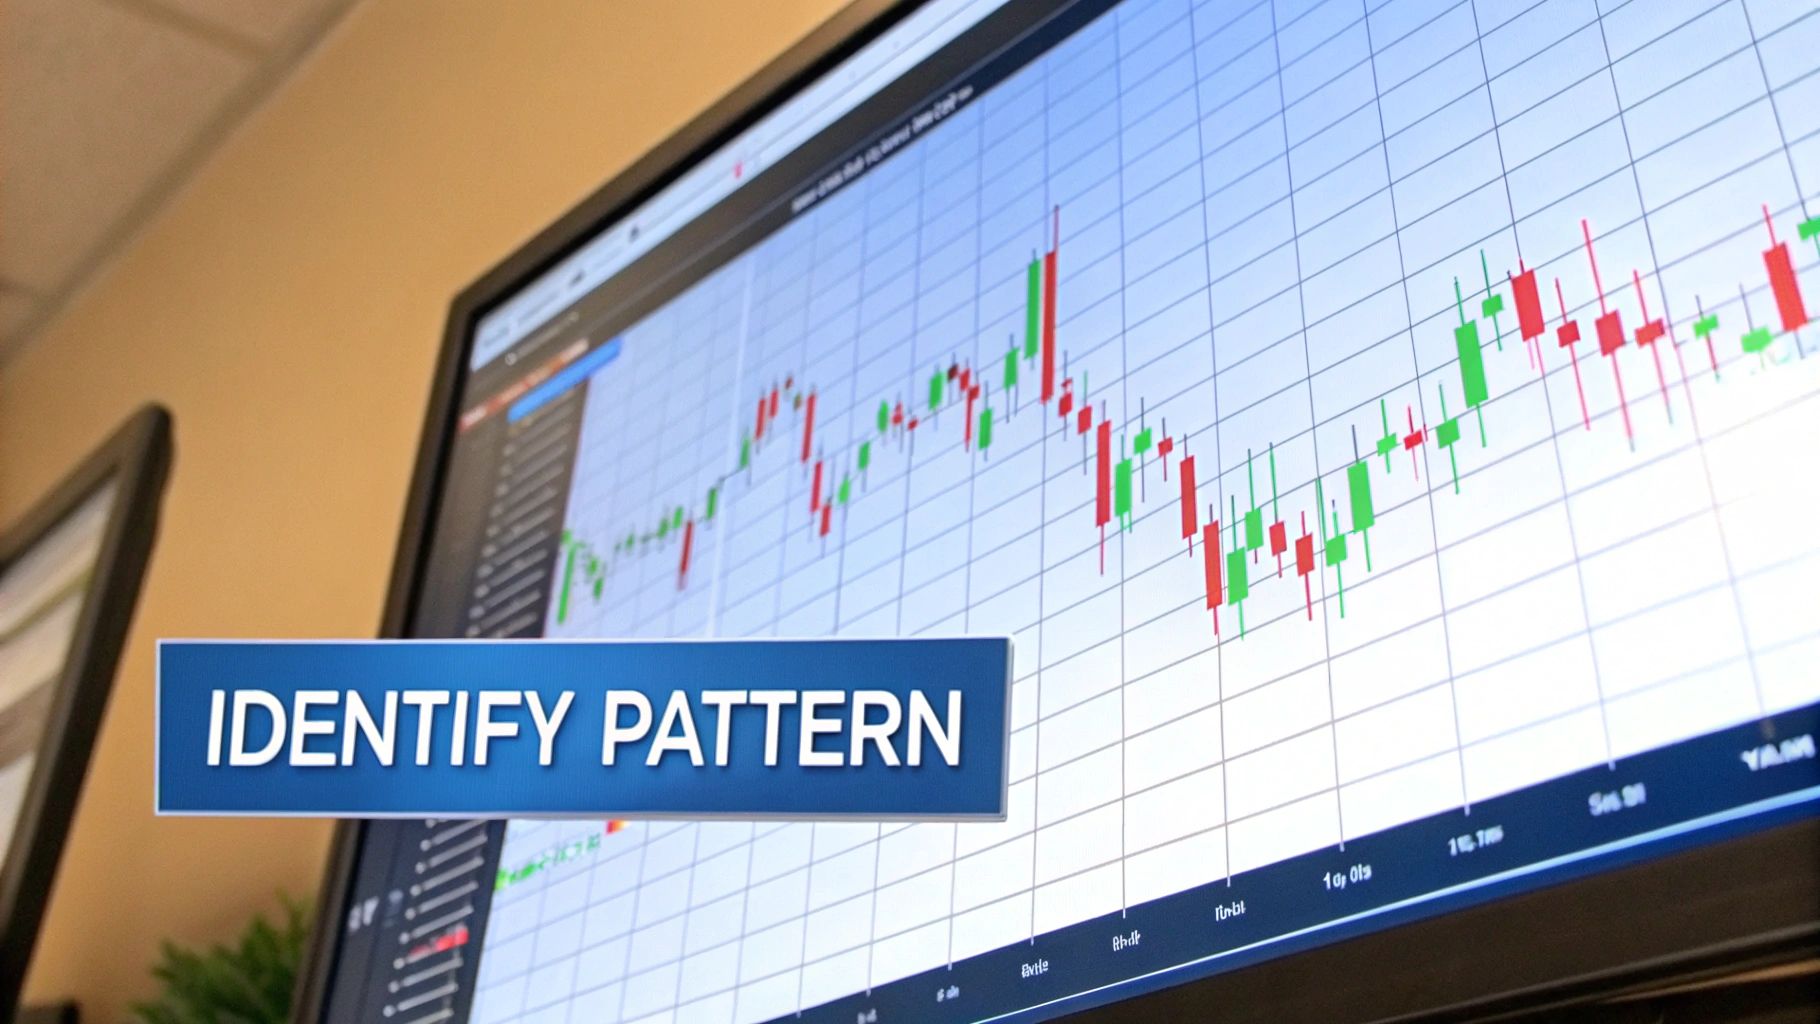
Identifying the Hanging Man
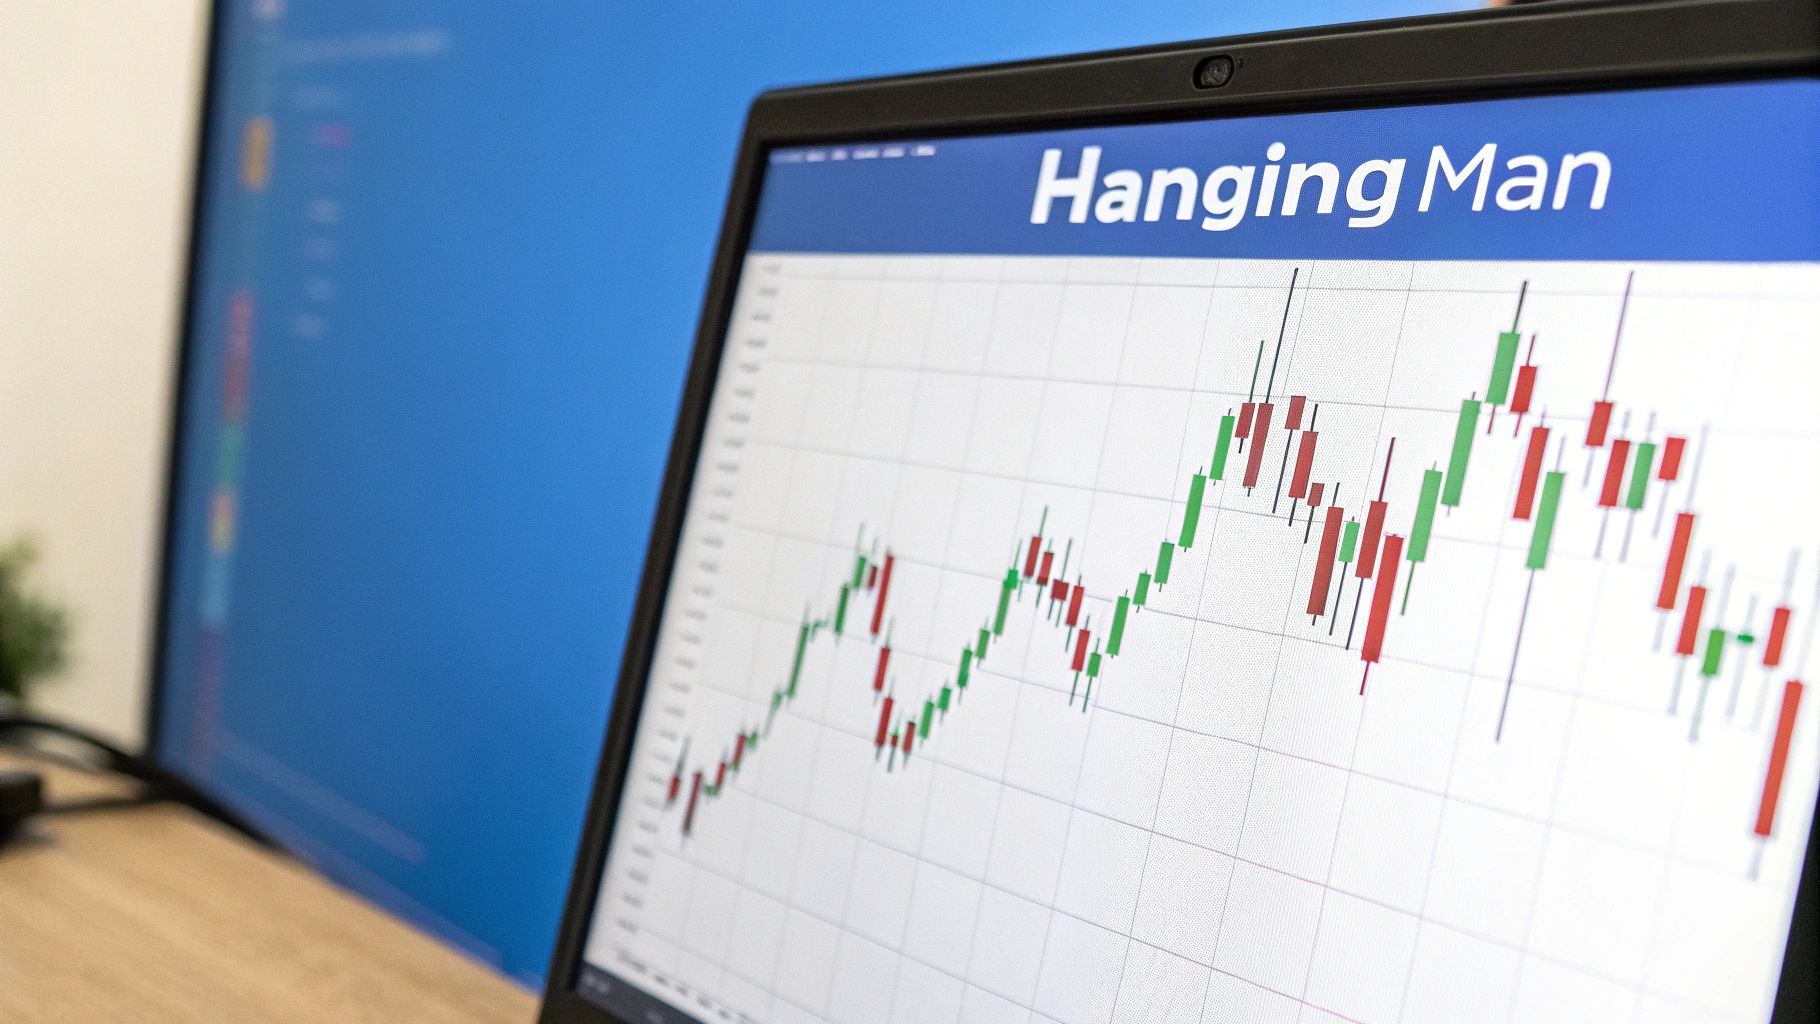
The hanging man's visual structure is crucial for both recognizing and interpreting it. This single candle pattern appears during an uptrend. It features a small real body, a closing price near the opening price, and a long lower shadow at least twice the length of the body. This extended lower shadow, visually resembling a hanging man, suggests a significant price drop during trading that buyers eventually recovered, pushing the price back up near its opening. Learn more at hanging man patterns. Remember, just seeing this pattern doesn't confirm a reversal.
Distinguishing the Hanging Man From Other Patterns
It's easy to confuse the hanging man with other candlestick patterns, particularly the hammer. Both have a small body and a long lower shadow. The key difference lies in the context of their appearance. The hammer forms during a downtrend, signaling a potential bullish reversal. The hanging man, on the other hand, appears in an uptrend, suggesting a possible bearish reversal. The hanging man can also resemble doji candles, which signal market indecision. The major distinguishing feature is the lower wick, significantly longer in the hanging man. Finally, the small real body of the hanging man differentiates it from spinning tops. Spinning tops display indecision through larger, more defined bodies and shadows of similar lengths.
Interpreting the Hanging Man's Psychology
The hanging man's long lower shadow offers valuable insight into market psychology. It indicates that sellers exerted significant pressure, driving the price down. However, the subsequent recovery by buyers, shown by the small real body near the top, suggests some bullish sentiment might remain. This back-and-forth between buyers and sellers creates uncertainty. It hints at a potential shift in market direction, but doesn't guarantee it. Confirmation is still needed. Think of the hanging man as a warning, not a definitive sell signal.
You might find this helpful: How to master technical trading patterns
Confirming the Reversal
The hanging man candlestick pattern can be a useful tool. Its effectiveness increases significantly when confirmed by subsequent price action and other technical indicators. A bearish candle following the hanging man, closing below its low, offers strong confirmation of a reversal. Increased trading volume during the downturn further strengthens the bearish signal. Traders often use indicators like the Relative Strength Index (RSI) or Moving Average Convergence Divergence (MACD) to confirm overbought conditions, increasing the likelihood of a successful reversal. For insights into AI in video content, explore platforms like: AI Video Generators. Understanding how these tools complement hanging man analysis is essential to maximize its predictive ability.
The Hard Truth About Hanging Man Performance Data
While often seen as a reliable signal for a bearish reversal, the hanging man candlestick pattern has a more complex story to tell. This section explores the actual performance statistics, helping you separate fact from fiction for smarter trading.
Unveiling the Hanging Man's True Nature
The hanging man's long lower wick visually hints at a potential downturn, which can be misleading. Its bearish reputation often obscures its true behavior. In reality, the hanging man can signal a continuation of an uptrend. This highlights the importance of confirmation signals and understanding the broader market.
Separating Myth From Reality: A Statistical Perspective
Many traders mistakenly believe hanging man patterns consistently predict bearish reversals. Research suggests otherwise. One study showed the hanging man acts as a bullish continuation 59% of the time. It ranked 16th in frequency out of 103 candlestick patterns, but only 87th in performance. This difference between how often it appears and how effective it is emphasizes the risk of relying on it alone. Find more detailed statistics here
The Importance of Confirmation Signals
This data reinforces the need for confirmation before acting on hanging man signals. Identifying the pattern is not enough. Look for other indicators, such as:
- Increased volume on down candles
- Breaks below support levels
- Bearish readings from momentum oscillators like the Relative Strength Index (RSI)
These can help filter false signals and improve your trading accuracy.
Understanding Performance Variations Across Markets
The hanging man's performance can change across markets and timeframes. It may be more reliable in certain asset classes or market conditions. Its effectiveness also depends on the timeframe, whether daily, hourly, or shorter. Understanding these nuances is key for any trading strategy.
Developing Realistic Expectations and Avoiding Losses
Recognize the hanging man's limitations to form realistic expectations. Don't rely solely on it; instead, incorporate it into a larger trading plan. Include other technical indicators, risk management strategies, and a solid understanding of market context. This approach will help you make informed decisions and potentially improve your trading results. Volume analysis, trend identification, and confirming indicators can make hanging man signals much more accurate. Understanding the pattern's limitations also allows for better risk management and protects your capital.
Market Context That Actually Matters For Success
Recognizing a hanging man candlestick pattern is only half the battle. The true power of this pattern lies in understanding the surrounding market conditions. This section explores those crucial factors, helping you interpret the hanging man’s signals effectively.
Bull Vs. Bear Markets: A Dramatic Impact
The prevailing market trend significantly influences how we should interpret the hanging man. In a bull market, with rising prices, the hanging man often represents a brief pause rather than a reversal. Buyers typically step in, resuming the upward trend.
However, in a bear market, with declining prices, the hanging man carries more weight. It can confirm the continuation of the downward movement. Understanding the broader market direction is essential before acting on this pattern.
The Importance of Trading Volume in Signal Confirmation
Trading volume plays a crucial role in validating the hanging man. High volume, especially in the lower shadow, strengthens the bearish signal. This indicates strong selling pressure.
Conversely, low volume weakens the signal, suggesting a lack of conviction among sellers. This is especially true within a bull market. Therefore, consider volume as a key confirmation tool.
Preceding Uptrend Characteristics
The characteristics of the uptrend leading to the hanging man offer valuable insights. A steep, rapid uptrend is more prone to sudden reversals, increasing the hanging man's significance.
A gradual uptrend is less likely to reverse abruptly, making the hanging man less reliable in this scenario. Examining the prior price action provides context for the pattern.
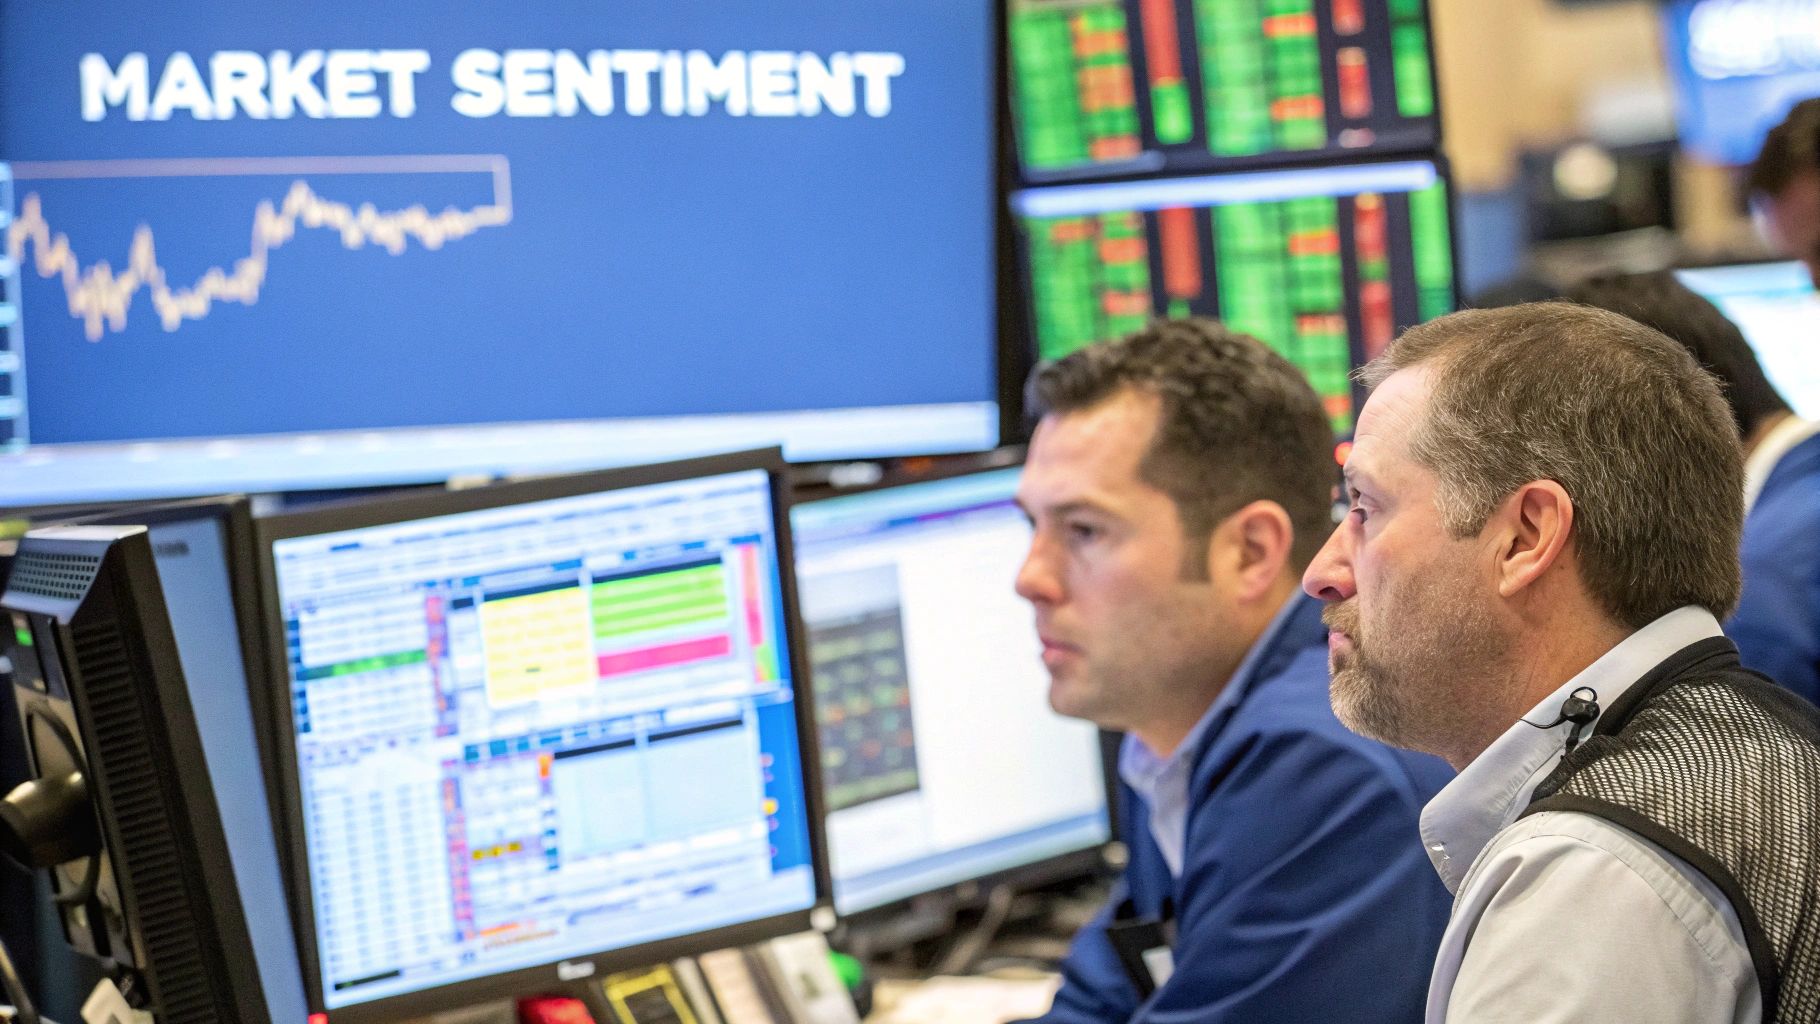
Broader Market Sentiment and Economic Conditions
The overall market sentiment and economic conditions also impact the hanging man's effectiveness. Positive news and strong economic data create a bullish environment, reducing the chance of a reversal.
Negative news and weak economic data contribute to a bearish backdrop where the hanging man's signal becomes more credible. Staying informed about market sentiment is crucial.
Sector-Specific Factors
Finally, sector-specific factors influence how the hanging man plays out. A strong sector may easily overcome hanging man patterns. A weaker sector becomes more vulnerable to the suggested reversals.
Analyzing both the overall market and the specific sector offers a more nuanced perspective. This approach can prevent misinterpretations and improve trading decisions. Considering the hanging man candlestick pattern historically, its reversal success is lower in bull markets. In bear markets, downward breakouts can sometimes result in price drops averaging 3.60% over 10 days.
Confirmation Strategies And Smart Risk Management
Successful traders know that the hanging man candlestick pattern, while visually striking, needs confirmation. They rely on checks and balances to validate signals and manage risk effectively. This section explores proven methods for confirming hanging man signals and using smart risk management techniques.
Confirmation Techniques for Increased Accuracy
The predictive ability of the hanging man pattern gets much stronger when combined with other indicators. This helps filter out false signals and provides a more complete market picture.
-
Support and Resistance Analysis: A hanging man appearing near a key resistance level reinforces the bearish signal. This suggests potential selling pressure at that level, making a reversal more probable. If it appears near support, however, it might indicate the uptrend will continue.
-
Momentum Oscillators: Indicators like the Relative Strength Index (RSI) and the Moving Average Convergence Divergence (MACD) can confirm overbought or oversold conditions. A hanging man appearing with overbought oscillator readings adds to the bearish signal.
-
Trend-Following Indicators: Combining the hanging man with trend-following indicators like moving averages gives helpful context. A hanging man below a key moving average supports the bearish case, particularly in a downtrend.
To help understand the various confirmation indicators available, let's look at a comparison table. This table summarizes different indicators, their effectiveness, ideal timeframes, and reliability.
| Indicator Type | Effectiveness Rating | Best Timeframe | Key Signals | Reliability Score |
|---|---|---|---|---|
| Support & Resistance | High | All Timeframes | Convergence with resistance | 8/10 |
| RSI | Medium | Short-term (14-period) | Overbought conditions (above 70) | 7/10 |
| MACD | Medium | Medium-term | Bearish crossover, overbought conditions | 6/10 |
| Moving Averages | High | Medium to Long-term | Hanging man below key moving average | 8/10 |
As the table shows, combining the hanging man with support and resistance or moving averages generally provides the strongest confirmation. While RSI and MACD offer additional insights, their reliability is slightly lower.
Visualizing Hanging Man Performance Metrics
The infographic below visualizes key data for the hanging man strategy: reversal probability, average risk-reward ratio, and monthly frequency.
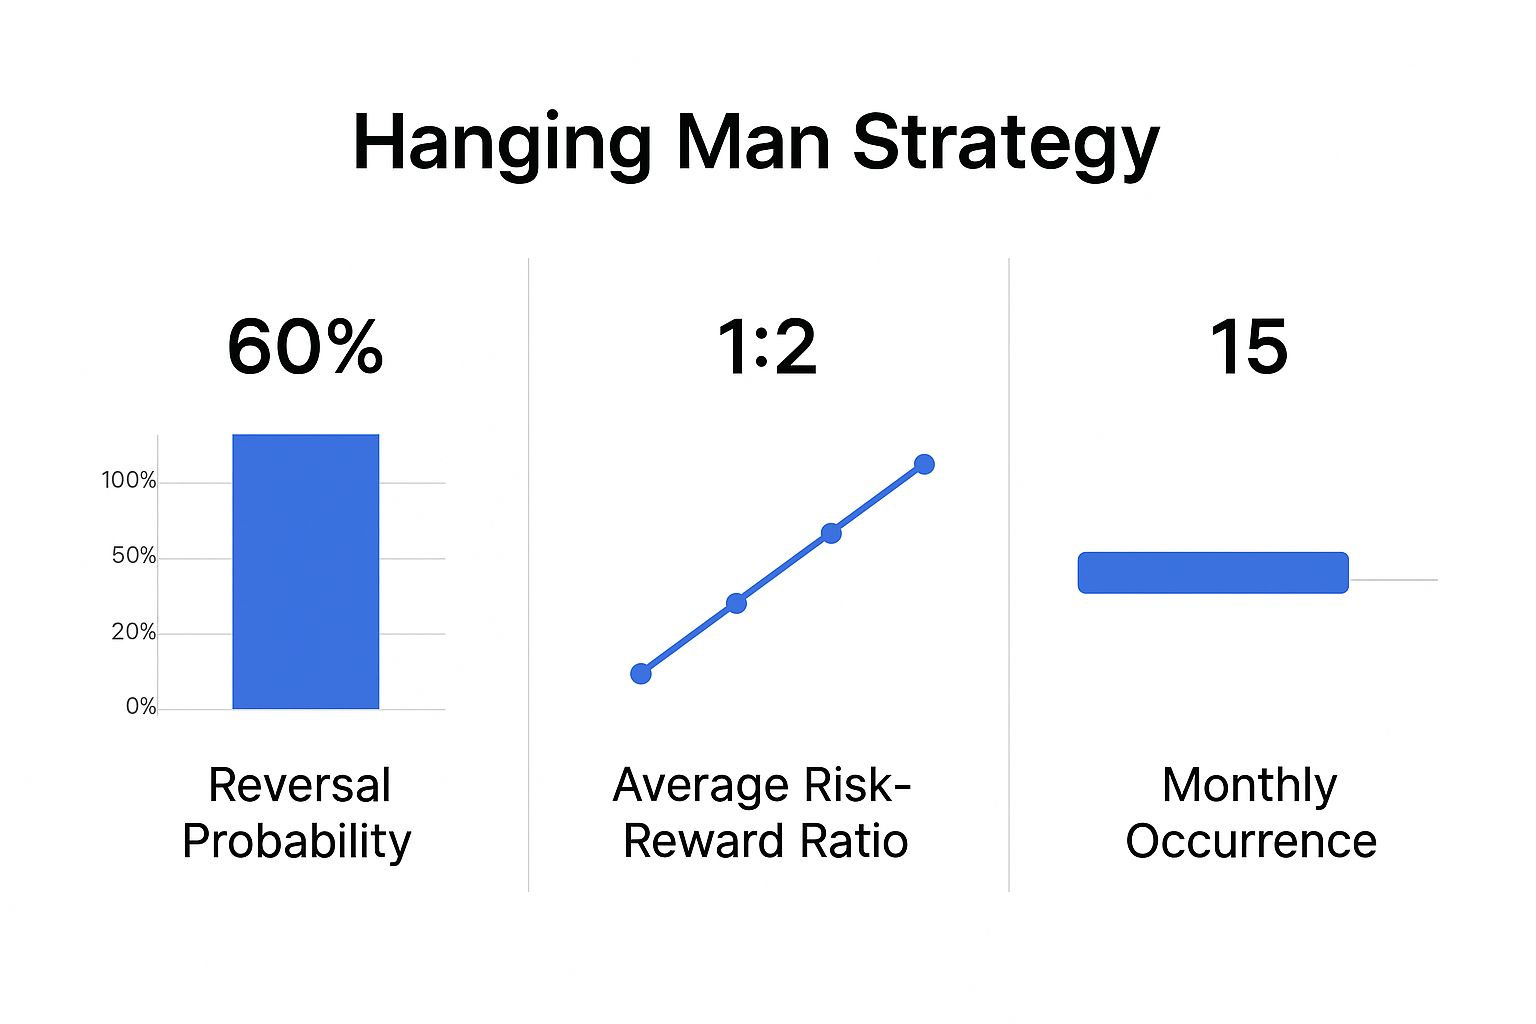
The infographic shows the hanging man appears frequently, but its reversal probability is moderate. This underscores the need for confirmation. The favorable risk-reward ratio highlights the potential for significant returns on successful trades.
Practical Risk Management Strategies
Even with confirmed signals, managing risk is paramount.
-
Position Sizing: Decide how much capital to allocate to each trade, based on risk tolerance and stop-loss level. Given the hanging man's statistical limitations, conservative position sizing is wise.
-
Stop-Loss Placement: Use a stop-loss order to limit potential losses. Placing it just above the hanging man's high is common.
-
Profit Target Setting: Set profit targets to realize gains. Base these on a fixed percentage or a technical level, like the next support level. Learn more in our article about How to master day trading risk management.
By using these techniques, traders can improve their decisions, increase their chances of success, and minimize losses when trading the hanging man pattern. Confirmation and risk management are as essential as identifying the pattern itself.
Critical Trading Mistakes And How To Avoid Them
Even experienced traders can stumble when interpreting the hanging man candlestick pattern. This section explores common errors that often lead to losses and offers practical advice on how to avoid them. We'll delve into why traders sometimes misinterpret the pattern's continuation potential, how emotions can affect judgment, and the importance of position sizing given the pattern's inconsistent performance.
Ignoring the Continuation Bias
One of the biggest mistakes is assuming the hanging man always signifies a reversal. While it can suggest a potential momentum shift, it's important to remember that markets often maintain their current trajectory. In fact, data shows the hanging man acts as a bullish continuation about 59% of the time. This highlights the need to confirm bearish signals with other indicators before acting solely on the hanging man.
Emotional Decision-Making
Fear and greed can easily overshadow statistical evidence, leading to rash trades based on the hanging man. The fear of missing out (FOMO) may push traders into short positions too quickly, while greed can delay taking profits when a bearish reversal doesn't happen. To mitigate these risks, incorporating other established methods can be beneficial. You might consider exploring these proven strategies for effective trading. Maintaining emotional discipline is vital for trading successfully using hanging man signals. This includes adhering to your trading plan, utilizing stop-loss orders consistently, and avoiding impulsive decisions driven by market fluctuations.
Neglecting Proper Position Sizing
Because the hanging man has a less-than-perfect track record, position sizing is crucial. Allocating excessive capital to a trade based only on this pattern exposes you to substantial losses if the reversal fails to occur. Instead, calculate your position size based on your stop-loss level and overall risk tolerance. A smaller position size limits potential losses while still allowing for profitable trades when the hanging man accurately predicts a bearish reversal.
Overlooking Market Context
Interpreting the hanging man without considering the bigger picture is another common error. Its reliability depends significantly on factors like the prevailing market trend, trading volume, and the asset's recent price history. For example, a hanging man appearing during a strong uptrend with low volume could indicate a brief pause rather than a significant reversal.
Learning From Trading Scenarios
Analyzing past trades provides valuable insights. Imagine a stock rallies significantly, followed by a hanging man candlestick pattern. A trader enters a short position based solely on this pattern, but the stock continues to climb. This underscores the importance of confirmation signals and proper risk management. Had the trader waited for a break below a support level or increased volume on down candles, they could have avoided a loss.
Checklist for Evaluating Hanging Man Setups
To avoid these mistakes, develop a checklist for objectively evaluating hanging man patterns:
- Confirming Indicators: Look for additional bearish signals, such as a break below a support level, increased volume on down candles, or negative readings from momentum indicators.
- Market Context: Analyze the broader market trend, the asset’s recent price action, and trading volume.
- Position Sizing: Calculate an appropriate position size based on your risk tolerance and stop-loss level.
- Stop-Loss Order: Always place a stop-loss order to limit potential losses.
- Profit Target: Establish a profit target to secure gains if the bearish reversal occurs as anticipated.
By implementing these strategies and cultivating a disciplined approach, you can significantly improve your chances of success when using the hanging man candlestick pattern. This approach empowers traders to take calculated risks and make decisions based on analysis, not emotion.
Building A Complete Hanging Man Trading Strategy
Building a profitable trading strategy around the hanging man candlestick pattern requires more than just spotting the pattern. It's about integrating it into a bigger picture that includes market context, confirming signals, and smart risk management. This section will walk you through creating such a strategy.
Combining Hanging Man Analysis With Broader Market Analysis
While the hanging man can suggest a potential reversal, it's essential to analyze it within the broader market context. A hanging man during a strong uptrend, for instance, might just be a pause before the uptrend continues.
Conversely, during a downtrend, it can reinforce the downward movement. Understanding the overall market direction, whether bullish or bearish, is key when interpreting the hanging man. Also, think about sector-specific factors. A robust sector may be less vulnerable to reversals signaled by the hanging man, while a weaker one might be more susceptible.
Integrating Technical and Fundamental Analysis
Technical analysis tools like TradingView can significantly improve the reliability of hanging man signals. Combining the pattern with indicators like support and resistance levels, momentum oscillators (such as RSI), and trend-following indicators (like moving averages) can offer a more complete view.
For example, a hanging man forming near a key resistance level, coupled with overbought RSI readings and a bearish crossover on the MACD, substantially strengthens the bearish signal. Incorporating fundamental analysis can also provide valuable insights. Analyzing a company's financial health, industry trends, and the overall economic outlook can help determine if the hanging man signals a true reversal or a temporary fluctuation.
Tailoring Your Strategy to Different Trading Styles
How you interpret and act on the hanging man depends on your trading style. A scalper, focused on short-term price changes, might enter a short position right after a hanging man appears, with a tight stop-loss.
A day trader might wait for confirmation from the next candle or a break below a support level before entering a trade. A swing trader, holding positions for several days or weeks, would likely look for confluence with longer-term trend indicators before acting on the hanging man.
Step-by-Step Strategy Development Process
-
Define your trading style: Are you a scalper, day trader, or swing trader? This determines your entry and exit rules.
-
Identify market conditions: Concentrate on markets where the hanging man has historically performed well.
-
Establish entry rules: Decide on the specific criteria for entering a trade, such as confirmation from other indicators or a break below support.
-
Set stop-loss and profit targets: Define clear exit points to manage risk and secure profits.
-
Backtest your strategy: Test your rules on historical data to assess its effectiveness. Tools like TrendSpider are helpful for this purpose.
-
Refine and optimize: Adjust your rules based on backtesting results to improve profitability.
To help you understand the potential performance variations across different trading styles using the hanging man strategy, let's look at some hypothetical performance metrics. The following table provides a comparison of win rates, average returns, and risk measures across various market conditions.
Hanging Man Strategy Performance Metrics: Statistical comparison of different hanging man trading strategies showing win rates, average returns, and risk-adjusted performance across various market conditions.
| Strategy Type | Win Rate % | Average Return | Max Drawdown | Risk-Reward Ratio | Best Market Conditions |
|---|---|---|---|---|---|
| Scalping | 65% | 0.5% | 2% | 1:1 | Volatile markets |
| Day Trading | 55% | 1% | 5% | 1:2 | Trending markets |
| Swing Trading | 45% | 3% | 10% | 1:3 | Consolidating markets |
This table showcases hypothetical performance metrics, and actual results can differ. It’s important to continually monitor and refine your strategy based on its performance. Track key metrics like win rate, average return, maximum drawdown, and risk-reward ratio. Backtesting your strategy in different market conditions helps identify strengths and weaknesses. By consistently analyzing and adapting, you can turn the hanging man pattern from a simple visual cue into a robust element of a comprehensive trading strategy.
