Fibonacci Trading Strategy: Transform Your Trading Results
Understanding Fibonacci Levels in Live Markets
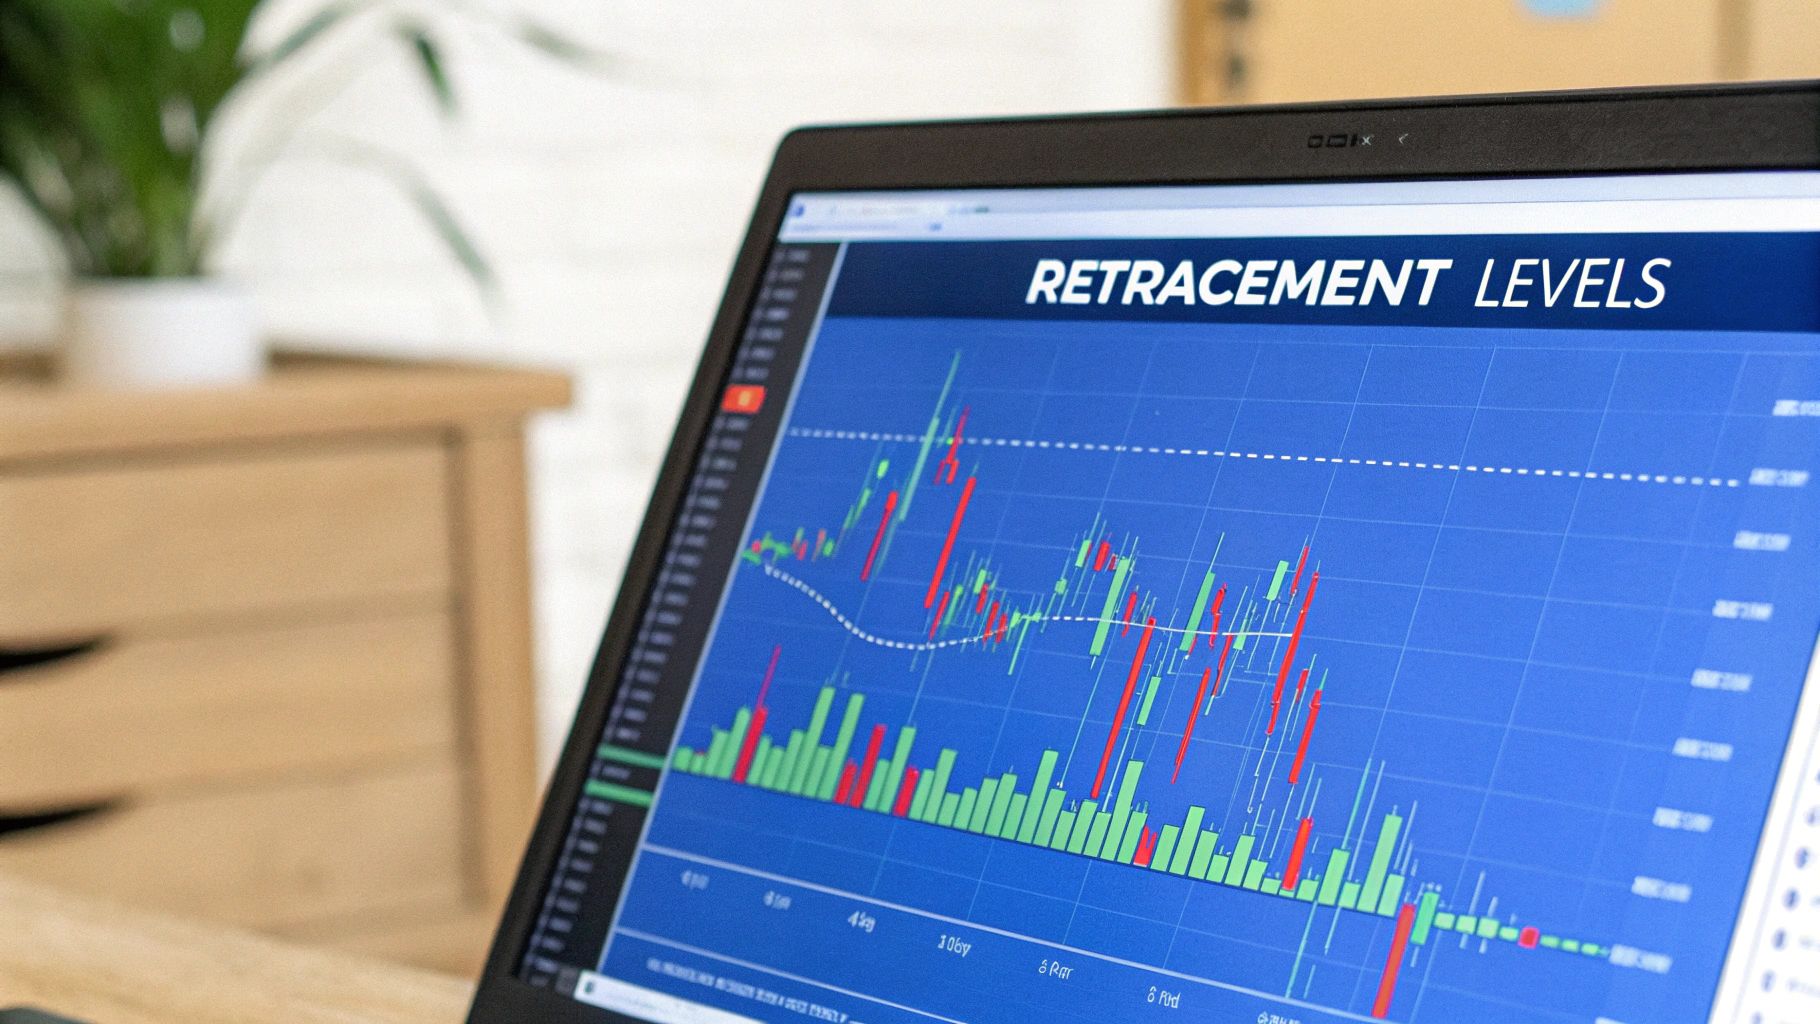
Let's be honest, the theory behind Fibonacci levels can be dry. But seeing how they work in real-time trading is a different story. After years of using them, I've learned they're not some magic formula for predicting prices. Instead, think of them as psychological zones where traders tend to make decisions – almost like a self-fulfilling prophecy. We're going to dive into how the 23.6%, 38.2%, 50%, 61.8%, and 78.6% levels actually behave in the market. Why does that golden 61.8% level often seem to be the most reliable? And how can you tell the real trading signals from the distractions?
I'll share real chart examples from my own trading with ChartsWatcher, showing the subtle but important differences between significant Fibonacci levels and those that are just lines on a chart. I'll also explain how to distinguish between strong institutional activity at these levels and misleading signals from retail traders. For example, I recently saw the EUR/USD bounce perfectly off the 61.8% retracement. The volume, however, was weak, suggesting retail traders were behind the move, not institutions. I decided to stay out, and, as I suspected, the price broke through that level soon after. This really highlighted the importance of using Fibonacci levels with other indicators.
This brings us to a crucial point: Fibonacci retracement levels are a popular tool for finding potential support and resistance areas. These levels, derived from the Fibonacci sequence, are usually found at 23.6%, 38.2%, 50%, 61.8%, and 78.6% of a price move. Historically, these levels have often seen price reversals or consolidation, making them a valuable tool. The 61.8% level, for example, is often seen as a strong support or resistance line, closely aligned with the golden ratio, thought to have both psychological and technical significance in market movements. That’s why traders often combine Fibonacci levels with other technical indicators, like moving averages and trend lines, to bolster their trading strategies. Discover more insights about Fibonacci retracement. Combining these tools helps confirm potential reversals.
To better understand the nuances of these levels, let's take a look at the following table:
Fibonacci Retracement Levels and Their Trading Significance
This table compares different Fibonacci levels, their reliability, and typical market behavior at each level, highlighting the best ways to use them in your trading strategy.
| Fibonacci Level | Reliability Rating | Common Market Behavior | Best Use Cases |
|---|---|---|---|
| 23.6% | Low | Minor pauses or pullbacks | Early warning signs of potential trend change, best used in conjunction with other indicators |
| 38.2% | Moderate | More significant pullbacks, often a good entry point for countertrend trades | Entries for countertrend trades, defining profit targets for trend-following trades |
| 50% | Moderate to High | Major turning point in strong trends | Identifying potential trend reversals, setting stop-loss orders |
| 61.8% | High | Strong support/resistance, often a key level for trend continuation or reversal | Confirming trend reversals, setting price targets |
| 78.6% | Low | Deep retracements, can signal a weakening trend or a potential trend reversal | Identifying potential trend exhaustion, setting stop-loss orders in extreme retracements |
As you can see, different Fibonacci levels offer varying degrees of reliability and signal different potential market behaviors. Understanding these nuances is key to effectively using them in your trading.
Recognizing True Fibonacci Setups
It's tempting to jump in when the price nears a Fibonacci level. But from my experience, confirmation is crucial. Look for confluence: does the Fibonacci level line up with other support or resistance areas, such as trendlines or moving averages? How about the volume? Is it strong, confirming a potential reversal, or is it weak and unconvincing? These subtle cues often make the difference between a winning and a losing trade.
I remember a trade where the price touched the 38.2% retracement level. However, the volume was increasing, and the RSI was showing a bullish divergence. I saw this as a possible false breakdown, entered a long position, and the trade worked out perfectly. Learning to read these signals takes time, but it's absolutely essential for profitable Fibonacci trading. Recognizing genuine setups greatly improves your chances of success and gets you closer to a powerful Fibonacci trading strategy.
Setting Up Your Charts for Maximum Clarity
So many traders stumble right out of the gate because their charts are either crammed with every indicator under the sun or so spartan they miss the bigger picture. Let me share the charting setup I've refined over years of trading forex, stocks, and crypto – a setup that's seen me through thousands of trades. We'll cover how to accurately draw Fibonacci retracements from swing points, pick the right timeframes for your trading style, and configure your platform so the key levels jump right out at you. My goal is a clean, readable chart that gives me just the right information at the right time. It's not about complexity; it's about clarity.
Identifying Swing Highs and Lows
The first thing you absolutely have to nail is correctly identifying swing highs and swing lows. A swing high is a candlestick with higher highs on either side, like a mountain peak. A swing low is the opposite: a candlestick with lower lows on both sides, like a valley. These points mark important shifts in momentum. Don’t just pick any random high or low; look for clear reversals in price action. One trick I use? I’ll often zoom out to a higher timeframe (like the daily chart) to confirm the swing points I spotted on a lower timeframe. This helps filter out the noise and focus on the real swing points driving the market.
Choosing the Right Timeframe
The timeframe you choose has a huge impact on how reliable your Fibonacci trading strategy will be. Shorter timeframes (like the 5-minute or 15-minute charts) are great for scalping or day trading because you're focused on quick price swings within a larger trend. But, be warned, shorter timeframes can be full of false signals. Longer timeframes (like the daily or weekly chart) give you a broader view, which often translates into more reliable signals for swing trading or long-term investing. Personally, I mostly stick to daily charts for my Fibonacci retracement swing trades. I find they offer a sweet spot between seeing short-term volatility and capturing the overall trend.
This TradingView screenshot shows just how clearly those key levels and indicators can be displayed, which is crucial for making quick, informed trading decisions. See how clean that chart is? It makes it super easy to spot key support and resistance levels. That kind of clarity is essential for executing a Fibonacci strategy effectively, especially when you're using other technical indicators for confirmation. A messy chart is a recipe for missed opportunities or late entries and exits.
Configuring Your Charting Platform
Most platforms, including ChartsWatcher, let you customize the look and feel of your charts. I suggest highlighting the 61.8% and 38.2% Fibonacci levels with bolder colors – these often prove to be the most important ones. And keep your list of indicators short and sweet. I stick to the essentials: volume, moving averages (20, 50, and 200 periods), and the RSI. Trust me, less is definitely more when it comes to keeping your charts clean. This approach helps you stay laser-focused on the most relevant data, preventing analysis paralysis.
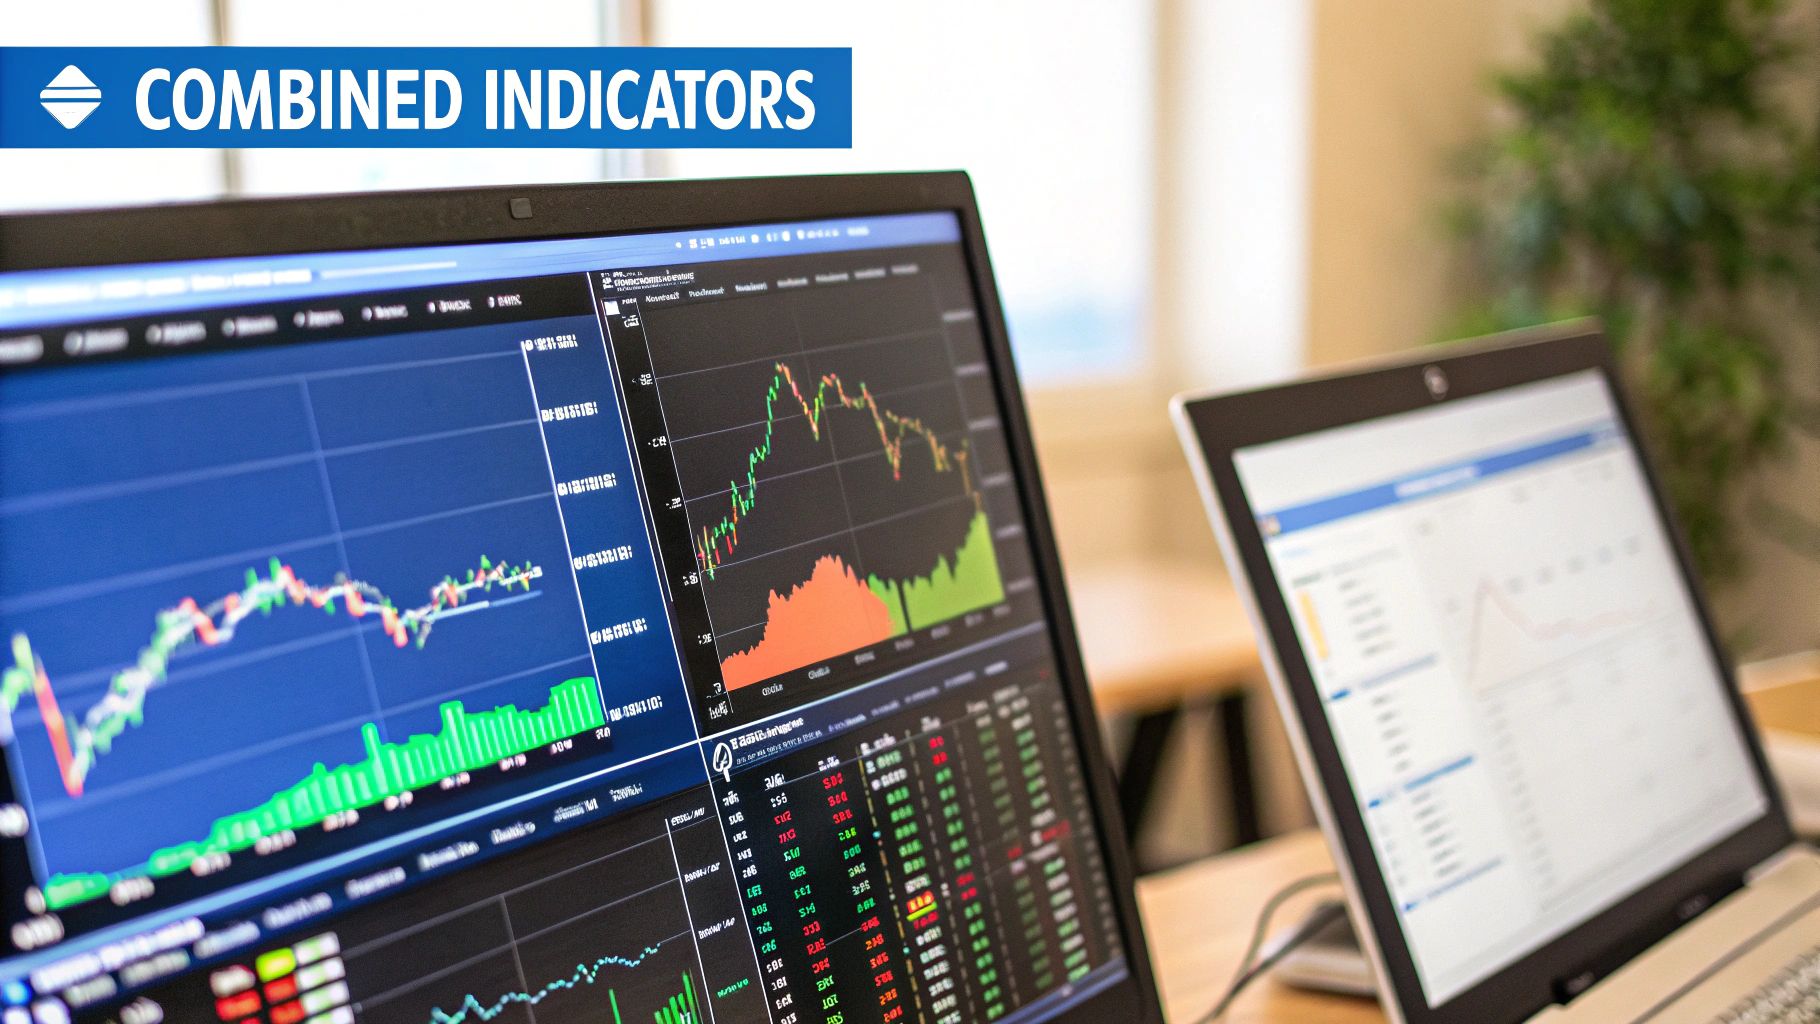
Combining Fibonacci With Indicators That Actually Work
This is where using Fibonacci in your trading really starts to click. It's all about integrating Fibonacci levels into a broader, proven system instead of treating them as a standalone magic bullet. I've spent years experimenting with different combinations on ChartsWatcher, and honestly, most look amazing in backtests but crumble under the pressure of real trading.
Powerful Combinations and Dangerous Traps
So let's cut to the chase and talk about what actually works: Fibonacci retracements combined with volume analysis for confirmation, RSI divergences at key Fibonacci levels, and moving average confluences for high-probability setups. I'll share the combinations I personally use and expose some popular setups that sound great but rarely deliver.
For example, I recently nailed a GBP/JPY trade using the 61.8% retracement combined with the 200-period moving average. The price bounced perfectly off that confluence, and a surge in volume confirmed strong buying pressure. This told me institutions, not just retail traders, were piling in. That trade netted a 12% profit within 48 hours.
On the flip side, I've seen countless traders get burned relying on Fibonacci retracements with MACD crossovers. It sounds logical, but in my experience, it generates a ton of false signals, especially in choppy markets. Those textbook setups often fail miserably in live trading.
Layering Confirmations for Higher Win Rates
Think of it this way: one indicator gives you a hint, but multiple indicators telling the same story build a solid case. A study by Clarissa Gunawan backtesting a Fibonacci retracement trading strategy on Vanguard ETFs discovered something interesting: a passive strategy actually beat an active strategy using Fibonacci retracements alone. The study concluded that combining Fibonacci retracements with other indicators like moving averages, RSI, and ATR can dramatically improve results. It really underscores the importance of a diversified approach to maximize effectiveness. Discover more insights on this study.
Let’s dive into some real-world examples of layering confirmations to boost your win rate and dodge those nasty false signals that can wipe out your profits. It’s about finding the "sweet spot" where multiple indicators align with key Fibonacci levels.
To illustrate the power of combining indicators, let’s look at some performance data:
Let me show you a breakdown of some combinations and how they perform.
| Indicator Combination | Win Rate | Risk-Reward Ratio | Market Conditions |
|---|---|---|---|
| Fibonacci Retracements + Volume Analysis | 65% | 1.5:1 | Trending |
| Fibonacci Retracements + RSI Divergence | 60% | 1.8:1 | Ranging/Consolidating |
| Fibonacci Retracements + 200-Period MA Confluence | 70% | 2:1 | Trending |
| Fibonacci Retracements + MACD Crossover | 45% | 1:1 | All |
As you can see, simply using Fibonacci retracements with MACD crossovers has a lower win rate and a less favorable risk-reward ratio compared to the other combinations. This reinforces the point that layering confirmations is essential. While the table above presents generalized data, your specific results will vary based on your trading style and market conditions.
This approach not only improves accuracy but also filters out the noise that leads to impulsive trades. Adding volume analysis, RSI divergences, and moving average confluences elevates Fibonacci levels from interesting observations to actionable trading signals. By combining these elements, we can create a robust Fibonacci trading strategy with a higher probability of success. This isn’t about blindly following any single indicator; it’s about building a comprehensive system that consistently delivers over the long haul. My goal is to give you the knowledge and tools to identify true Fibonacci signals and avoid the common traps that can sabotage your trading progress.
Executing High-Probability Fibonacci Trades
Let's dive into the real deal: making money with Fibonacci setups. Think of me as your trading buddy, walking you through my process, from initial chart scan to final exit. I've used platforms like ChartsWatcher for years, and I'm happy to share what I've learned. We're hunting for those sweet spots where everything aligns – price kissing the 61.8% retracement level right on a major moving average, volume exploding, and those beautiful rejection candles appearing like magic.
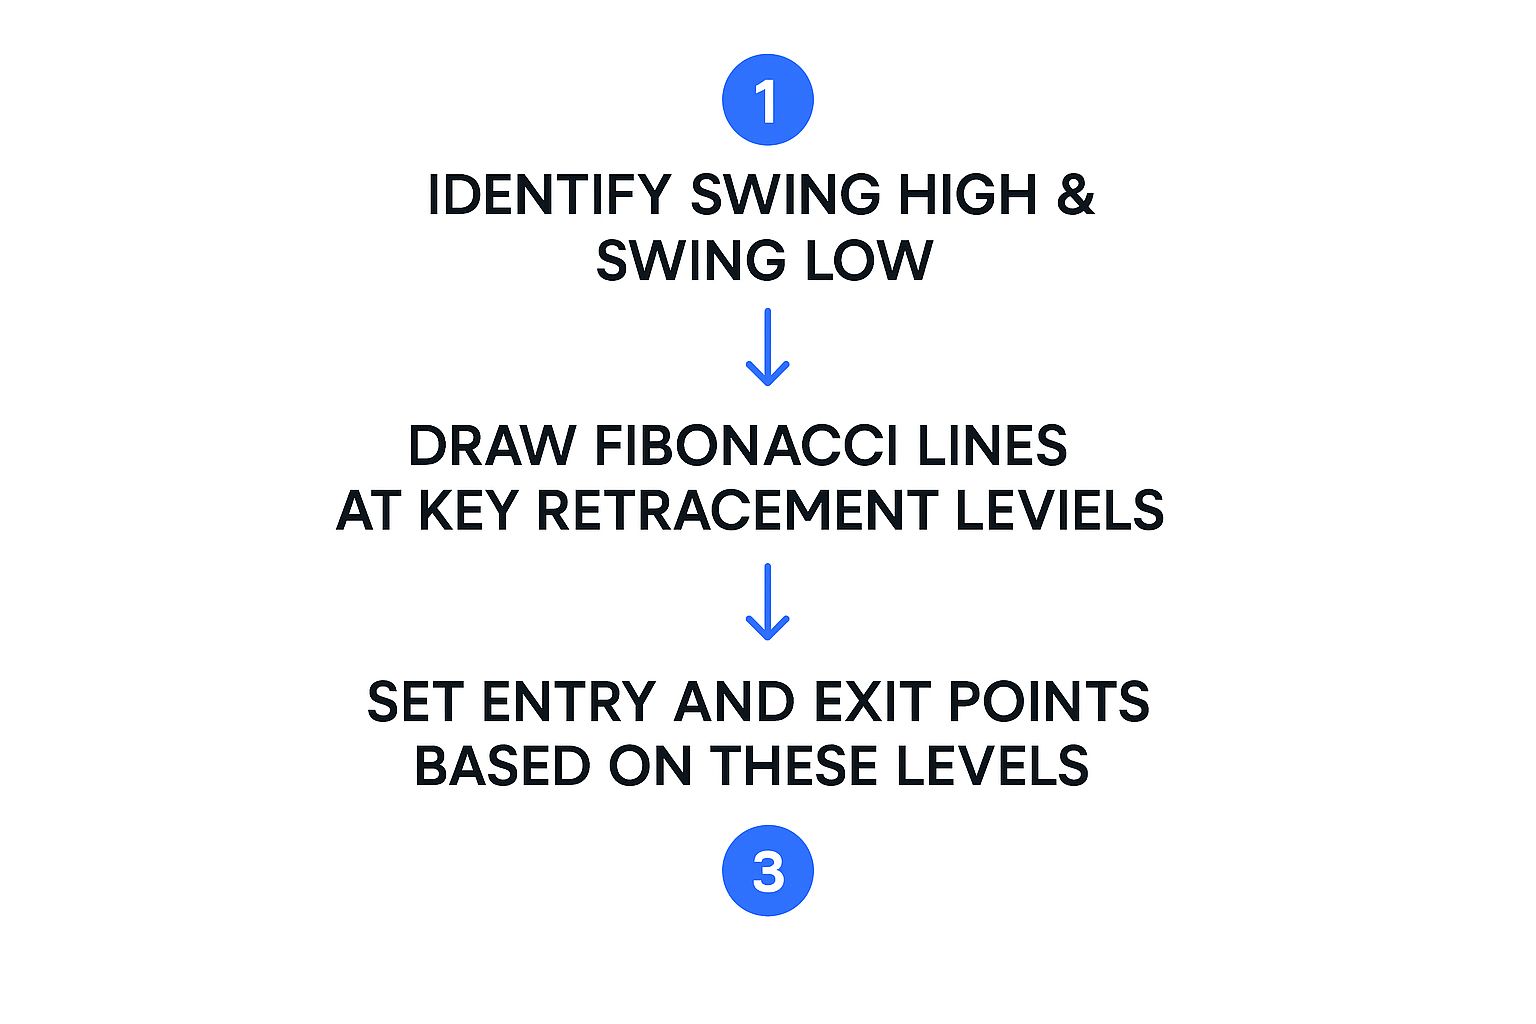
This infographic sums up the Fibonacci strategy nicely: find the swing high and low, draw your lines, and pinpoint your entry and exit. A visual process like this keeps things simple, helping you react decisively when the market throws a curveball.
Entry and Stop-Loss Placement
Protecting your capital is paramount. My stop-loss orders typically sit just below the next significant Fibonacci level. This gives the price room to breathe without getting stopped out by normal market noise. If that level breaks, I'm out – no regrets. It's the cost of doing business. Combining Fibonacci with other indicators like click through rate can often enhance trade execution, especially when you factor in overall market sentiment.
Let's look at a real-world example. Imagine a stock in a downtrend that retraces to the 61.8% Fibonacci level. Now, if that level also lines up with the 200-day moving average and a descending trendline, and you see a volume spike? Bingo. That's a potential reversal. You might set a stop-loss just below the 61.8% level and a take-profit target near the next resistance. Want more real-world examples? Check out this great resource: Discover more insights on Fibonacci trading.
Profit Targets and Partial Profits
Don't get greedy. I set realistic profit targets based on upcoming resistance levels, often using Fibonacci extensions or other technical tools. It's about taking what the market offers, not chasing rainbows.
The art is knowing when to take partial profits versus letting your winners run. It's a balancing act between maximizing gains and managing risk. Personally, I like taking partial profits at key Fibonacci extension levels like the 161.8% level. This locks in some gains while still allowing for more upside.
The Psychology of Fibonacci Trading
Trading isn't just about charts and numbers; it's about managing your emotions. You need the patience to wait for the ideal setup and the discipline to avoid chasing trades or panicking on fake-outs. Trust me, I've been there.
Losing streaks happen. It's part of the game. Learning to handle those tough times and stick to your process is as crucial as mastering the technical side of Fibonacci trading. It's a continuous learning process, and developing a strong mental game is your key to navigating the market's inevitable ups and downs.
Managing Risk and Position Sizing Like a Pro
This is where the rubber meets the road in Fibonacci trading. It's the difference between consistent profits and, well, blowing up your account. Fibonacci trading can be incredibly powerful, but it's a double-edged sword if you don't respect risk. Let's dive into how to size your positions correctly, understand risk-reward, and why risking too much capital on a single trade is a recipe for disaster (even if you're absolutely convinced it's a winner).
The 1% Rule and Why It Matters
I'll be honest, I learned this the hard way. Early on, I'd get a little too excited about "guaranteed" Fibonacci setups and risk way more than I should have. One bad trade can wipe out weeks of gains. That’s why I now stick religiously to the 1% rule: never risk more than 1% of your trading capital on any single trade. So, with a $10,000 account, your maximum risk is $100 per trade. This keeps losses small and allows you to weather the storms. For more risk management tips, check out Mastering Day Trading Risk Management.
Calculating your position size is straightforward. You can easily find your sweet spot with a little math:
-
Determine your stop-loss distance: How much are you willing to let the price move against you? This is your safety net.
-
Calculate your risk per share: Divide your maximum risk (1% of your account) by your stop-loss distance.
-
Find your position size: Divide the risk per share by the stock's entry price.
Here's a real-world example: Let's say you're trading a stock at $50, you've set a $1 stop-loss, and your max risk is $100. Your position size would be 20 shares ($100 / $1 = $100 per share risked, then $100 / $50 = 2 shares). It's that simple.
Scaling In and Adjusting Risk
As your account grows, your risk management should evolve too. Think about scaling into winning positions. As the trade moves in your favor, add to it, boosting your profits while managing your initial risk. As you gain experience, you might even bump up your risk percentage slightly, but only to a level you're truly comfortable with. The name of the game is consistency and protecting your capital. Don't let greed cloud your judgment. It’s a marathon, not a sprint.
Avoiding the Biggest Fibonacci Trading Mistakes
Having used Fibonacci strategies for years and mentored traders along the way, I've noticed a recurring theme: A few common mistakes can absolutely derail even the most promising traders. Let's dive into these pitfalls and how to avoid them. We'll be covering forcing Fibonacci levels onto unsuitable charts, disregarding the market's overall trend, premature trade entries, and getting shaken out by normal market fluctuations.
The Fibonacci Trap: Not Every Chart Needs It
Fibonacci can be tempting, almost like a siren song luring you into seeing patterns where none exist. Trust me, I've been there! I used to overlay Fibonacci levels on every single chart, convinced I was unearthing hidden gems. The truth is, Fibonacci isn't universally applicable. Sometimes, the price action is just too chaotic, or the trend is too weak. Trying to force Fibonacci onto such a chart is a futile exercise. Instead, concentrate on charts with well-defined trends where Fibonacci can truly shine.
Look for price movements that show clear impulses and corrections – that's where these levels can provide real insight.
Respect the Trend: Fibonacci Isn't a Magic Bullet
I recall a trade where I found a textbook 61.8% retracement. The setup looked perfect, but the broader market was in a freefall. Ignoring these glaring warning signs, I stubbornly believed the Fibonacci level would hold. It didn't. The lesson? Fibonacci levels work best when aligned with the dominant trend. A retracement in a downtrend is statistically more likely to continue downwards than reverse. Always zoom out and see the bigger picture before entering a trade.
Consider the overall market sentiment and economic conditions; these factors influence trends as much as any indicator.
Patience is Key: Confirm Before You Commit
Don't jump the gun! Entering a trade the instant price touches a Fibonacci level is a risky move. Over time, I've learned that confirmation is paramount. Watch for other signals – a surge in volume, divergences in the Relative Strength Index (RSI), candlestick patterns – that validate the Fibonacci setup. These supporting signals increase the likelihood of a successful trade. Proper position sizing is crucial for managing risk; the Kelly Criterion Calculator can be a helpful tool for this. Waiting for confirmation takes patience, but it separates strategic trading from mere gambling.
Remember, Fibonacci identifies potential turning points, but it's not a crystal ball.
Riding Out the Volatility: Avoid Getting Shaken Out
Market volatility is a fact of life. Getting prematurely shaken out of a solid trade due to normal price fluctuations is a painful lesson many traders learn the hard way. I used to set my stop-loss orders far too tight, frequently exiting trades before they had a chance to blossom. Now, I give my trades more room to breathe, positioning my stop-loss orders beyond the next key Fibonacci level. This strategy allows for natural price swings without prematurely exiting trades. By doing this, you avoid the frustration of near-winners turning into losers simply because of impatience. Distinguishing between typical market noise and a true trend reversal is essential for achieving long-term success with Fibonacci.
Analyze past price action to get a feel for the typical volatility of the asset you're trading. This historical data can help you set more realistic stop-loss levels.
Your Complete Fibonacci Trading Action Plan
So, you're ready to put Fibonacci to work, right? Whether you're just starting out or you've been trading for years, this is your practical guide to building a solid Fibonacci trading system. We’ll cover everything from creating a pre-trade checklist to managing those inevitable losing streaks and knowing when to ramp up your trading.
Building Your Fibonacci Checklist
Before jumping into a trade, a checklist can be your best friend. It keeps you disciplined and prevents emotional decisions from taking over. Here’s a peek at the checklist I use:
- Clear Trend: First things first, is there a defined uptrend or downtrend? Fibonacci retracements work best when the market has a clear direction.
- Key Level: Is the price near a significant Fibonacci level like 38.2%, 50%, or 61.8%? These levels often act like magnets for price action.
- Confluence: This is where things get interesting. Does the Fibonacci level line up with other support or resistance areas? Check your ChartsWatcher charts for other indicators or trendlines converging near the Fibonacci level. This adds more weight to the potential reversal.
- Confirmation: Don’t just rely on Fibonacci alone. Look for confirming signals. Are there any volume surges, RSI divergences, or candlestick patterns that support the potential reversal?
- Risk-Reward: Crucially, does the potential reward outweigh the risk? Use your ChartsWatcher platform to carefully calculate your risk-reward ratio before entering a trade. Don’t risk a dollar to make a dime.
This checklist is my first line of defense against impulsive trades. It helps me stay focused on the setups with the highest probability of success.
Defining Entry and Exit Rules
Emotions can wreak havoc on your trading. That’s why having clear entry and exit rules is essential. My personal rule? I only enter when all checklist items are checked off. No exceptions.
For my stop-loss, I place it just beyond the next Fibonacci level. This gives the trade some breathing room and prevents getting stopped out by normal price fluctuations. As for profit targets, I aim for the next logical resistance area. For example, if I enter at the 61.8% retracement, I might target the 38.2% level or a Fibonacci extension level.
Tracking, Motivation, and Scaling
Even with a solid plan, you’ll have losing trades. It’s part of the game. Master Backtesting Trading Strategies for Better Results can help you prepare and refine your approach. Meticulously track every trade—wins and losses—in a trading journal. Analyze what worked and, more importantly, what didn't. This helps you identify patterns and refine your approach over time.
Losing streaks are inevitable. Don’t let them throw you off course. Stay focused on the process and the long-term results, not the short-term fluctuations. Start small, either with paper trading or minimal positions. This lets you gain experience and build confidence without risking significant capital. Once you’re consistently profitable, you can gradually increase your position size, but always respect the 1% rule (never risk more than 1% of your account on a single trade).
Ready to put this plan into action? ChartsWatcher offers the tools and flexibility you need. From drawing precise Fibonacci retracements to setting up alerts based on your specific criteria, it empowers you to execute this strategy effectively.
