Efficient Scanning for Stocks: Tips & Strategies
The Evolution of Stock Scanning: From Manual to Modern
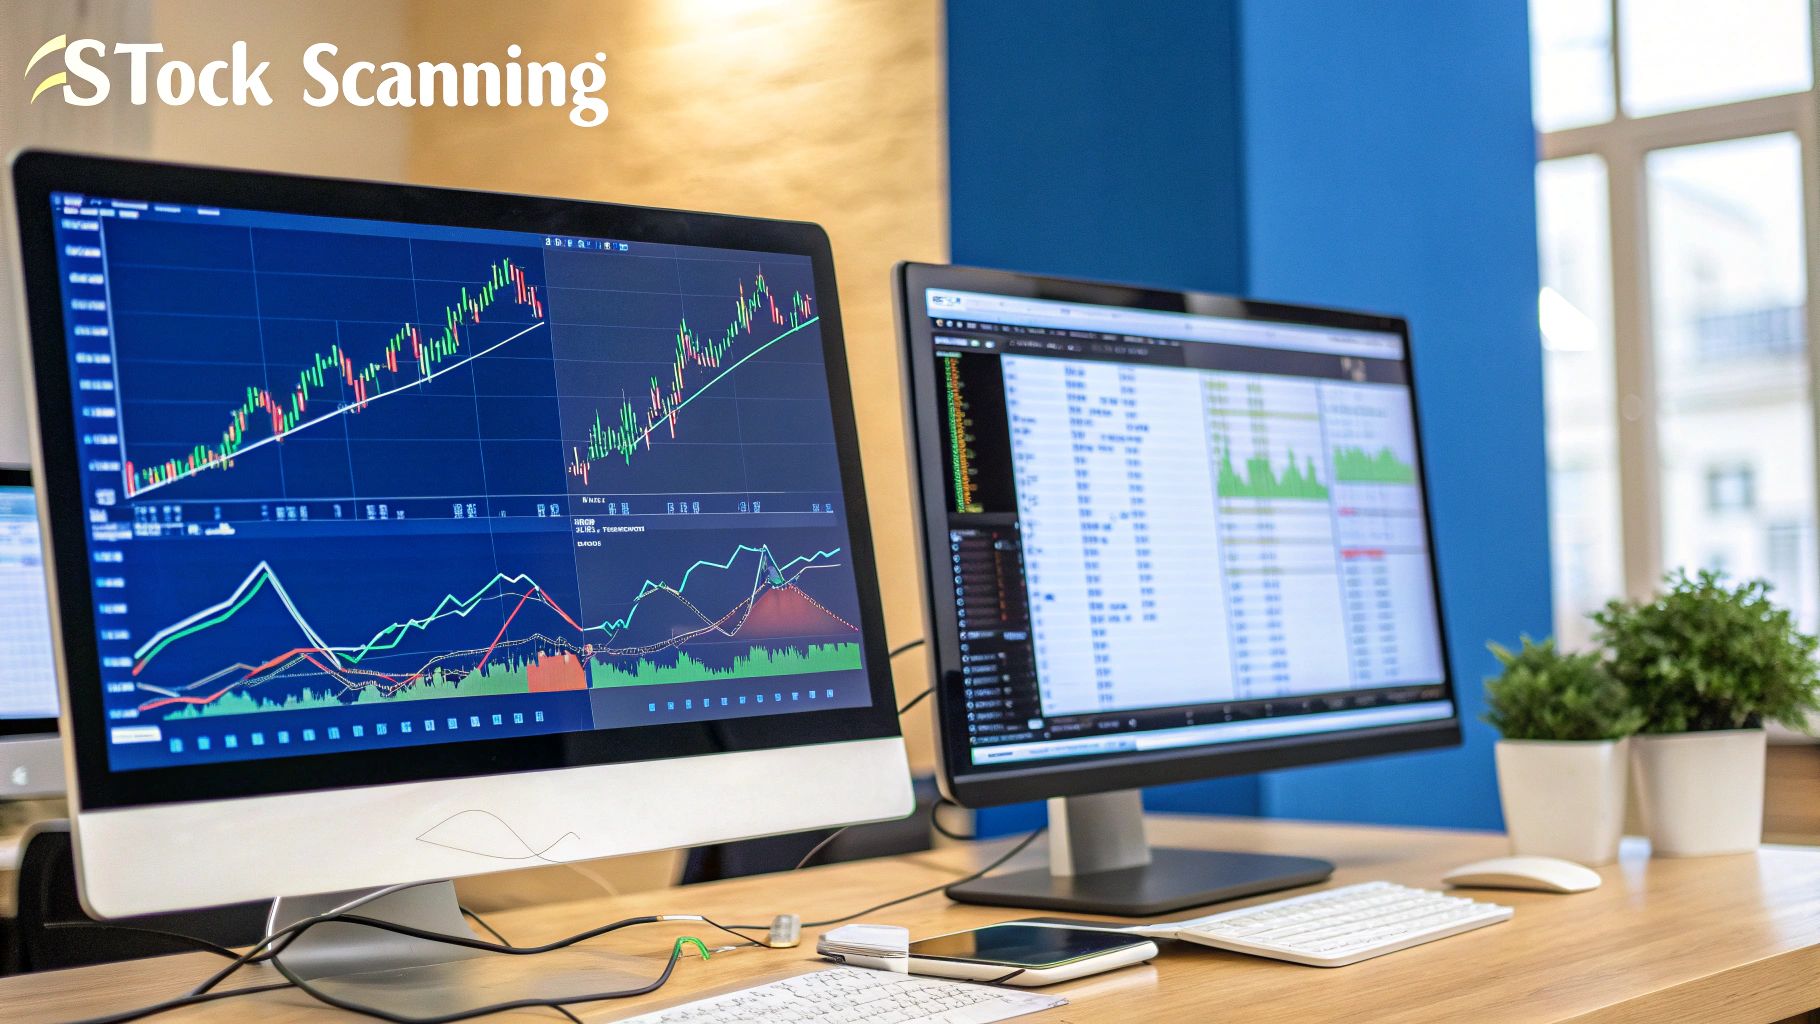
Identifying promising stocks was once a laborious task. Investors meticulously reviewed financial newspapers, listened to broker recommendations, and often relied on intuition. This manual approach was not only time-consuming but also frequently produced inconsistent results.
However, the arrival of digital technology has dramatically altered the stock scanning landscape. We now operate in a more efficient and data-driven environment. This shift has equipped both individual investors and financial professionals with powerful tools to navigate the complexities of the stock market.
The emergence of stock scanning software has democratized access to sophisticated market analysis. These platforms automate the process of filtering through thousands of stocks based on pre-defined criteria, saving investors significant research time.
For example, platforms like ChartsWatcher offer customizable dashboards and real-time data, enabling traders to monitor market movements with remarkable precision. Investors can now pinpoint potential investment opportunities in minutes, a stark contrast to the days or weeks required with traditional methods.
This evolution in stock scanning has also shifted the focus from subjective to objective analysis. Instead of relying on hunches or questionable advice, investors can now base decisions on concrete, quantifiable data. This data-driven methodology promotes systematic and disciplined investment strategies, ultimately driving more consistent outcomes. It highlights the importance of structured processes in filtering out market noise and recognizing genuine opportunities.
Stock scanning, as a technique for identifying investment prospects, has significantly evolved with advancements in data accessibility and technology. Take, for instance, the Scan Engine at StockCharts.com. As of 2024, it houses approximately 3,000 daily data points spanning roughly 12 years for over 50,000 stocks, indices, and mutual funds globally. This extensive dataset empowers users to sift through millions of data points daily to identify stocks meeting highly specific technical requirements. The Scan Engine continuously updates its data throughout the trading day, beginning at 9:31 AM Eastern Time. Users can build scans using daily, weekly, or monthly bars. This accessibility to data and the ability to screen across multiple timeframes has made stock scanning an indispensable resource for traders and investors. Learn more about the power of stock scanning: Scanning for Stocks: The Basics
The Impact of Modern Scanning Techniques
Modern scanning techniques have not only streamlined efficiency but also expanded the breadth of analysis. Investors can now screen for stocks based on a variety of factors, including:
- Price Action: This involves identifying stocks exhibiting specific price patterns such as breakouts or consolidations.
- Volume Patterns: Analyzing trading volume helps to validate the strength of price movements.
- Momentum Indicators: Technical indicators like the Relative Strength Index (RSI) or Moving Average Convergence Divergence (MACD) can be used to gauge market sentiment.
- Fundamental Metrics: Integrating financial data such as earnings growth or valuation ratios provides a more holistic view.
This multifaceted approach to scanning enables investors to develop more refined and targeted investment strategies.
The Future of Stock Scanning
The evolution of stock scanning is ongoing. With the growing influence of artificial intelligence and machine learning, we anticipate the emergence of even more sophisticated scanning tools. These advancements hold the promise of further refining the process of identifying promising investment opportunities, making the market more accessible and transparent for everyone. The key is to utilize these tools effectively, employing them to enhance human judgment and improve investment decision-making.
Technical Scanning Parameters That Actually Work
Finding the right stocks often depends on using the right technical parameters. Picking the wrong ones, or tweaking them too much, can lead to a flood of false signals. This can be frustrating and ultimately hurt your investment success. Understanding which indicators are effective is key.
Essential Technical Indicators
Several technical indicators have a proven track record of identifying potential trades. Used correctly, they offer valuable insights into price action, volume, and market momentum.
Moving averages, for example, smooth out price fluctuations and help spot trends. A simple moving average (SMA) calculates the average price over a set period. An exponential moving average (EMA) emphasizes recent prices more.
The relative strength index (RSI) measures the speed and change of price movements. It helps identify overbought or oversold conditions. An RSI over 70 usually suggests overbought conditions, while an RSI under 30 suggests oversold conditions. This can be helpful in spotting potential trend reversals.
The moving average convergence divergence (MACD) is another useful indicator. This momentum indicator compares two moving averages of a security's price. Traders often use MACD crossovers to generate buy or sell signals.
For more in-depth information on scanning techniques, check out our guide: 8 Proven Market Scanning Techniques for 2025.
Avoiding Over-Optimization
Many traders fall into the trap of over-optimization. This happens when parameters are adjusted excessively to perfectly match past market data. This approach often leads to poor real-world results.
For example, backtesting a strategy with very specific parameters might show amazing historical returns. However, this same strategy will likely underperform in live trading.
Focusing on broader trends and reliable indicator combinations can lead to stronger scanning strategies. It’s all about balancing sensitivity (finding opportunities) with specificity (avoiding false signals).
Tailoring Parameters to Trading Styles
Different trading styles benefit from different parameter settings. A day trader might focus on short-term moving averages and volatile price swings. A long-term investor, on the other hand, might prioritize fundamental factors and longer-term trends. Matching your scanning parameters to your trading style is essential.
Day traders might scan for stocks with high relative volume and price breakouts. Position traders might look for stocks with strong earnings growth and consistent upward trends. Regardless of your style, consistently reviewing and adjusting your parameters based on market conditions is critical.
This iterative process can greatly improve the accuracy and effectiveness of your scans. This, in turn, helps you pinpoint real market opportunities.
To help understand the different parameters and their applications, take a look at the table below:
Key Technical Parameters for Stock Scanning
Comparison of essential technical indicators used in stock scanning with their typical settings and best applications.
| Technical Parameter | Common Settings | Best For | Limitations |
|---|---|---|---|
| Simple Moving Average (SMA) | 50-day, 100-day, 200-day | Identifying long-term trends | Lagging indicator |
| Exponential Moving Average (EMA) | 12-day, 26-day | Identifying short-term trends and reversals | Can be susceptible to noise |
| Relative Strength Index (RSI) | 14-day | Identifying overbought/oversold conditions | Not always accurate for predicting reversals |
| Moving Average Convergence Divergence (MACD) | 12-day EMA, 26-day EMA, 9-day signal line | Identifying momentum shifts and potential buy/sell signals | Can generate false signals in choppy markets |
This table summarizes the common settings and uses of key technical indicators. Each indicator has its own strengths and weaknesses, making it vital to understand their limitations. Combining different indicators can provide a more comprehensive view of the market.
Beyond Charts: Integrating Fundamentals Into Your Scans
Technical analysis offers valuable insights into price action and momentum. However, relying solely on charts often overlooks a crucial element: a company's underlying financial health. By integrating fundamental analysis into your scanning process, you create a more holistic view.
This combined approach helps identify companies with promising price trends supported by strong business foundations. This can significantly reduce your risk of encountering value traps, where stocks appear cheap despite declining business prospects. It also helps avoid technical false breakouts, those temporary price spikes lacking genuine underlying strength.
Key Fundamental Metrics For Stock Scanning
Certain fundamental factors have consistently proven useful in predicting future performance. Combining these metrics with technical indicators enhances your analytical depth.
-
Earnings Quality: Don't just look at reported earnings. Dive deeper into metrics like cash flow from operations and return on equity (ROE) to truly understand a company's profitability. Consistent, strong cash flow often signifies a sustainable business model.
-
Valuation Ratios: Metrics such as the price-to-earnings ratio (P/E) and price-to-book ratio (P/B) can help determine if a stock is fairly valued. Remember, a low valuation alone doesn’t guarantee a good investment. Further research is always warranted.
-
Sector Strength: The overall performance of a company's sector plays a significant role. A thriving sector often benefits all its constituents, even those with less robust fundamentals. Conversely, a struggling sector can negatively impact even fundamentally sound companies.
This comprehensive approach is particularly valuable for long-term investors. While short-term traders may prioritize technical signals, long-term success hinges on the inherent strength of the underlying business. Many stock screening platforms, like Zacks Investment Research, combine fundamental and technical metrics to improve stock selection accuracy. Zacks provides a free stock screener and also offers premium plans for $249 and $299 annually. For more information on stock screeners, check out this resource: Find more detailed statistics here
Building Balanced Scans
Integrating fundamentals doesn’t mean discarding technical analysis. Instead, think of it as a way to refine your technical approach. One strategy is to scan for stocks breaking out to new highs that also demonstrate strong earnings growth. This provides fundamental validation for the technical signal.
Alternatively, consider scanning for stocks exhibiting bullish moving average crossovers that are also trading at a discount compared to their industry peers. This strategy targets stocks with both positive momentum and appealing valuations.
Practical Tips For Integrating Fundamentals
-
Start With a Technical Scan: Establish your technical parameters first, then narrow your results based on fundamental factors.
-
Prioritize Key Metrics: Focus on a few crucial fundamental metrics rather than trying to incorporate too many, which can lead to analysis paralysis.
-
Regularly Review and Adjust: Market conditions and business fundamentals are constantly changing. Review and adjust your scanning criteria regularly to stay relevant and maximize effectiveness.
By incorporating fundamental analysis, you transition from simply reacting to price changes to gaining a deeper understanding of the companies behind the stocks. This empowers you to make more informed decisions, leading to potentially improved outcomes and a more comprehensive scanning process.
Scanning Platforms: Finding Your Perfect Tool Match
Picking the right stock scanning platform is essential for investment success. With so many choices, each offering different features and costs, the search can be overwhelming. This section explores top stock scanners, from free basic tools to premium subscriptions, to help you find the perfect match. Want a quick primer on using these tools effectively? Check out this helpful guide: How to master stock screeners.
Key Considerations When Choosing a Platform
When choosing a scanning platform, several factors deserve careful consideration. Your individual needs and preferences should guide your decision-making process.
-
Data Reliability: Accurate, real-time data is crucial. Prioritize platforms known for sourcing reliable information from reputable providers.
-
Customization Options: Tailoring scans to your specific strategies is key. Look for platforms that offer flexible filters, custom alerts, and adjustable parameters to fit your trading style.
-
User Experience: A clean and intuitive interface is a must. A clunky, complicated platform can hinder your efficiency and make trading more difficult.
-
Value Proposition: Weigh the features against the cost. Free platforms can be surprisingly powerful, while premium subscriptions often offer advanced features and enhanced datasets to justify the higher price.
Comparing Leading Platforms
To help narrow down your choices, the following table compares leading stock scanning platforms, highlighting their strengths, weaknesses, and ideal user profiles.
Let's take a closer look at how some of the top platforms stack up. The following table breaks down key features, limitations, pricing, and ideal user profiles.
| Platform | Best Features | Limitations | Price Range | Ideal For |
|---|---|---|---|---|
| ChartsWatcher | Customizable dashboards, real-time data, multiple screen configurations | Can have a learning curve for new users | Free - Pro Plan | Professional traders, active investors |
| Finviz | Comprehensive screener, visual charts, fundamental data | Limited real-time data on free version | Free - Elite | Investors focused on fundamental analysis |
| TradingView | Advanced charting tools, community features, scripting capabilities | Can be overwhelming for beginners | Free - Premium | Technical traders, chartists |
| StockCharts.com | Robust scanning engine, extensive historical data, educational resources | Can be pricey for full access | Basic - Extra | Experienced traders, long-term investors |
This table offers a concise overview. It's recommended to conduct further research based on your individual trading needs and experience.
Specialized Scanning Tools
Beyond these mainstream platforms, several specialized tools cater to specific markets or strategies. For instance, some platforms excel in options trading, offering detailed data and specialized analysis for options strategies. Others concentrate on specific international markets or sectors, giving you tailored insights for niche investment approaches.
Finding these niche tools can give you a real advantage, especially if you specialize in a particular market segment. Exploring different platforms can uncover hidden gems perfectly suited to your scanning objectives.
Making the Final Decision
The best stock scanning platform aligns with your specific trading style and goals. Consider your experience level, preferred scanning method, and budget. Try out a few platforms before committing. Most offer free trials or basic plans to get a feel for their features. By exploring these options and considering your individual needs, you can find the perfect platform to boost your scanning efforts and improve your trading outcomes.
Creating Custom Scans That Deliver Consistent Results
Building effective stock scans isn't about randomly choosing parameters. It requires a thoughtful blend of proven principles and real-world experience. This section will guide you through developing, testing, and refining custom scans that align with your investment goals and how much risk you're willing to take. We'll explore how seasoned traders confirm their criteria and find that crucial balance between spotting opportunities and avoiding false alarms.
Validating Your Scanning Criteria: The Importance of Historical Testing
A well-designed scan should consistently pinpoint promising stocks without triggering too many false signals. Experienced traders often use historical testing, also known as backtesting, to evaluate the effectiveness of their criteria. This involves applying the scan to past market data to see how it would have performed.
It’s essential to avoid curve-fitting, which is tweaking parameters to perfectly match historical data. A curve-fitted scan might look fantastic in backtests, but it will likely fail in live market conditions. There are numerous scanning platforms available, such as Twitter Analytics Tools, which can be used to analyze their performance.
Also, be wary of recency bias. Don't rely solely on recent market data. Test your scans across various market cycles, including both bull and bear markets, to ensure they hold up regardless of the current trends. This broad historical perspective will give you greater confidence in the scan's long-term viability. For a deeper look at historical testing with stock scanning tools, read the full research here. For instance, ChartMill allows you to run screens on past dates to evaluate historical performance.
Balancing Sensitivity and Specificity: Finding the Sweet Spot
A key challenge in stock scanning is finding the right balance between sensitivity and specificity. Sensitivity refers to a scan's ability to identify potential winning stocks. Specificity, on the other hand, refers to its ability to avoid false signals.
A highly sensitive scan might capture many potential winners, but it will also generate numerous false alarms. Conversely, a highly specific scan might minimize false signals, but it could miss several genuine opportunities. The goal is to find the “sweet spot” – the point where your scan effectively identifies real opportunities while minimizing false positives.
Building a Dynamic Scanning System: Adapting to Changing Markets
Market dynamics are constantly shifting. What worked last year might not work today. That’s why a successful scanning system must be adaptable.
Regularly review your custom scans' performance. Are they still yielding the desired results? Too many false signals? Missed opportunities? Based on this feedback, adjust your parameters as needed. This continuous refinement ensures your system remains effective in evolving market conditions.
Consider using different timeframes in your analysis. A scan using daily data might identify short-term opportunities, while one using weekly or monthly data might reveal longer-term trends. By combining different timeframes, you gain a more complete market view.
Don’t be afraid to explore new indicators or scanning parameters. The field of technical and fundamental analysis is constantly developing, with new techniques emerging regularly. By staying informed and being open to trying new things, you can constantly improve your scanning process and results.
From Scan Results to Actionable Trading Decisions

A successful stock scan is just the beginning. Transforming a list of potential investments into confident trades requires a structured, disciplined approach. This section explores the decision-making processes used by professional traders to efficiently analyze scan results, avoiding impulsive decisions and information overload.
Efficient Analysis of Scan Results: Avoiding Overwhelm
Stock scanners often generate a large number of results. It's easy to feel overwhelmed by the volume of information. A systematic approach is essential for effective analysis.
Start by prioritizing. You don't need to analyze every result. Focus on the stocks that best fit your trading strategy and risk tolerance. For example, if you focus on momentum stocks, concentrate on results highlighting recent price increases and high relative volume.
Next, organize your results. Utilize the sorting and filtering tools in your scanning platform. ChartsWatcher allows you to customize multiple windows and dashboards for effective tracking. You can rank stocks by technical strength, fundamental metrics, or sector performance.
Finally, develop a consistent review process. Create a checklist for evaluating each potential trade. This checklist might include:
- Confirmation of technical setups on multiple timeframes
- Verification of key fundamental data
- Assessment of market conditions and sector trends
This structured approach helps you stay efficient and minimizes emotional decision-making.
Confirming Technical Setups and Fundamental Strength
After narrowing your scan results, the next step is in-depth analysis to confirm the initial signals.
For example, if your scan identified a stock breaking out above resistance, examine the chart. Is the breakout supported by increasing volume? Are there other confirming signals, like bullish candlestick patterns? ChartsWatcher offers customizable dashboards and real-time data for efficient visual chart analysis.
Also, verify the fundamental strength of potential investments. If a stock passes your technical filters, review its financials. Are earnings growing? Is the company financially sound? Integrating fundamental analysis helps avoid costly value traps and confirms the technical picture.
Recognizing False Positives: Avoiding Common Traps
Even the best stock scans can produce false positives: signals that appear promising but don't pan out.
One common trap is the head fake breakout. A stock might briefly move above resistance, then reverse, trapping traders. To avoid this, look for confirmation from volume or momentum indicators.
Another trap is the overbought/oversold indicator fallacy. A high Relative Strength Index (RSI) might suggest a stock is overbought, but this doesn't guarantee a reversal. Always consider broader market conditions and confirming indicators.
Recognizing false positives is a vital skill. Studying past trades and market patterns can help you identify warning signs and avoid pitfalls.
Prioritizing Opportunities Based on Conviction and Market Conditions
Not all opportunities are equal. Prioritize them based on your conviction and the market environment. High-conviction trades, supported by strong technical and fundamental signals, deserve more capital.
Consider even high-conviction trades within the broader market context. In a volatile or bearish market, it might be wise to reduce position size or wait for clearer signals. In a bull market, you might be more aggressive.
Developing a Systematic Trading Process
Moving from scan results to trades requires discipline. Develop a systematic process to guide your decision-making:
- Scanning: Regularly run scans for potential opportunities.
- Filtering: Narrow results based on your criteria.
- Analyzing: Confirm signals with chart analysis and fundamental research.
- Prioritizing: Rank trades based on conviction and market conditions.
- Executing: Enter trades with a defined risk management strategy.
- Reviewing: Regularly review your performance to identify areas for improvement.
Following a structured process enhances your decision-making, maintains objectivity, and improves trading outcomes. Take control of your trading with the tools and features on ChartsWatcher. Sign up today and experience the difference.
