Calculate Stock Correlation: Boost Your Investment Strategy
Demystifying Stock Correlation: The Foundation for Smart Investing

Calculating stock correlation is essential for informed investing. It reveals the relationship between the price movements of different stocks. Understanding this relationship is key to building a diversified portfolio and managing risk.
For instance, if two stocks consistently move in the same direction, they have a positive correlation. If they move in opposite directions, they have a negative correlation.
Understanding Correlation Coefficients
The correlation coefficient, a number ranging from -1.0 to +1.0, quantifies this relationship's strength and direction. A correlation of +1.0 means the two stocks move in perfect unison—a perfect positive correlation. A correlation of -1.0 indicates a perfect negative correlation: when one stock rises, the other falls proportionally. A correlation of zero suggests no linear relationship. Most stocks fall somewhere between these extremes.
Practical Implications of Correlation
How does this affect your investments? Holding two stocks with a perfect positive correlation can amplify losses in a market downturn. Both stocks are likely to decline simultaneously. A portfolio with stocks exhibiting low or negative correlations, however, allows a decline in one to be offset by stability or gains in another. This reduces your overall risk and highlights the importance of diversification.
Global stock index correlations are not static. The S&P 500's correlation with other global markets shifted. It moved from 0.71 between 2015 and 2022 to 0.66 between January 2022 and December 2023. This change reflects a trend of decoupling between global markets, particularly noticeable in indices like the Shanghai Stock Exchange Composite Index (SSE) and the Hang Seng Index (HSI).
Understanding these dynamic relationships helps investors diversify and manage risk during economic uncertainty. The CFA Institute offers further insights on this topic. Discover more insights about decoupling correlations.
Correlation Coefficient Interpretation Guide
The following table, "Correlation Coefficient Interpretation Guide," explains the practical meaning of different correlation values for investors analyzing stock relationships.
| Correlation Value | Interpretation | Investment Implication |
|---|---|---|
| +1.0 | Perfect Positive Correlation | Stocks move in perfect unison; minimal diversification |
| +0.5 to +1.0 | Strong Positive Correlation | Stocks generally move together; limited diversification |
| 0 | No Correlation | Stock movements are independent; good diversification |
| -0.5 to -1.0 | Strong Negative Correlation | Stocks generally move oppositely; significant diversification |
| -1.0 | Perfect Negative Correlation | Stocks move perfectly opposite; maximal diversification |
This table shows how different correlation values translate into practical investment strategies. By understanding these relationships, investors can make better choices about portfolio composition, aligning their choices with their risk tolerance and goals. Ultimately, grasping stock correlation is key to achieving long-term financial success.
Calculate Stock Correlation: Step-by-Step Methods That Actually Work
Calculating stock correlation can feel overwhelming, but it's an essential tool for any investor looking to diversify their portfolio. This section breaks down practical methods, giving you the knowledge to calculate and apply correlation to your own investment strategies.
Using Excel For Correlation Calculation
Microsoft Excel offers a readily available way to calculate stock correlation. This method is great for investors who prefer a hands-on approach and want to work directly with their data.
-
Gather Your Data: Start by downloading historical stock price data (usually closing prices) from a reliable source like Yahoo Finance or Google Finance. Save this data in CSV format.
-
Import Into Excel: Import the CSV files into your spreadsheet. Make sure your data is organized with dates in one column and each stock's closing prices in separate columns.
-
Calculate Daily Returns: Create new columns specifically to calculate the daily returns for each stock. Use the following formula:
(Today's Closing Price - Yesterday's Closing Price) / Yesterday's Closing Price. -
Use the CORREL Function: Excel's
CORRELfunction makes the calculation easy. In an empty cell, type in=CORREL(array1, array2). Replacearray1andarray2with the cell ranges containing the daily returns for the two stocks you are comparing. For instance:=CORREL(C2:C100, D2:D100).
Leveraging Financial Platforms
Many financial platforms have built-in tools for calculating stock correlation, frequently with more advanced features than Excel. These platforms automate the process and provide extra analytical capabilities.
-
Portfolio Visualizer: This free online tool (Portfolio Visualizer) helps you analyze portfolio performance and calculate correlations between various assets.
-
ChartsWatcher: ChartsWatcher is designed for professional traders, offering correlation analysis alongside other advanced features. It allows you to visualize complex correlation relationships, helping you make faster, data-driven investment choices.
-
Bloomberg Terminal: The Bloomberg Terminal is a premium service that offers extensive data and robust analytical tools for professional investors.
Correlation and the Bigger Picture: Risk Assessment, Diversification, and Optimization
The infographic below shows the important role correlation plays in successful portfolio management.
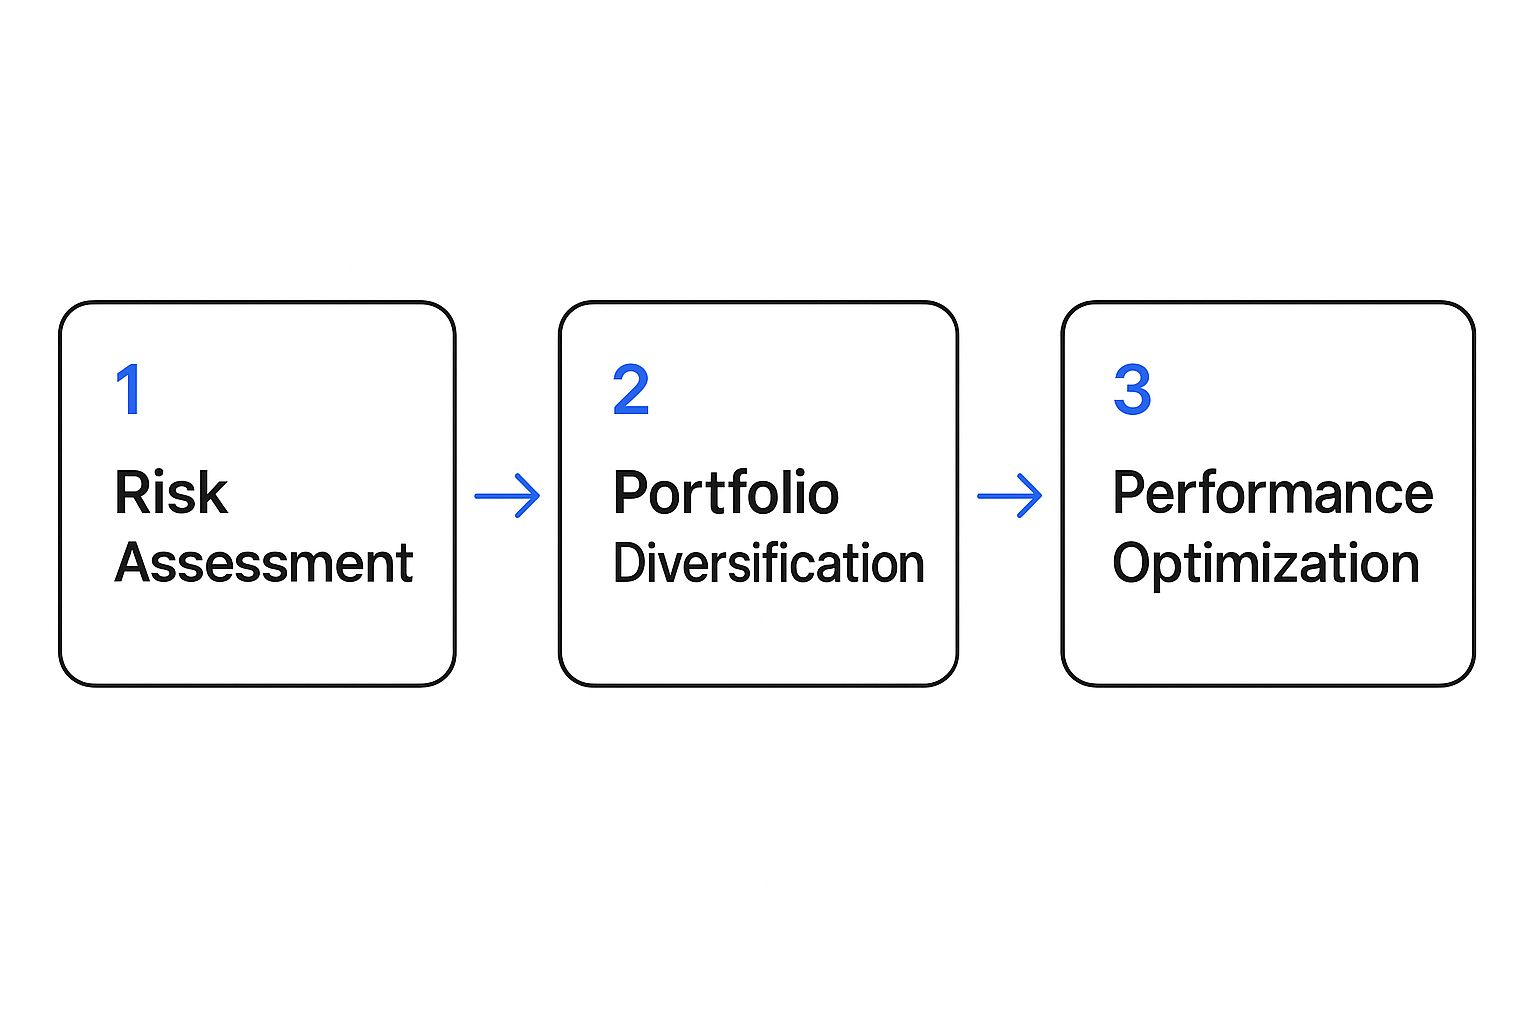
This visual highlights how correlation analysis informs risk assessment, contributes to effective portfolio diversification, and ultimately, leads to optimized performance. By understanding and applying these principles, you can create a strong and adaptable investment strategy.
Choosing the Right Timeframe and Data Adjustments
The timeframe you choose for your correlation analysis significantly impacts the results. Short-term correlations may reflect temporary market changes, whereas longer timeframes provide a more stable view of how stocks relate to each other. Consider analyzing different timeframes to gain a complete understanding.
Also, remember to adjust your data for dividends and stock splits. These events can impact price data and skew correlation calculations. Not accounting for these factors can lead to inaccurate results. Taking this extra step ensures a precise and meaningful analysis.
Interpreting and Applying Correlation
After calculating the correlation coefficient, remember: a value of +1 indicates perfect positive correlation, -1 signals perfect negative correlation, and 0 suggests no correlation.
For instance, a correlation of 0.8 means a strong positive link between two stocks, while -0.3 suggests a weak negative correlation. Use this information to guide how you build your portfolio. Diversify your holdings by choosing stocks with low or negative correlations to reduce risk.
However, don't base your decisions solely on correlation. Consider additional factors such as company fundamentals and current market conditions. By mastering these techniques and understanding their implications, you can use correlation to make informed investment choices and build a portfolio that aligns with your risk tolerance and financial aims.
To further illustrate the different correlation calculation methods, the following table provides a comparison:
Stock Correlation Calculation Methods Compared
| Method | Complexity | Accuracy | Best For | Limitations |
|---|---|---|---|---|
| Manual Calculation (e.g., using formulas in a spreadsheet) | High | High (if done correctly) | Individuals comfortable with mathematical formulas; academic research | Time-consuming; prone to human error; requires detailed data |
Excel CORREL Function | Medium | High | Most investors; quick analysis | Requires some familiarity with Excel; limited visualization options |
| Financial Platforms (e.g., Portfolio Visualizer, ChartsWatcher) | Low to Medium | High | Investors seeking automated calculations and additional analytical tools; professionals | Requires platform access (some may be subscription-based) |
| Specialized Statistical Software (e.g., R, Python) | High | Very High | Advanced users; researchers; complex modeling | Requires programming skills; steeper learning curve |
This table compares different approaches to calculating stock correlation, from manual formulas to specialized software. Each method offers a unique balance of complexity, accuracy, and suitability depending on the investor's needs and technical skills. While manual calculations and Excel can be suitable for individuals, financial platforms and statistical software offer more robust tools for professionals and those needing advanced analysis.
Building a Correlation-Powered Portfolio That Outperforms

Now that we have a grasp on calculating stock correlation, let's explore how to use this knowledge to build a stronger portfolio. Professional asset managers go beyond simply calculating correlation. They use it strategically to create portfolios designed to beat the market, especially when things get volatile. This involves more than picking stocks with low correlations; it requires a well-defined approach.
Identifying Truly Uncorrelated Assets
A key aspect of portfolio construction is finding truly uncorrelated assets. Many investors believe they're diversified just by investing in different sectors. However, market crashes often lead to a surprising increase in correlations, making these seemingly diversified portfolios vulnerable. True diversification means finding assets that remain independent even during market turmoil.
This often means looking beyond the usual stocks and bonds. Consider alternative investments like real estate, commodities, or precious metals. Finding these uncorrelated assets is vital for weathering market storms.
The correlation between different asset classes is a critical factor in financial analysis. A correlation of 1.00 represents perfect correlation, while -1.00 indicates perfect negative correlation. For a deeper dive into these statistics, check out Guggenheim Investments. This understanding is essential for building diversified portfolios.
Visualizing Correlation and Setting Thresholds
Visualizing the complex relationships between correlations is crucial for effective portfolio management. Tools like correlation matrices and heatmaps can help. Platforms like ChartsWatcher offer these tools, allowing investors to see these relationships clearly.
Setting appropriate correlation thresholds is equally important. This means defining the highest acceptable correlation between assets in your portfolio. This threshold should reflect your personal risk tolerance. A more conservative investor might set a lower threshold, while a more aggressive investor may accept higher correlations.
Rebalancing Based on Shifting Correlations
Building a well-diversified portfolio isn't a one-time task. Remember, correlations are dynamic and can change over time due to various market forces. Therefore, a regular rebalancing strategy is essential.
This involves periodically recalculating correlations and adjusting your portfolio accordingly. This helps maintain your target diversification level. For more insights on stock market analysis tools, see Top Stock Market Analysis Tools For Pro Traders. By actively managing shifting correlations, you can minimize potential losses and ensure your portfolio remains aligned with your risk profile.
Case Studies: Correlation in Action
Examining real-world examples of correlation-optimized portfolios in both rising and falling markets provides invaluable lessons. These case studies highlight how even small adjustments to your correlation strategy can significantly reduce losses without compromising potential gains.
For instance, a portfolio heavily invested in technology stocks might benefit from adding negatively correlated assets like gold during periods of tech sector instability. This can help protect the portfolio from large drawdowns.
Essential Tools To Calculate Stock Correlation Like A Pro
Calculating stock correlation is crucial for informed investment decisions. Manually crunching the numbers can be a real headache, though. Luckily, several tools exist to streamline the process. This section explores both free and paid options, highlighting their advantages and how they empower you to analyze stock correlations effectively.
Free and Accessible Tools: Simplifying Correlation Analysis
Even on a tight budget, you can access robust tools for calculating stock correlation. These platforms often offer surprisingly powerful features that rival paid alternatives.
-
Portfolio Visualizer: This free platform calculates correlations between various assets, including stocks. Its user-friendly design and visualization options make it ideal for investors seeking a quick and easy way to understand correlations.
-
Yahoo Finance: Beyond stock quotes and financial news, Yahoo Finance provides basic correlation data. While not as in-depth as specialized platforms, it’s readily accessible and valuable for preliminary analysis.
For further reading on investment strategies, check out this article on How to master using a stock screener for smart investing.
Professional Platforms: Investing in Advanced Capabilities
For professional traders and serious investors, premium platforms offer advanced features that justify the cost of their subscriptions.
-
Bloomberg Terminal: This industry-standard platform provides comprehensive data and analysis, including complex correlation calculations. It's a powerful resource for professional investors needing extensive data and sophisticated analytical features.
-
ChartsWatcher: Strategic partnerships are a key element of portfolio diversification. Learn more about building effective partnerships in this guide on Successful Business Partnerships. Our own platform, ChartsWatcher, offers robust real-time correlation analysis along with other valuable features like customizable charts and alerts, giving professional traders a significant advantage. These tools help identify market opportunities and risks swiftly.
Programming For Correlation: Custom Insights With Python and R
For those proficient in programming, Python and R offer unmatched customization. These languages provide access to statistical libraries enabling advanced correlation calculations and the creation of tailored visualization tools.
-
Python: Python allows investors to create highly specific strategies based on unique correlation insights. For example, calculating rolling correlations allows you to observe how stock relationships change over time, providing a dynamic view of market fluctuations.
-
R: R provides similar advantages, giving investors a high degree of control and depth in their analysis. This level of detail is crucial for those looking to take their correlation analysis further. Both Python and R offer exceptional flexibility for tailoring analysis to specific investment goals.
Global Correlation Patterns: Finding Opportunities Others Miss

While many investors concentrate on their local markets, the most successful investors have a global perspective. Understanding global correlation patterns is crucial for discovering hidden opportunities and constructing a resilient investment portfolio. By examining the relationships between major global indices like the S&P 500, FTSE 100, and Nikkei 225, we can uncover diversification opportunities that many overlook.
Uncovering Hidden Diversification Opportunities
Global markets don't always move together. Geopolitical events, shifting currency values, and different economic policies can significantly alter correlations. For instance, the S&P 500 and FTSE 100 might have a strong positive correlation, generally rising and falling in tandem. However, the Nikkei 225 might behave differently, potentially acting as a hedge during market downturns. This is where calculating stock correlation becomes vital.
To calculate stock correlation accurately, investors require reliable data analysis tools. Check out some helpful resources for investment research tools. These resources can provide valuable insights into market trends and help you make informed investment decisions.
These diverse relationships are often driven by distinct regional factors. The S&P 500 and the FTSE 100 have historically exhibited a stronger correlation compared to the Nikkei 225, particularly during financial crises. This was apparent in events such as the 1987 U.S. stock market crash and the September 11th attacks. In contrast, the Nikkei 225 has, at times, displayed more independent movement. Understanding these correlations aids investors in managing risk. You can explore this topic further to enhance your understanding of global market dynamics.
Emerging Markets: A Unique Correlation Advantage
Emerging markets frequently demonstrate lower correlations with developed economies. This presents compelling diversification opportunities. Integrating emerging market assets into a portfolio can potentially reduce overall volatility and boost returns.
However, investing in emerging markets requires careful thought. Currency risk and political instability can add complications. A balanced approach is therefore essential.
Practical Approaches to Global Correlation Investing
How can you integrate global correlation insights into your own investment strategy? Begin by analyzing historical correlation data for various global indices. Identify those with historically low or negative correlations to your current holdings.
-
Diversify Across Regions: Expand your investment horizons beyond your home market and explore opportunities in different parts of the world.
-
Currency Hedging: Consider strategies to hedge currency risk to minimize potential losses from unfavorable exchange rate fluctuations.
-
Regular Monitoring: Global correlations are not static. Continuously monitor and adapt your portfolio as needed to maintain effective diversification.
By understanding and using global correlation patterns, you can construct a portfolio that is not only diversified but also poised to capture unique opportunities. This approach enables you to navigate market volatility more effectively and achieve your financial goals.
Advanced Correlation Techniques That Transform Your Results
Moving beyond simple correlation calculations opens a world of deeper analysis, much like the techniques used by institutional investors. These methods offer a more nuanced understanding of market dynamics, leading to better-informed investment decisions. Let's explore some of these powerful techniques and how they can be applied to individual portfolios.
Rolling Correlations: Unveiling Dynamic Relationships
Standard correlation calculations offer a static view of how two assets relate. However, these relationships are anything but fixed. Rolling correlations provide a dynamic perspective by calculating correlation over a specific time window, such as 30 days. As this window moves forward, the correlation is recalculated, revealing how the relationship shifts. This helps anticipate potential changes instead of simply reacting to them.
Conditional Correlations: Understanding Market-Specific Relationships
Sometimes, correlations only surface under certain market conditions. Two stocks might show a strong positive correlation during high volatility but little connection during calmer periods. Conditional correlation analysis helps uncover these hidden relationships. By examining correlations under different market regimes—like bull markets, bear markets, or periods of high inflation—you gain a deeper understanding of how asset relationships change based on the prevailing market environment. This allows for more flexible and resilient investment strategies.
Factor-Based Models: Uncovering Hidden Drivers
Observed correlations between stocks may be due to underlying factors rather than a direct link. Two seemingly unrelated companies could both be heavily influenced by interest rate changes, for example. Factor-based models help untangle these complex relationships by identifying the underlying factors driving asset prices. This offers valuable insight into the true drivers of correlations, leading to a more informed approach to diversification and risk management.
Applications for Advanced Correlation Analysis
These advanced techniques have practical uses for portfolio management and reducing risk:
-
Correlation-Based Hedging: Identifying negatively correlated assets helps create hedging strategies to reduce portfolio volatility. Holding gold as a hedge against a stock market decline is a common example, taking advantage of the negative correlation often seen between these asset classes.
-
Stress Testing: Conditional correlations allow you to stress-test your portfolio against different market scenarios. This helps understand how your investments might perform during a crisis, allowing you to make preemptive adjustments to mitigate potential losses.
-
Early Detection of Correlation Shifts: Rolling correlations can signal emerging changes in asset relationships. This early warning provides a valuable edge, letting you adjust your strategy before these changes become widely known.
By incorporating these advanced correlation techniques, you move beyond basic diversification and gain a professional approach to managing your investments. These techniques provide a more sophisticated view of market dynamics, enabling you to anticipate changes, manage risk more effectively, and optimize your portfolio for long-term success.
Ready to take your investment analysis to the next level? ChartsWatcher provides the tools you need to easily calculate and visualize correlations, from basic calculations to advanced rolling and conditional correlations. Explore the power of ChartsWatcher today!
