Best Charting Software for Traders Revealed
Think of charting software for traders as a pilot's cockpit—it's your command center for navigating the often-turbulent financial markets. This software takes raw, overwhelming market data and turns it into a clear visual story, helping you spot trends, identify patterns, and ultimately make calculated decisions.
For any serious modern trader, high-quality charting tools are simply non-negotiable. They are the foundation of a competitive edge.
Why Quality Charting Software Is Your Trading Co-Pilot
Trying to trade without a robust charting platform is like navigating a dense forest without a map. You might get lucky for a bit, but the odds are overwhelmingly stacked against you. The markets spit out an incredible amount of data every second, and charts are the universal language that translates this chaos into something you can actually use.
This guide isn't just about definitions. It's about showing you why the right tools are so critical. Instead of basing trades on gut feelings or market noise, traders use software to build a systematic, data-driven strategy. It allows you to see price movements, gauge market momentum, and pinpoint potential entry and exit points with much greater precision.
The Foundation of Strategic Trading
At its core, trading is a game of probability. A well-designed charting platform is your key to stacking those probabilities in your favor. It's not a crystal ball that predicts the future, but it is a powerful analytical engine.
To get a better sense of what these tools actually do, let's break down their main roles.
Core Functions of Modern Charting Software
| Core Function | Primary Benefit for Traders |
|---|---|
| Data Visualization | Converts streams of price and volume data into intuitive formats like candlestick or bar charts. |
| Pattern Recognition | Helps you spot classic technical patterns such as head and shoulders, triangles, and flags. |
| Indicator Application | Lets you overlay mathematical tools like Moving Averages or the RSI to gauge market health. |
| Risk Management | Allows you to set precise stop-loss and take-profit levels based on support and resistance zones. |
This methodical process is what separates disciplined traders from gamblers. The software provides the framework for building a strategy, testing it, and executing it with consistency time and time again.
A Rapidly Growing Market
The importance of these tools is clear when you look at the market's explosive growth. The stock market software industry, which includes charting tools, was valued at USD 3.47 billion in 2021. It's projected to surge to an incredible USD 11.21 billion by 2031.
This boom is fueled by advancements in AI and machine learning, which are making automated pattern recognition and predictive analytics more powerful than ever. If you're interested in the details, you can read the full research about these market projections to understand where the industry is heading.
In essence, charting software is your window into the market's psychology. It reveals the collective behavior of buyers and sellers, providing clues that are completely invisible in a simple price quote. Mastering these tools is the first real step toward becoming a more strategic and confident trader.
Decoding Your Charting Software's Must-Have Features
What separates a basic charting tool from a professional-grade platform? It comes down to a core set of non-negotiable features that give traders the power to analyze, strategize, and execute with precision. Without them, you’re basically flying blind.
Think of it like building a house. You wouldn’t start without a solid foundation, steel beams, and proper electrical wiring. In the same way, your charting software needs a robust framework of essential components to support any successful trading strategy. Let's break down these must-haves.
Real-Time Data Feeds
In active trading, a delay of even a few seconds can be the difference between profit and loss. That’s why real-time data is the absolute bedrock of any serious charting platform. Delayed data, often found in free tools, is like reading yesterday’s newspaper to make today’s decisions—it’s already history.
For day traders and scalpers, instantaneous price updates are mission-critical for getting your entries and exits right. It ensures the price you see on your chart is the price available in the market right now, taking the guesswork out of the equation and reducing slippage.
A study on high-frequency trading revealed that even millisecond advantages in data speed can significantly impact profitability. While you don't need a supercomputer, access to clean, real-time data is the great equalizer for retail traders.
Comprehensive Technical Indicator Library
Technical indicators are the mathematical tools we use to interpret price action, momentum, volatility, and trend strength. A basic platform might give you a simple moving average, but a professional one provides a deep library of indicators to work with.
Your software should include a versatile mix of the most widely used tools, allowing you to build a complete analytical picture.
- Trend Indicators: Tools like Moving Averages (Simple, Exponential) and the Parabolic SAR help you identify and ride the market's primary direction.
- Momentum Indicators: The Relative Strength Index (RSI) and the MACD (Moving Average Convergence Divergence) gauge the speed and strength of price moves, helping you spot overbought or oversold conditions.
- Volatility Indicators: Bollinger Bands and Average True Range (ATR) measure the degree of price fluctuation, which is absolutely essential for setting stop-losses and profit targets.
Having a wide array of these tools at your fingertips allows you to layer different types of analysis, confirm your signals, and build a more resilient strategy.
Advanced Drawing Tools
If charts are the map of the market, then drawing tools are your pens and highlighters. They let you manually mark up charts to identify patterns, map out support and resistance levels, and visualize where price might go next.
This is where you move from passively observing the market to actively engaging with it. A quality platform should offer a suite of precise drawing tools.
- Trendlines: The most fundamental tool there is, used for connecting price points to visualize uptrends and downtrends.
- Fibonacci Retracements: A classic tool used to identify potential support and resistance levels based on key mathematical ratios.
- Channels: These parallel lines help define a price range and are incredibly useful for identifying breakouts or trading within a trend.
- Pattern Tools: Specific tools for drawing formations like Head and Shoulders or Triangles, making pattern recognition easier.
The ability to draw with precision transforms a chart from a simple price graph into a strategic blueprint for your trades.
Customization and Personalization
Every trader is different. We all have our own strategies, preferred assets, and visual quirks. A one-size-fits-all interface just creates friction and slows down your workflow. This is why customization is not a luxury; it’s a necessity.
A powerful charting software should let you tailor the entire environment to your exact needs. This means creating personalized chart layouts with your own color schemes, setting up multiple synchronized chart windows, and building custom watchlists. To learn more about optimizing your workspace, check out our guide on how to customize stock charts for smarter trading strategies.
Backtesting Capabilities
Finally, one of the most powerful features any charting software for traders can offer is a backtesting engine. Backtesting lets you test a trading strategy against historical price data to see how it would have performed in the past.
This is your virtual practice field. It allows you to validate your ideas, refine your entry and exit rules, and gain statistical confidence in your strategy—all without risking a single dollar of real capital. It’s an essential step in moving from a theoretical idea to a battle-tested trading plan.
Comparing The Top Charting Software Platforms
Picking the right charting software for traders is a lot like choosing a co-pilot for your trading journey. You need one you can trust, one that speaks your language, and one that has the right tools for the mission ahead. The market is packed with solid options, but the best one for you hinges entirely on your personal trading style, the assets you focus on, and what you simply can't trade without.
A scalper glued to one-minute charts has a completely different set of needs than a long-term investor mapping out trends over months or years.
This choice is becoming more critical as more traders rely on digital tools for an edge. The global trading software market was valued at around USD 6.5 billion in 2024 and is expected to nearly double to USD 12.1 billion by 2033. That explosive growth shows just how essential these platforms have become.
So, let's put a few of the heavy hitters side-by-side to see how they really stack up.
Feature Comparison of Leading Charting Platforms
To make sense of the options, it helps to see them compared on the metrics that matter most. The table below breaks down a few popular platforms, highlighting their core strengths and who they're built for.
| Software | Key Features | Best For | Pricing Model |
|---|---|---|---|
| TradingView | Unmatched charting tools, massive social network, Pine Script for custom indicators, global market data. | All traders, especially those who value community and endless customization. | Freemium with tiered paid plans. |
| MetaTrader 4/5 | Legendary for forex, robust Expert Advisor (EA) support for automation, fast execution, huge broker support. | Forex traders and algorithmic traders who rely on automated strategies. | Free through most brokers. |
| ChartsWatcher | Modern UI, automatic chart pattern recognition, integrated scanners and alerts, intuitive workflow. | Swing traders and technical analysts who prioritize clean design and efficiency. | Subscription-based. |
| TC2000 | Powerful desktop software, integrated scanning (EasyScan), excellent charting, direct brokerage option. | Active traders and technical investors looking for an all-in-one platform. | Tiered subscription with data fees. |
This comparison shows there’s no single "best" platform—only the one that’s best for your strategy. A tool that feels clunky to one trader might be the key to unlocking consistent profits for another.
TradingView: The Community-Driven Powerhouse
TradingView has become the default platform for millions, and for good reason. It perfectly blends professional-grade charting with a vibrant social network where traders share ideas, scripts, and analysis. It’s like a high-performance analytics engine bolted onto a financial Twitter.
Its biggest draw is this combination of community and versatility. You get access to a practically infinite library of community-built indicators and can bounce ideas off millions of other traders. This makes it an incredible resource for new traders learning the ropes and seasoned pros looking to fine-tune their edge.
- Best For: Just about everyone. Beginners, experts, and anyone in between who loves community insights and a massive toolbox.
- Key Strength: Nothing beats its social features and the Pine Script editor, which lets you build almost any custom tool you can imagine.
MetaTrader 4/5: The Forex and Automation King
In the world of forex, MetaTrader 4 (MT4) and its newer sibling, MetaTrader 5 (MT5), are legends. For decades, they’ve been the undisputed champions for currency traders and anyone serious about automated trading using Expert Advisors (EAs).
Sure, the interface might look a little dated next to slicker, web-based platforms, but its performance is absolutely rock-solid. MT4/5 is all about execution speed and reliability, backed by a massive ecosystem of brokers and developers. If your strategy involves algorithms in the forex or CFD markets, you can't really avoid MetaTrader.
MetaTrader's lasting power comes from its MQL programming language. It has empowered a whole generation of traders to build, test, and run automated strategies with incredible precision.
ChartsWatcher: The Modern, Intuitive Alternative
For traders who are tired of cluttered interfaces and want powerful, built-in pattern recognition, ChartsWatcher is a compelling choice. It was designed from the ground up to be intuitive, helping you cut through the market noise to spot real opportunities without the headache.
The infographic below gives a visual sense of how different platforms balance core features, a key consideration for any trader.
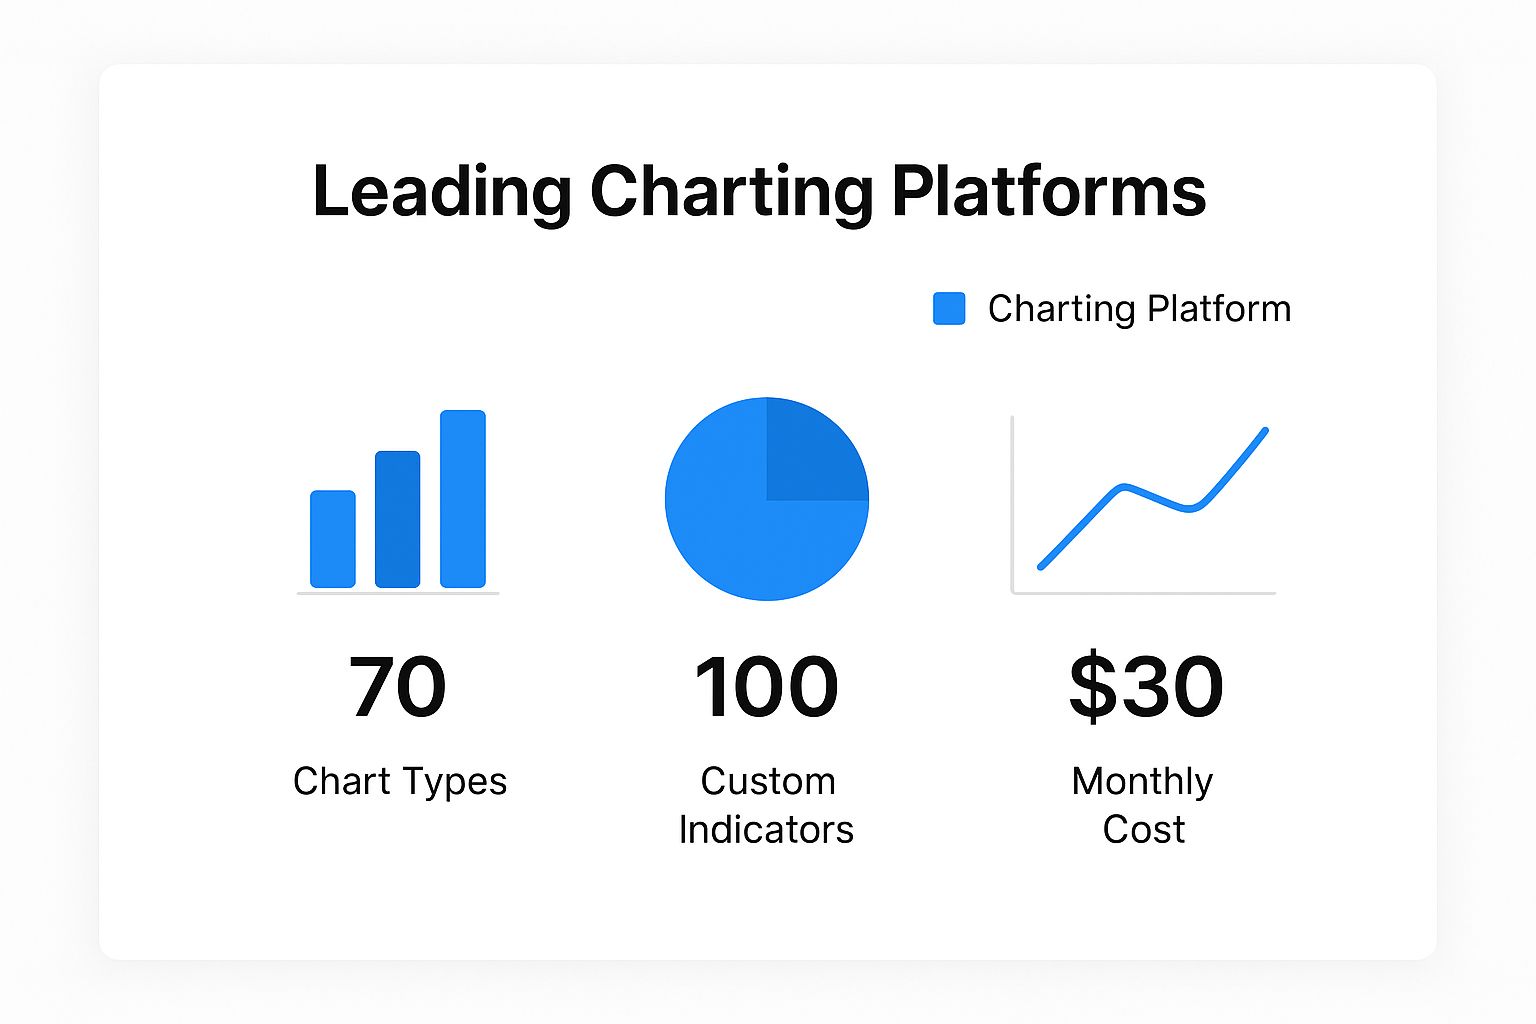
This kind of visualization helps frame the trade-offs between feature depth, ease of use, and cost.
ChartsWatcher really shines for swing traders and technical analysts who live by classic chart patterns. Its built-in scanners and alerts are designed to do the heavy lifting for you, bringing high-probability setups to your attention. It makes complex analysis feel surprisingly simple. To see how it fits into the broader landscape, check out our guide on the https://chartswatcher.com/pages/blog/top-10-best-stock-charting-software-for-2024.
And remember, while a great charting platform is your command center, a complete strategy often includes other powerful best stock research tools to round out your analysis.
Matching a Platform to Your Trading Style
At the end of the day, the right software is the one that feels like an extension of your own strategy. No platform is the best at everything, but there is a perfect fit for you.
Think about which of these traders you are:
- The Scalper: You need instant data, one-click trading, and Level 2 depth. Your world revolves around speed, so platforms with tight broker integration are non-negotiable.
- The Swing Trader: You're hunting for patterns over days or weeks. Top-notch drawing tools, automated pattern recognition, and smart alerts are your best friends, making a tool like ChartsWatcher a natural fit.
- The Algorithmic Trader: You speak in code. A platform with a robust scripting language and a serious backtesting engine, like MetaTrader or TradingView, is your playground.
- The Long-Term Investor: You're focused on the big picture. All you really need are clean weekly and monthly charts with basic trendline tools to map out major trends.
When you look at these platforms through the lens of your own trading needs, the right choice becomes much clearer. Pick the tool that empowers your strategy, not one that forces you to change it.
How to Choose the Right Charting Software for You
Picking the right charting software for traders is a deeply personal decision. Think of it less like buying a product and more like hiring a critical business partner. The perfect platform for one trader could be a frustrating mess for another, so the choice has to align with your specific needs and style.
The whole process starts with a quick self-assessment. Before you even glance at features or pricing, you need a crystal-clear picture of your own trading identity. Are you a high-frequency day trader who lives on one-minute charts, or a long-term investor analyzing weekly trends? The answer completely changes what you should be looking for.
Define Your Trading Profile
Your trading style is the single most important filter you can apply. A platform built for speed and scalping will feel clunky and slow to a swing trader who needs powerful pattern recognition tools. To find the right fit, you need to answer a few foundational questions.
- What’s your primary trading style? Are you a scalper, day trader, swing trader, or position trader? Each approach demands a completely different set of tools and data speeds.
- Which markets do you trade? Some platforms are kings of the stock market, while others are built from the ground up for forex or crypto. Make sure your chosen software offers rock-solid data for your preferred markets.
- What’s your technical skill level? If you're just starting out, you should prioritize intuitive interfaces and helpful educational resources. On the other hand, advanced traders might be hunting for scripting languages and deep customization options.
- What's your budget? Figure out what you’re willing to invest each month. High-end platforms can get expensive, but there are plenty of excellent options that offer incredible value for a reasonable price.
Answering these questions honestly gives you a clear blueprint for your ideal software. It lets you cut through all the marketing noise and focus only on the platforms that genuinely fit your workflow, saving you from overpaying for features you’ll never touch.
Evaluate Key Functional Areas
Once you know what you need, you can start sizing up the contenders. Don’t get distracted by a long list of flashy features. Instead, zero in on the core functions that will actually impact your day-to-day trading.
The right software shouldn't just throw data at you; it should actively support your decision-making. The goal is to find a tool that feels like a natural extension of your strategy, something that reduces friction and brings clarity to the chaos.
Focus your evaluation on these critical pillars:
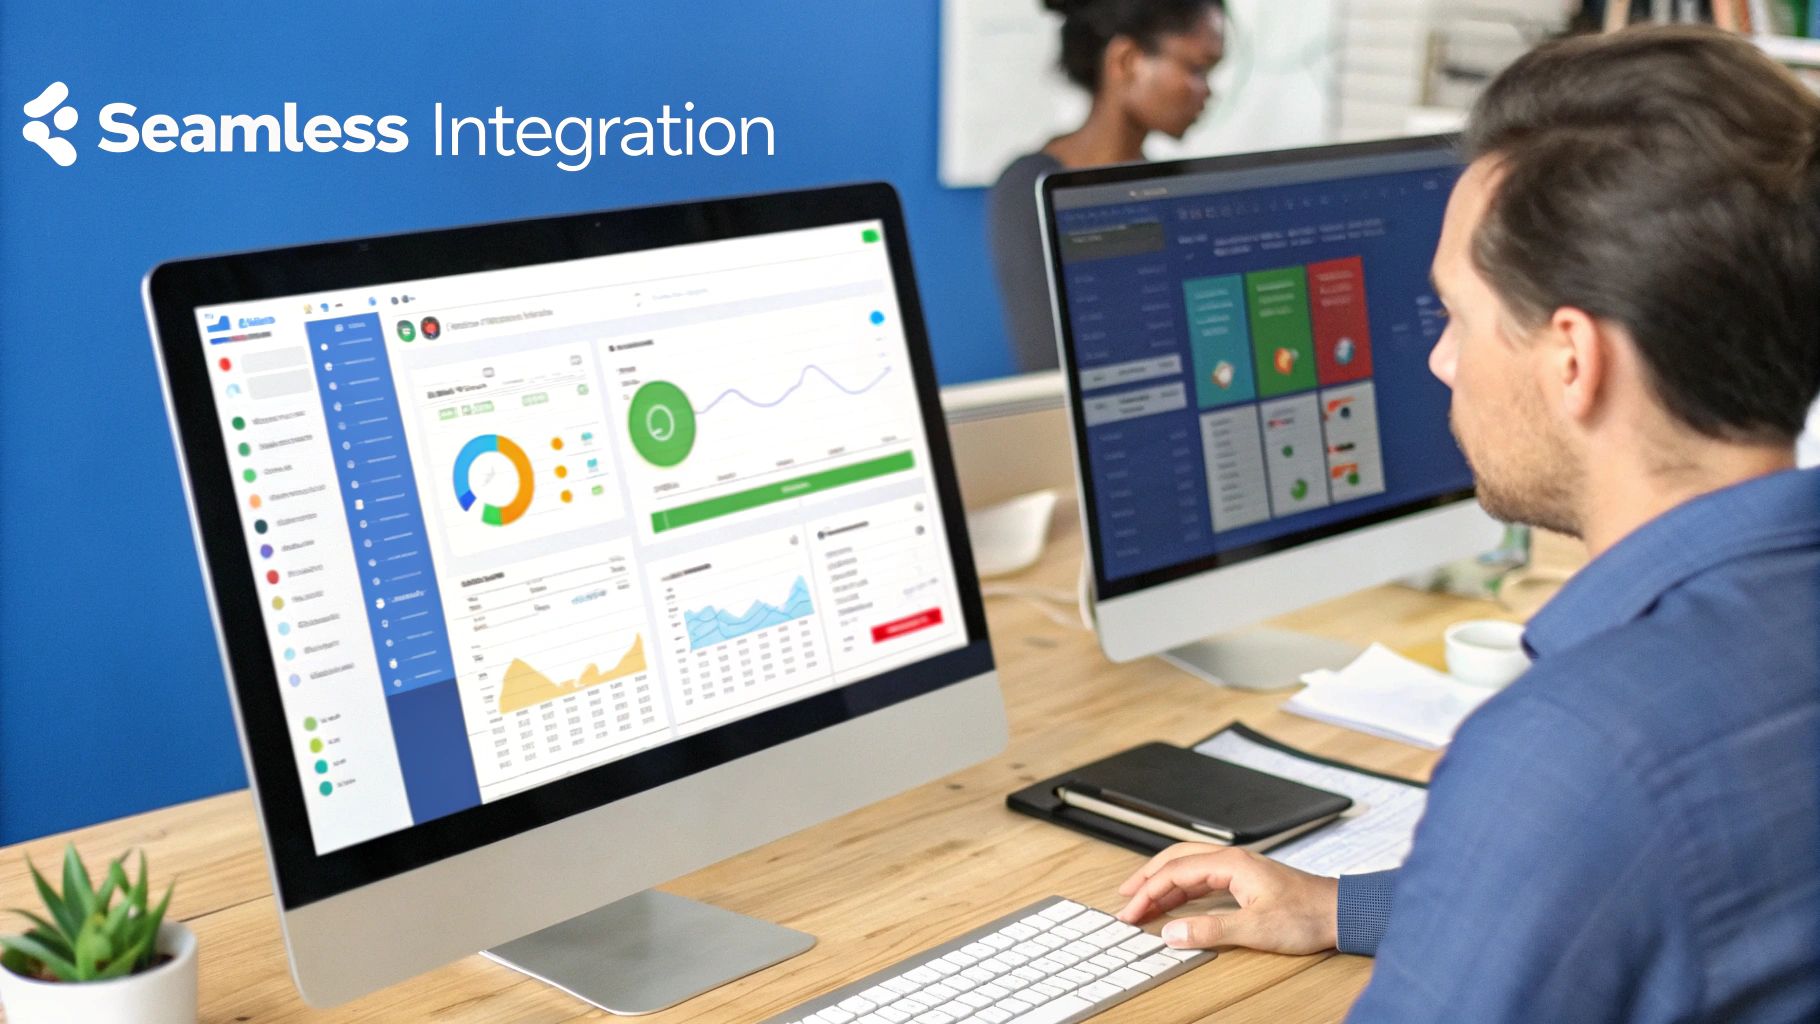
- Broker Integration: Does the software connect seamlessly with your broker? Direct integration lets you trade straight from the charts, which is a massive time-saver and a huge advantage for active traders looking to shave off execution delays.
- Data Quality and Speed: For any kind of short-term trading, real-time data is non-negotiable. When you’re on a free trial, pay close attention to whether the charts lag or freeze during volatile market hours. Clean, fast data is the bedrock of any sound analysis.
- User Interface (UI) and Experience (UX): A cluttered or confusing interface is more than just an annoyance—it creates mental fatigue and can lead to costly mistakes. The best platforms, like ChartsWatcher, prioritize clean design and an intuitive workflow, making it easier to spot opportunities without getting lost in endless menus.
- Community and Support: What are other traders saying? Look for genuine user reviews on independent forums and social media. And don't forget to test out the customer support during your trial. See how quickly they respond and how helpful they actually are.
This systematic approach makes sure you're not just picking software based on a single feature but are choosing a complete solution that supports your entire trading process. The market for these tools is booming—the stock analysis software market was valued at nearly USD 948 million in 2021 and is projected to hit USD 1.52 billion by 2025. You can discover more insights about this market expansion to see just how essential these platforms have become. By making an informed choice now, you’re equipping yourself with a powerful ally for navigating the markets.
Integrating Charting Tools into Your Daily Trading Routine
Getting your hands on powerful charting software for traders is one thing. Actually using it to its full potential is another game entirely. The real edge comes when you weave it into the fabric of your daily workflow, turning it from a fancy tool into the command center for your entire trading operation.
Without a structured routine, even the most sophisticated platform is just a collection of buttons and features you'll barely touch.
The goal is to build a repeatable, disciplined process. This framework is what helps you approach the market with a plan, react with logic instead of emotion, and constantly sharpen your strategy. By making the software a core part of your pre-market analysis, real-time monitoring, and post-market review, you start to unlock its true power.
Building Your Personalized Dashboard
Your trading day shouldn't start with a blank, generic chart. It should start at your personalized command center. The first step is to set up a dashboard that brings the most critical information front and center, cutting out the noise and getting you straight to what matters.
A well-designed dashboard is your filter for the market.
Start by creating custom watchlists. Ditch the habit of tracking dozens of random stocks and build targeted lists based on your specific criteria.
- Primary Watchlist: This is your hot list—the handful of assets you're actively trading or eyeing for an immediate entry.
- Sector Watchlist: Group stocks by industry. This lets you see at a glance if a whole sector is catching a bid or taking a hit.
- "In-Play" Watchlist: Keep a dynamic list for stocks making big moves on news, earnings, or unusual volume spikes.
Next, get smart with your alerts. Instead of gluing your eyes to the screen waiting for a price to hit your level, automate it. Set alerts for key support and resistance breaks, moving average crossovers, or specific indicator readings like an RSI dipping into oversold territory.
This simple step frees up your mental bandwidth to focus on analysis, not just mindless observation. To take this even further, you can look into strategies for automating data extraction that can feed critical info right into your setup.
A Trader's Daily Routine Framework
With your dashboard ready, you can now build a structured routine around it. The best way to think about your trading day is in three distinct phases, each with a clear purpose powered by your charting software. A systematic approach breeds consistency, and consistency is the cornerstone of long-term trading success.
A disciplined routine turns trading from a series of reactive gambles into a professional, process-driven business. Your software is the machinery that makes this process efficient and repeatable.
Let’s walk through what this looks like in practice.
1. Pre-Market Preparation (Before the Bell)
This is your planning and strategy session. Before the chaos of the opening bell, your software is crucial for sniffing out the day's best potential opportunities.
- Scan for Gappers: Use your pre-market scanners to find stocks gapping up or down on heavy volume. This is often where the early action is.
- Review Key Levels: Pull up the charts for your primary watchlist and mark the major support and resistance levels. Know your battlefield before the fight begins.
- Check Economic Calendars: Make a note of any major economic data releases scheduled for the day that could rock the market.
2. Real-Time Monitoring and Execution (During Market Hours)
Once the market opens, your job shifts from planning to execution. Your dashboard and alerts now do the heavy lifting, flagging opportunities as they arise.
- Monitor Your Alerts: Don't chase stocks. Let the software tell you when an asset has hit a price or condition you defined ahead of time.
- Analyze Price Action: When an alert goes off, that's your cue to zoom in. Use your charting tools to analyze the real-time price action and volume to confirm your trade idea. Is the move legitimate?
- Execute with Precision: Place your trades based on the plan you made, not on an emotional gut reaction to the market's noise.
3. Post-Market Review (After the Close)
The day isn’t over when the market closes. This is your time to learn, reflect, and get a head start on tomorrow. Treat it like a post-game film session.
- Journal Your Trades: Log every single trade. Use your charting software to screenshot your setups, annotating your entry, exit, and the "why" behind your decision.
- Review Performance: Go through your winners and losers. Did you stick to your plan? Where did you deviate? What could you have done better? This is where real growth happens.
- Prepare for Tomorrow: Clean up your charts, update your watchlists, and start identifying potential setups for the next session.
This three-phase routine, all powered by your charting software, creates a powerful feedback loop. It builds discipline, forces continuous improvement, and ultimately transforms your trading from a hobby into a structured, professional business.
Taking Your Analysis to the Next Level with Advanced Techniques
Getting the basics down is one thing, but the real magic happens when you start layering in more advanced charting techniques. This is where you graduate from simply looking at prices to truly interpreting what the market is doing on a much deeper level.
One of the most powerful methods is multi-timeframe analysis. Think of it like a satellite camera. A single daily chart gives you the big picture—the 10,000-foot view of the overall trend. But zooming into an hourly or 15-minute chart shows you the action on the ground, the short-term skirmishes happening within that larger war.
When you look at a stock on multiple timeframes at once, you get critical context. A powerful uptrend on the daily chart might be showing a small dip on the hourly chart. That dip, which would be invisible if you were only looking at the daily, could be the exact entry point you were waiting for. This layered approach helps you make sure your trades are swimming with the current, not against it.
Unlocking Deeper Insights
Beyond just looking at different timeframes, serious traders often turn to custom scripts and backtesting to really sharpen their edge. These tools transform your charting platform from a passive window into an active research partner.
- Custom Scripting: Many platforms let you code your own indicators or automated signals. This is huge. It means you can build tools that are perfectly suited to your specific strategy, moving beyond the off-the-shelf options to test new ideas and develop a truly unique approach.
- Robust Backtesting: This is just the scientific method applied to trading. It’s the process of taking your strategy and running it against years of historical data to see how it would have performed. It gives you the hard data on whether your strategy actually has a positive expectancy over time.
Backtesting isn't about chasing a "perfect" system that never loses. It's about understanding your strategy's personality—its strengths, its weaknesses, and its quirks. It tells you what to realistically expect, from drawdowns to win rates, before you put real money on the line.
From Casual User to Power User
This is what separates the casual chart-watcher from the serious analyst. It’s the difference between reacting to what the market just did and anticipating its next move with a data-driven game plan.
Custom scripts can automate the grunt work, freeing you up to focus on the bigger picture. Meanwhile, rigorous backtesting gives you the confidence to stick to your plan when the pressure is on.
Ultimately, these methods give you a serious analytical advantage. They let you build and scientifically prove a trading process that is systematic, repeatable, and entirely your own—the kind of foundation that long-term success is built on.
Got Questions About Charting Software? We've Got Answers.
Jumping into the world of charting software for traders can feel like learning a new language. A lot of questions pop up. Let's tackle some of the most common ones we hear.
What's the Difference Between Charting Software and a Brokerage Platform?
It helps to think of it this way: your brokerage platform is the car you use to place a trade. The charting software is the advanced GPS and diagnostics system telling you where to go and when to hit the gas.
While most brokers offer some basic charts, dedicated software is a completely different beast. It's packed with far more powerful analytical tools, indicators, and ways to customize your view of the market. A dedicated charting platform is built for one thing: deep, focused analysis. Your broker’s main job, on the other hand, is executing trades. Combining the two gives you a professional-grade setup.
The real distinction is focus. Charting software is obsessed with analysis and strategy. A brokerage platform is built for transaction speed and account management. The best traders use specialized tools for each job.
Can I Get By with Free Charting Software?
Free charting tools are a fantastic starting point. If you're just learning the ropes of technical analysis, they give you enough to understand the core concepts—things like trendlines, support, and resistance. You'll get standard chart types and a handful of the most popular indicators.
But if you're serious about trading, you'll likely hit the limits of free software pretty quickly. These tools usually come with delayed data, a small set of indicators, and very few ways to tweak the setup to your liking. For active trading, real-time data and the advanced features you find in paid platforms aren't just nice to have—they're essential for keeping your edge.
How Much Should I Expect to Pay?
The cost of charting software is all over the map, and that’s a good thing. There's a solution for pretty much every budget and level of seriousness.
- Free or Freemium: Perfect for learning the basics. Just be aware of their limitations, especially the lack of real-time data.
- Mid-Range ($30-$100/month): This is the sweet spot for most dedicated retail traders. You get a robust suite of tools, real-time data, and plenty of customization without breaking the bank.
- Professional Tier ($100+/month): These are the heavy-duty platforms for institutional folks or highly advanced traders. They often include premium, specialized data feeds and proprietary analytical tools you won't find elsewhere.
Ultimately, what you should pay comes down to how often you trade and which features you genuinely need to execute your strategy.
Ready to see what a platform built for clarity and precision can do for your market analysis? Find out how ChartsWatcher helps you spot opportunities faster and trade smarter. Start your journey with ChartsWatcher today!
