A Trader's Guide to the Wedges Trading Pattern
The wedges trading pattern is one of those classic chart formations that signals a major shift is likely on the horizon. It’s defined by two converging trendlines that literally squeeze the price into a tighter and tighter range, pointing to a temporary stalemate before one side—buyers or sellers—finally gives in.
Understanding the Market's Coiled Spring
Think of a metal spring being slowly compressed. The more pressure you apply, the more pent-up energy it stores. Once you let go, that energy has to go somewhere, and it bursts outward with force.

The wedges trading pattern is the market’s version of that coiled spring. It’s a visual representation of a tug-of-war where momentum is fading and tension is building before an explosive move.
This compression plays out between two trendlines—one acting as support and the other as resistance. As the price bounces between them, the trading range narrows, and you'll typically see volume dry up. That drop in volume is a dead giveaway that the prevailing trend is losing its conviction.
The Two Core Wedge Variations
Traders really only need to know two types of wedges, and each one tells a completely different story about what might happen next. Getting the distinction right is key to trading them effectively.
- The Rising Wedge: This pattern angles up, marked by a series of higher highs and higher lows. But don't let the upward slope fool you; it's almost always a bearish reversal signal. It suggests the buyers are getting exhausted.
- The Falling Wedge: Sloping downward, this pattern is built from lower highs and lower lows. It’s typically a powerful bullish reversal signal, hinting that sellers are running out of steam and buyers are about to step in.
Put simply, a rising wedge shows buyers are struggling to make meaningful new highs, while a falling wedge shows sellers can’t push the price down as effectively as they once could.
This pattern is terminal, meaning it must eventually end. The tightening consolidation builds pressure, leading to an almost inevitable breakout as one side of the market finally capitulates.
Rising Wedge vs Falling Wedge at a Glance
To make it even clearer before we dive into the nitty-gritty, here’s a quick side-by-side comparison. Think of this table as your cheat sheet for identifying which wedge you're looking at.
| Characteristic | Rising Wedge | Falling Wedge |
|---|---|---|
| Appearance | Slopes upward with converging trendlines | Slopes downward with converging trendlines |
| Typical Signal | Bearish Reversal | Bullish Reversal |
| Price Action | Higher Highs and Higher Lows | Lower Highs and Lower Lows |
| Expected Breakout | Downward (below support) | Upward (above resistance) |
Keep this reference handy. We'll be breaking down the specific anatomy, entry triggers, and trading strategies for each of these patterns in the sections to come.
Identifying the Two Types of Wedge Patterns
At first glance, wedges can be a bit counterintuitive. Their direction often hints at the exact opposite of where the price is likely to go next. The best way to think about them is as signs of exhaustion. One side of the market—either the bulls or the bears—is slowly running out of steam.
Nailing down the anatomy of the two main types, the rising and falling wedge, is your first step to trading them well. Each pattern tells a story about market psychology. One screams that an uptrend is getting tired, while the other suggests a downtrend is losing its bite. Let's break down what to look for.
The Rising Wedge: A Bearish Reversal Pattern
A rising wedge slopes upward, squeezed between two converging trendlines. It’s formed by a series of higher highs and higher lows. On the surface, it looks bullish, right? The price is still technically climbing. But that’s the trick—it’s a deceptive look that masks a growing weakness underneath.
The secret is in the slope of the lines. In a rising wedge, the lower support line is steeper than the upper resistance line. This means each new low is rising faster than each new high. The price swings get shorter and feel more labored, a clear signal that buyers are struggling to push the price higher with the same old conviction.
This buyer exhaustion is usually backed up by another critical piece of evidence: declining volume. As the pattern tightens, you’ll almost always see trading volume dry up. That's a classic sign that the buying pressure fueling the uptrend is fading, leaving the asset vulnerable to a sharp turn.
A rising wedge is a classic bearish signal because it shows a loss of upside momentum. The buyers are still in control, but their pushes higher are becoming less and less impressive, setting the stage for sellers to take over.
Eventually, this coiling price action has to resolve. For a rising wedge, the high-probability outcome is a decisive break downward through the lower support trendline. That breakdown is the confirmation that sellers have finally wrestled control from the exhausted buyers, often sparking a fast move to the downside.
The Falling Wedge: A Bullish Reversal Pattern
On the flip side, the falling wedge is a powerful bullish reversal pattern. You'll spot this one by its two converging trendlines sloping downward, connecting a series of lower highs and lower lows. The crucial detail here is that the upper resistance line is steeper than the lower support line.
This structure paints a picture of a market where sellers are still in charge, but their efforts are producing less and less of a result. Each new low isn't falling as far as the last, which tells you the selling pressure is fizzling out. The bears are simply running out of gas.
Just like its bearish cousin, the falling wedge is usually accompanied by shrinking volume as it develops. This drop-off in volume shows that sellers are becoming less aggressive. It's this waning momentum that creates a coiled-spring effect, building up potential energy for a powerful move in the other direction. For a deeper dive, check out our complete trader's guide to the falling wedge pattern.
The finale for a falling wedge is a breakout upward through the upper resistance trendline. This move signals that buyers have finally absorbed all the selling and are ready to take prices higher, often with a big surge in volume to confirm the reversal is real.
Don't just take my word for it—the data backs these patterns up. Research shows that falling wedges have successfully predicted bullish reversals around 68% of the time across different markets. When these wedges show up inside a larger bull market, that success rate jumps to about 74%. And for rising wedges in a bear market? They have an even higher success rate of 81% for bearish breakouts.
How to Spot a Wedge Pattern on Your Charts
Alright, let's move from theory to the trading floor. Spotting a genuine wedges trading pattern takes more than just seeing two lines that might cross—it’s about knowing the specific ingredients that give the pattern its punch. Think of yourself as a detective, piecing together clues that point to a high-probability setup.
To spot a wedge like a pro, you need to check off a few key criteria. The most obvious place to start is the structure itself. The two trendlines must be converging, squeezing the price into a tighter and tighter zone. This visual compression is your first signal that market energy is building up for its next big move.
The Five-Point Validation Rule
A reliable wedge isn't just some random shape on your chart; it needs a specific number of "tests" before you should take it seriously. Most experienced traders look for a minimum of five touchpoints. This simply means the price has to react to the trendlines multiple times, proving they are legitimate boundaries of support and resistance.
Here's the breakdown:
- Three Touches on One Line: One of the trendlines—either support or resistance—needs to be hit at least three times.
- Two Touches on the Other: The opposing trendline needs at least two distinct touches.
This "three-plus-two" rule is your confirmation that both buyers and sellers are actually respecting the pattern's borders. Without these reactions, you might just be looking at market noise instead of a structured, tradable formation.
This diagram helps visualize how the initial price action clues can point you toward either a rising or falling wedge.
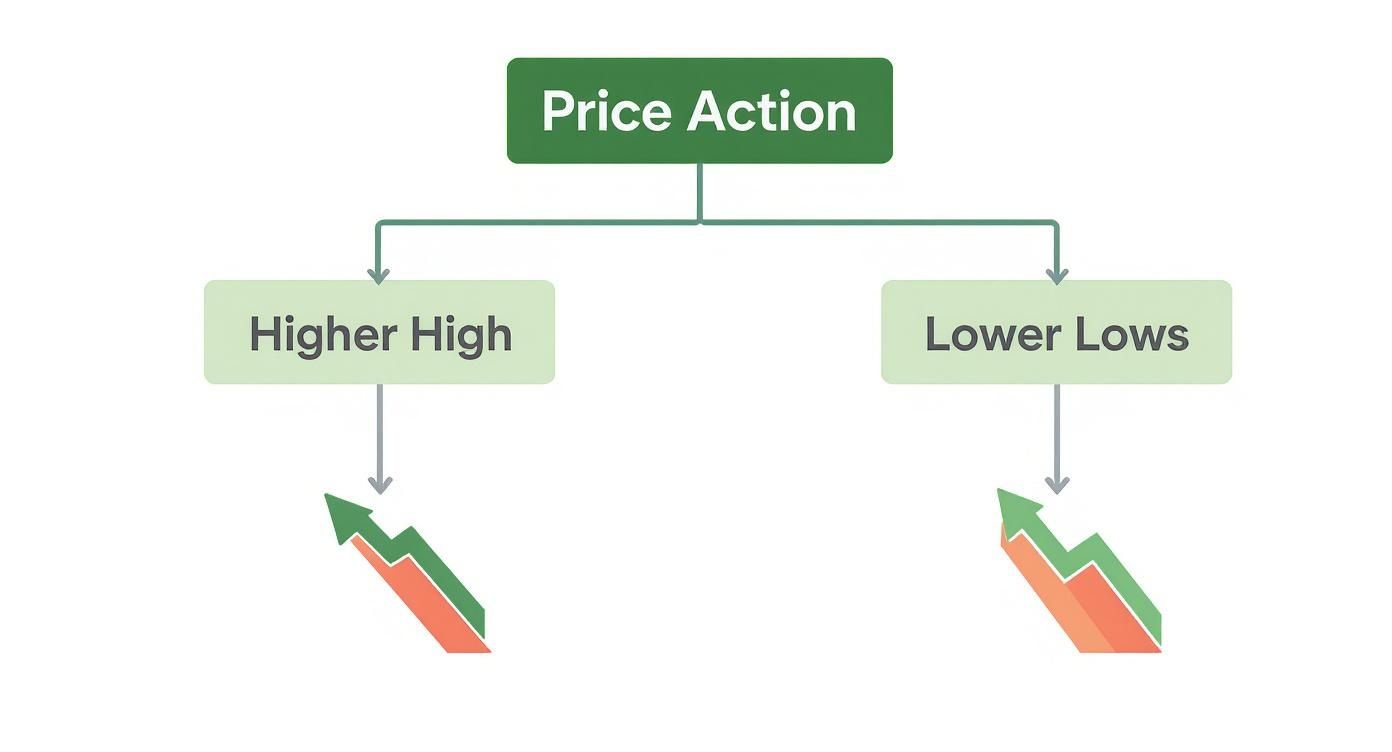
The key takeaway? The sequence of highs and lows gives you the first, most crucial clue about which type of wedge is taking shape.
Confirming with Volume and Time
Beyond the chart's geometry, the most critical piece of supporting evidence is trading volume. A classic, high-quality wedge is almost always accompanied by volume drying up as the price consolidates. This drop-off in activity is your best sign that the current trend is running out of steam.
Think of declining volume as the market taking a deep breath. It shows participants are getting hesitant and uncertain, which sets the stage for the explosive move that often follows the breakout.
When you finally see volume spike as the price smashes through one of the trendlines, that's powerful confirmation. It tells you the breakout is for real and has conviction behind it. A breakout on low volume is a huge red flag and should be treated with extreme suspicion.
The timeframe a wedge forms over also speaks to its reliability. These aren't typically quick patterns. Powerful wedges often build over 3 to 6 months, which means patience and long-term analysis are your friends. The converging trendlines themselves usually develop over 10 to 50 trading periods (like days or weeks), creating that distinctive shape. If you're interested in the nitty-gritty, you can learn more about the intricacies of backtesting wedge pattern formations.
Avoiding Common Identification Mistakes
It’s surprisingly easy to get this wrong, especially when you're starting out. One of the most common blunders is confusing a wedge with a channel or a different type of triangle pattern.
- Wedges vs. Channels: In a channel, the support and resistance lines run parallel. In a wedge, they are clearly converging and will intersect if you extend them far enough to the right.
- Wedges vs. Triangles: They look similar, but the key difference is the slope. In a rising or falling wedge, both trendlines are sloped in the same direction (either up or down). With symmetrical or ascending/descending triangles, one of the lines is usually flat.
By sticking to a strict checklist—five touchpoints, converging lines, and declining volume—you build a dependable framework for filtering out the noise and spotting wedge patterns that are actually worth your attention.
Actionable Strategies for Trading Wedge Breakouts
Spotting a wedge pattern is a great start, but that's only half the battle. The real test of a trader comes down to execution—this is where discipline and a solid game plan make all the difference. Once you've qualified a wedge setup, your focus needs to pivot immediately to your entry, your exit, and how you're going to manage your risk. This is the moment you turn analysis into action.
The moment of truth arrives when the price finally punches through one of the wedge's trendlines. It's tempting to jump in right away, but that can be a costly mistake. Most traders follow one of two classic entry methods, each with its own trade-offs between risk and reward.
Choosing Your Entry: Aggressive vs. Conservative
How you enter a wedge breakout should really come down to your personal risk tolerance. There's no single "best" way—it all depends on whether you value getting in early or waiting for more proof.
-
The Aggressive Entry (Trading the Breakout Candle): This is for traders who don't want to miss the initial blast-off. You enter the moment a candle closes decisively outside the wedge, ideally on a spike in volume. For a falling wedge, that means buying as soon as a candle closes above the resistance line. For a rising wedge, you're shorting on a close below support.
- Pro: You get in at the ground floor, potentially capturing the biggest part of the move. If the price takes off and never looks back, you're in.
- Con: This method is vulnerable to "fakeouts." These are nasty reversals where the price pokes outside the trendline just long enough to trap eager traders before snapping back inside the pattern.
-
The Conservative Entry (Waiting for the Retest): This is the patient trader's approach. You let the initial breakout happen, then wait for the price to pull back and "retest" the trendline it just broke. In a falling wedge, old resistance becomes new support. In a rising wedge, old support becomes new resistance. You take your entry only when the price bounces off this retested level.
- Pro: This gives you a powerful second confirmation that the breakout is real, slashing the odds of getting caught in a fakeout. It also gives you a crystal-clear spot to place your stop-loss.
- Con: The market doesn't always give you a perfect retest. In really powerful breakouts, the price just keeps running, and you can end up missing the trade completely.
Setting Your Stop-Loss for Capital Protection
Let's be clear: a proper stop-loss is non-negotiable. It's your safety net, the line in the sand that defines your maximum acceptable loss. You should always place your stop at a price level that, if hit, completely invalidates your reason for taking the trade in the first place.
- For a Falling Wedge (Long Entry): Your stop should go just below the last significant swing low created inside the wedge. Another popular spot is just underneath the low of the breakout candle itself. If you waited for a retest, placing the stop just below that retested trendline is a solid choice.
- For a Rising Wedge (Short Entry): Place the stop-loss just above the last swing high formed within the pattern. This way, if the market unexpectedly rallies and makes a new high, you're automatically taken out because the bearish setup is clearly broken.
The golden rule for stop-loss placement is simple: Always place your stop in an area where the setup is clearly proven wrong if the price reaches it. This moves risk management from an emotional decision to a logical one.
Projecting Your Profit Targets: The Measurement Rule
Okay, you're in the trade and your stop is set. Now, where do you get out? While you can always use standard support and resistance levels, one of the best techniques for wedges is the measurement rule.
It's a straightforward way to project a minimum price target based on the geometry of the pattern itself.
- Measure the Height: Find the widest part of the wedge, right at the beginning of the formation. Measure the vertical distance between the support and resistance trendlines at that point.
- Project from the Breakout: Take that measured height and project it from the breakout point. For a bullish falling wedge, you add the height to the breakout price. For a bearish rising wedge, you subtract it.
This technique gives you a data-driven target to aim for. It's an excellent method for making sure your potential reward is worth the capital you're putting on the line.
How Reliable Are Wedge Patterns, Really?
Spotting a clean wedge pattern is a great start, but knowing how it's likely to perform in the real world is what separates the pros from the pack. Let’s be clear: no chart pattern is a crystal ball. No setup works 100% of the time. This section will give you a data-driven look at what you can realistically expect from wedges so you can trade them smarter.
A classic rookie mistake is getting excited by every breakout and assuming it’s a ticket to a winning trade. The truth is, a wedge's reliability can swing wildly depending on the market's mood and, more importantly, the timeframe you're watching. Lower timeframes are notoriously "noisy" and can easily fake you out with false signals.
Timeframe Is Everything
The data tells a clear story: there's a direct link between the timeframe and how trustworthy a pattern is. Higher timeframes, like the daily chart, naturally filter out the day-to-day market chatter, which means the patterns that form there are much more significant. They take longer to build, reflecting a genuine and powerful shift in market sentiment.
For instance, looking at the rising wedge, the difference is stark. Across 6,863 historical examples from the last 10 years, this pattern showed a modest 43% reliability rate. But when you zoom into the daily chart, that number jumps to a 56% win rate over 459 examples. That’s a massive 13 percentage point improvement.
On the flip side, the frantic 1-second chart had the worst performance, with only a 32% win rate. This proves just how much the odds can shift. The takeaway is simple: patience pays. Focusing on patterns that develop over days or weeks gives you a much better chance of catching a real, sustained move.
Here’s a quick breakdown of how the rising wedge’s win rate changes across different timeframes based on historical data.
Rising Wedge Win Rate by Timeframe
This table summarizes how the reliability of the rising wedge pattern changes across different trading timeframes, based on historical data.
| Timeframe | Win Rate (%) | Number of Examples |
|---|---|---|
| Daily | 56% | 459 |
| 4-Hour | 51% | 1,288 |
| 1-Hour | 47% | 2,109 |
| 5-Minute | 41% | 1,854 |
| 1-Second | 32% | 1,153 |
As you can see, longer timeframes consistently produce more reliable signals, reinforcing the idea that filtering out short-term noise leads to better trading outcomes.
The Power of Risk-to-Reward Ratio
A pattern's win rate is only half the story. Even with a success rate that’s just okay, wedges can be incredibly profitable because they often set up trades with an excellent risk-to-reward ratio. By using the "measurement rule" to set profit targets, you can often find setups where the potential profit dwarfs the potential loss.
A key to long-term success isn't just winning often, but winning big and losing small. Wedges are prized because they often signal moves large enough to offer a strong return ratio, frequently achieving 3:1 or better.
Think about it—a single successful trade with a 3:1 ratio can wipe out the losses from three losing trades and still put you in the green. This mathematical edge is precisely why traders have relied on this classic formation for decades. It doesn’t have to be perfect to be profitable.
To really get a handle on how wedges might perform with your specific strategy, digging into a comprehensive backtesting library is a game-changer. It lets you see exactly how these patterns have played out historically on the assets and timeframes you care about. When you combine solid statistical knowledge with your own testing, you can approach every wedge breakout with total clarity and trade with far more confidence.
Stop Hunting and Start Trading with Automation
Let's be honest: manually flipping through dozens, if not hundreds, of charts looking for the perfect wedges trading pattern is a recipe for frustration and missed opportunities. The market simply moves too fast for that.
Instead of being glued to your screen all day, you can let technology do the heavy lifting. Pattern scanners like ChartsWatcher are built for this exact purpose. They tirelessly watch thousands of stocks, forex pairs, and crypto assets, instantly flagging potential wedge patterns the moment they start to form. This flips the script entirely—you stop hunting for trades and start analyzing high-probability setups that are brought directly to you.
The whole process is pretty simple. You can set up a custom screen to filter for exactly what you want to see, whether it's specific markets, timeframes, or even volume spikes. This ensures you only get alerted to setups that perfectly match your trading style. For a deep dive into building your own, check out our guide on proven strategies for using a breakout stock screener.
Setting Up Custom Alerts
Once you've dialed in your filters, the real magic begins with real-time alerts. No more FOMO or endlessly refreshing charts. You'll get an instant notification the second a price breaks out of a confirmed wedge.
This screenshot gives you a feel for a typical dashboard where you can manage all your alerts and see what's hot, all in one spot.
This kind of centralized view means when an alert hits, you're just one click away from the chart, ready to analyze and act.
Automation isn't about replacing your skill as a trader. It's about amplifying it. By letting the scanner filter out all the market noise, you free up your time and mental energy to focus on what really matters: making smart, disciplined decisions on the best opportunities available.
Your Top Wedge Pattern Questions, Answered
Even when you've got the theory down, trading wedges in a live market always brings up new questions. It's one thing to see a pattern in a textbook; it's another to manage a trade when real money is on the line.
Let's tackle some of the most common sticking points traders run into. We'll clear up the finer details, from telling wedges apart from their look-alike cousins to knowing exactly what to do when a trade starts to go sour.
How Is a Wedge Different from a Triangle Pattern?
This is easily the most frequent point of confusion, and for good reason—both patterns involve price getting squeezed between two converging trendlines. The real giveaway is the slope of those lines. A wedge pattern has both trendlines pointing in the same direction. They're either both angled up (rising wedge) or both angled down (falling wedge).
Triangles, on the other hand, almost always have one flat side:
- An ascending triangle has a rising support line pushing price up against a flat, horizontal resistance level.
- A descending triangle has a flat support level with a falling resistance line pushing price down.
Here's a simple way to think about it: A wedge usually signals that a trend is running out of steam. A triangle is more like a pit stop—a period of consolidation before the original trend likely kicks back into gear.
What Should I Do If a Breakout Fails?
Ah, the dreaded "fakeout." This is when the price pokes its head out of the pattern, luring you into a trade, only to snap right back inside. It’s a classic trap, but your response needs to be mechanical, not emotional. The second the price closes back inside the wedge, your entire reason for taking the trade is gone.
The only disciplined move is to exit the trade immediately. Holding on and hoping it turns around is how you transform a small, calculated risk into a big, painful mistake.
You can always get back in if another valid breakout signal appears later. Cutting a small loss quickly protects your capital and your mental game, freeing you up to focus on the next high-quality setup.
How Important Is Volume for Confirming a Breakout?
Volume isn't just a "nice to have"—it's one of the most crucial pieces of evidence you have. Think of it as the market showing its hand. A real, convincing breakout from a wedges trading pattern should be turbocharged by a major spike in trading volume. That surge of activity is the market putting its money where its mouth is, confirming that a crowd of participants is powering the move.
On the flip side, a breakout on weak or declining volume is a massive red flag. It screams lack of conviction and dramatically raises the odds of a fakeout. Always look for that volume kick. It's the market's way of telling you, "This move is for real."
Ready to stop hunting for patterns and start trading them? ChartsWatcher automatically scans the market for high-probability wedge setups and alerts you in real-time, so you never miss an opportunity. Find your next winning trade at chartswatcher.com.
