A Trader's Guide to the Falling Wedge Pattern
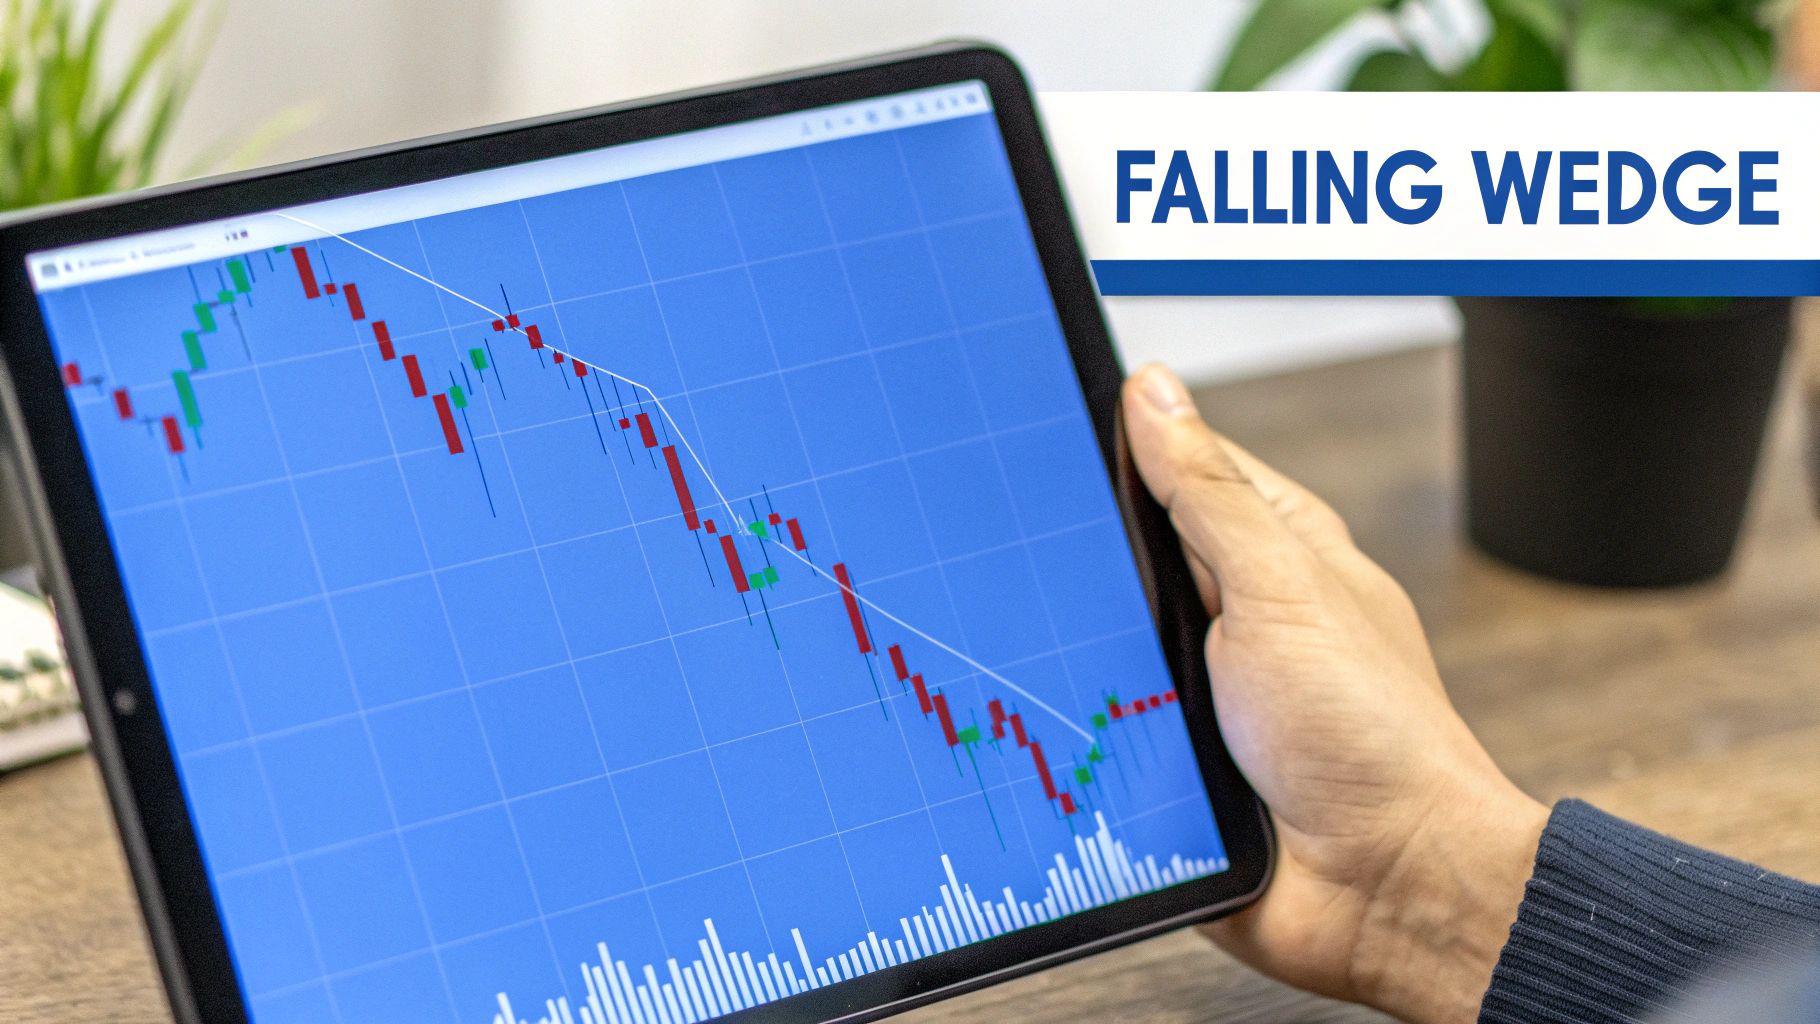
The falling wedge pattern is one of those classic chart formations that gets bullish traders excited. At its core, it’s a setup that signals a potential turnaround, an upward price reversal just when a downtrend seems to be running out of steam.
It looks like a downward-pointing cone on your chart, and it tells a story of weakening sellers and buyers quietly stepping in to take control.
What Is a Falling Wedge Pattern
Think of the falling wedge as a visual cue that the market's power dynamics are shifting. Initially, the sellers are clearly in charge, pushing the price lower and lower. But as the pattern takes shape, you can see their momentum starting to fizzle out.
This is what makes it a classic bullish reversal pattern. It's defined by two trendlines, both sloping downward, that are squeezing the price into a tighter and tighter range.
It's almost like a coiled spring. The price is getting compressed, building up tension for what's often a powerful pop to the upside. When the price finally punches through that upper trendline, it’s the market’s way of saying the buyers have soaked up all the selling pressure and are ready to push prices higher.
The Anatomy of the Pattern
To really get a feel for this pattern, you need to know its core components. Each piece of the puzzle helps validate the signal and gives you more confidence in the potential trade.
- Converging Trendlines: The pattern is framed by two lines sloping down. The upper line connects a series of lower highs, and the lower line connects a series of lower lows. The fact that they're squeezing together is what gives the pattern its name and its power.
- Declining Volume: This is a huge clue. As the wedge forms, you'll often see trading volume begin to dry up. This tells you the sellers are losing conviction; the bearish momentum is fading.
- The Breakout: The pattern is confirmed when the price breaks decisively above the upper resistance trendline. Ideally, this move happens on a surge of volume, confirming that buyers have entered the chat with force.
To help you spot this pattern in the wild, here's a quick reference table of its key features.
Falling Wedge Pattern Key Identifiers
| Characteristic | Description |
|---|---|
| Market Trend | Occurs during a downtrend. |
| Shape | Two downward-sloping, converging trendlines. |
| Highs and Lows | Forms a series of lower highs and lower lows. |
| Volume | Typically decreases as the pattern matures. |
| Confirmation | A decisive breakout above the upper trendline. |
| Signal | Bullish reversal (or continuation in an uptrend). |
Think of this table as your field guide for identifying a high-quality falling wedge setup.
A falling wedge can take weeks or even months to fully form, so patience is key. The slow, grinding nature of its formation is precisely what builds the pressure needed for a strong reversal.
Learning to spot the falling wedge is a fantastic way to add a reliable tool to your trading toolkit. It’s one of several important formations that can help you read the market’s mood. To build on this, you might want to check out our guide to master technical analysis patterns for better trading results. This pattern is a great reminder that even in a sea of red, bullish opportunities are always just around the corner if you know what to look for.
How to Spot a Falling Wedge on Your Charts
Moving from theory to practice is where a trader’s skills are truly forged. Spotting a falling wedge in a live market isn't about guesswork; it's about training your eyes to see a specific set of clues line up. Think of it like a detective assembling evidence—each piece has to fit perfectly before you can be sure of your conclusion.
At its heart, the pattern has three non-negotiable components. Once you learn to spot these, you'll start seeing this powerful setup with much more confidence.
The Three Core Components of a Falling Wedge
First, and most obviously, you need two converging trendlines. The top line acts as resistance, connecting a series of lower highs. The bottom line provides support, connecting a series of lower lows. The critical detail? Both lines have to be sloping downwards.
Picture a ball bouncing down a narrowing hallway—each bounce is weaker, and the space gets tighter. That visual compression is the signature of a falling wedge. Using a tool like ChartsWatcher, you can easily draw these lines by connecting at least two swing highs and two swing lows to frame the pattern.
The second component is the price action itself. You absolutely must see a clear sequence of lower highs and lower lows. This is the market telling you that sellers are initially in control, pushing the price down. But here's the twist: the lows aren't falling as fast as the highs. This is what causes the two trendlines to squeeze together.
This convergence is the visual proof of seller exhaustion. While they’re still pushing the price down, their efforts are getting weaker and weaker, a clear signal that they're losing their grip on the market.
Finally, the third critical piece of the puzzle is declining trading volume. As the wedge forms and the price action gets tighter, you should see a noticeable drop-off in volume. This is a massive tell-tale sign that the conviction behind the downtrend is fading away.
Confirming the Pattern with Volume
So, why does volume matter so much? Low volume during the pattern's formation suggests that fewer and fewer traders are willing to sell at these lower prices. The sellers are running out of steam, and the buyers are starting to absorb the remaining supply without much of a fight.
Here’s a quick visual checklist to run through when you think you've found a falling wedge on your ChartsWatcher screen:
- Identify a Pre-existing Downtrend: The pattern is a bullish reversal signal, so it has to show up after a clear move down.
- Draw the Upper Trendline: Connect at least two (but preferably three) consecutive lower highs. This line will point down.
- Draw the Lower Trendline: Connect at least two (again, three is better) consecutive lower lows. This line also slopes down, but at a shallower angle than the upper line.
- Check for Convergence: Make sure the two lines are moving toward each other, visually squeezing the price into the tip (apex) of the wedge.
- Analyze the Volume: Glance at the volume indicator at the bottom of your chart. You should see a general decline in trading activity as the pattern develops.
When all these elements click into place, you've likely identified a high-probability falling wedge. The final confirmation is always the breakout, but spotting the setup correctly is the foundational skill that puts you in a position to act.
The Market Psychology Behind the Pattern

Every chart pattern tells a story, and the falling wedge pattern reveals a classic power struggle. One side is clearly losing its grip while the other is quietly building strength. It’s the perfect visual of seller fatigue meeting a surge of buyer confidence.
Think of it like a tug-of-war. In the beginning, the sellers are in control, yanking the price down. They make a new low, but the buyers' counter-pull is just a little bit stronger than before. Sellers try again, but they can't drag the price down as far or as fast. Their pulls are getting weaker.
This loss of momentum is the heart and soul of the pattern's psychology. The series of lower lows tells you sellers are still around, but the shrinking price swings show their conviction is fading. They're running out of steam.
The Shift From Fear To Opportunity
At the same time, a completely different story is playing out on the buyers' side. Early in the downtrend, they're hesitant, and for good reason. But as prices fall and sellers start to look tired, bargain hunters begin to sniff out an opportunity.
They start stepping in at higher and higher levels, putting a floor under the price and preventing those sharp new lows. This subtle but critical change is what forces the two trendlines together. Buyers are getting more aggressive just as sellers are becoming more passive.
This compression phase is where market sentiment pivots. The fear that drove the downtrend is slowly being replaced by the belief that the asset is becoming undervalued, setting the stage for a reversal.
Understanding the mindset here is crucial. Most traders are wary of buying into a falling market, but the wedge’s structure gives you clues that the game is changing. Digging into the psychology of 'catching a falling knife' can offer some fascinating insights into this risk-reward calculation.
The breakout above the upper trendline is the climax of this whole story. It’s the moment the buyers’ rope finally jerks the sellers off their feet. This decisive move, often with a spike in volume, confirms that the balance of power has officially shifted. The quiet accumulation is over, and a new uptrend is likely kicking off.
By learning to read this psychological battle, you can turn a few simple lines on a chart into a powerful market sentiment indicator.
Actionable Trading Strategies for the Falling Wedge

Spotting a falling wedge pattern is one thing, but turning that chart into a profitable trade is a whole different ball game. What really matters is having a solid plan. A good strategy needs a clear trigger for getting in, a predefined exit for when you're wrong, and a target for taking your profits.
The moment of truth for any falling wedge is the breakout. This is where the price finally punches through the upper resistance trendline with conviction, signaling that the buyers have wrestled control from the sellers. How you jump into the trade right here really comes down to your personal appetite for risk.
Choosing Your Entry Point
You've got two main ways to enter a trade after a breakout, and each comes with its own trade-offs. Knowing both lets you pick the right tool for the job depending on how the market is behaving and what fits your trading style.
-
The Aggressive Entry: This is for traders who want to get in on the action right away. You open a long position as soon as you see a candle close decisively above the upper trendline. The big upside here is catching the move right from the beginning, which is great if the breakout has explosive momentum. But, and it's a big but, you run a higher risk of getting faked out—where the price pokes its head above the line only to get smacked right back down.
-
The Conservative Entry: If you're the patient type, this one's for you. Instead of jumping in immediately, you wait for the price to pull back and retest the trendline it just broke. That old resistance line often becomes new support. Entering on this "kiss" goodbye to the old level confirms the breakout has legs and usually gives you a much better risk-to-reward ratio. The only catch? In a super-strong breakout, the price might just take off and never look back, leaving you on the sidelines.
Setting Your Stop-Loss and Profit Targets
Let's be clear: effective risk management is non-negotiable. Without it, even a perfect-looking pattern can blow up your account. Luckily, the rules for setting your safety nets on a falling wedge are pretty logical and straightforward.
Your stop-loss should be tucked just below the most recent swing low inside the wedge. Think of this level as the buyers' last line of defense. If the price breaks below it, the whole bullish idea is likely busted. Placing your stop here lets you get out with a small, manageable loss if the breakout turns out to be a dud.
A well-placed stop-loss isn't just a safety measure; it's a strategic decision that defines your risk on the trade before you even enter, allowing you to trade with discipline rather than emotion.
Now for the fun part: your profit target. The classic method is to measure the height of the wedge at its widest point. Then, you simply project that same distance up from the point where the price broke out. This gives you a data-driven target based on the pattern's own size and energy. In fact, studies show that successful falling wedge breakouts can produce average profits of around 38%, which is why traders love these setups.
This data, which holds true across stocks, forex, and crypto, helps ground your expectations. Combining these tactics for entry, stop-loss, and profit-taking gives you a complete blueprint for trading this powerful pattern.
If you're looking to go even deeper, be sure to check out our detailed guide on how to master wedge pattern trading with profitable strategies inside.
Falling Wedge vs. Rising Wedge Compared
To really get a handle on the falling wedge, you’ve got to know how to tell it apart from its bearish twin, the rising wedge. Think of them as mirror images—they look similar but tell you completely opposite stories about where the market might be heading. Mixing them up is a classic rookie mistake, and it can be a painful one for your account.
The core difference is simple: it comes down to their shape and what they predict. A falling wedge pattern is made up of two trendlines that both slope downwards and squeeze closer together. It’s a bullish signal hiding in plain sight. It usually shows up during a downtrend, but it’s actually a sign that the sellers are running out of steam, setting the stage for a powerful move up.
On the other hand, a rising wedge has two trendlines that both slope upwards and converge. This pattern is a warning sign for the bulls. It tends to form during an uptrend and whispers that the buying pressure is fading, often right before the price takes a nosedive.
Key Distinctions at a Glance
The easiest way to tell them apart is just to look at the direction of the trendlines. In a falling wedge, both lines point down, hinting at a potential price pop. In a rising wedge, both lines point up, signaling a potential price drop.
Let's put these two powerful patterns side-by-side to make the differences crystal clear. This table should be your go-to reference to avoid any confusion.
Comparison of Falling Wedge and Rising Wedge Patterns
| Attribute | Falling Wedge (Bullish) | Rising Wedge (Bearish) |
|---|---|---|
| Trendlines | Two downward-sloping lines converge. | Two upward-sloping lines converge. |
| Market Signal | Bullish Reversal or Continuation. | Bearish Reversal or Continuation. |
| Volume Pattern | Volume typically decreases as the pattern forms, then spikes on the breakout. | Volume typically decreases as the pattern forms, then spikes on the breakdown. |
| Typical Breakout | Price breaks upward through the upper resistance line. | Price breaks downward through the lower support line. |
| Market Story | Sellers are losing momentum, and buyers are quietly gaining control. | Buyers are losing momentum, and sellers are preparing to take over. |
Nailing this distinction is absolutely crucial for any trader. Why? Because getting it wrong is one of the most common ways people lose money with these patterns.
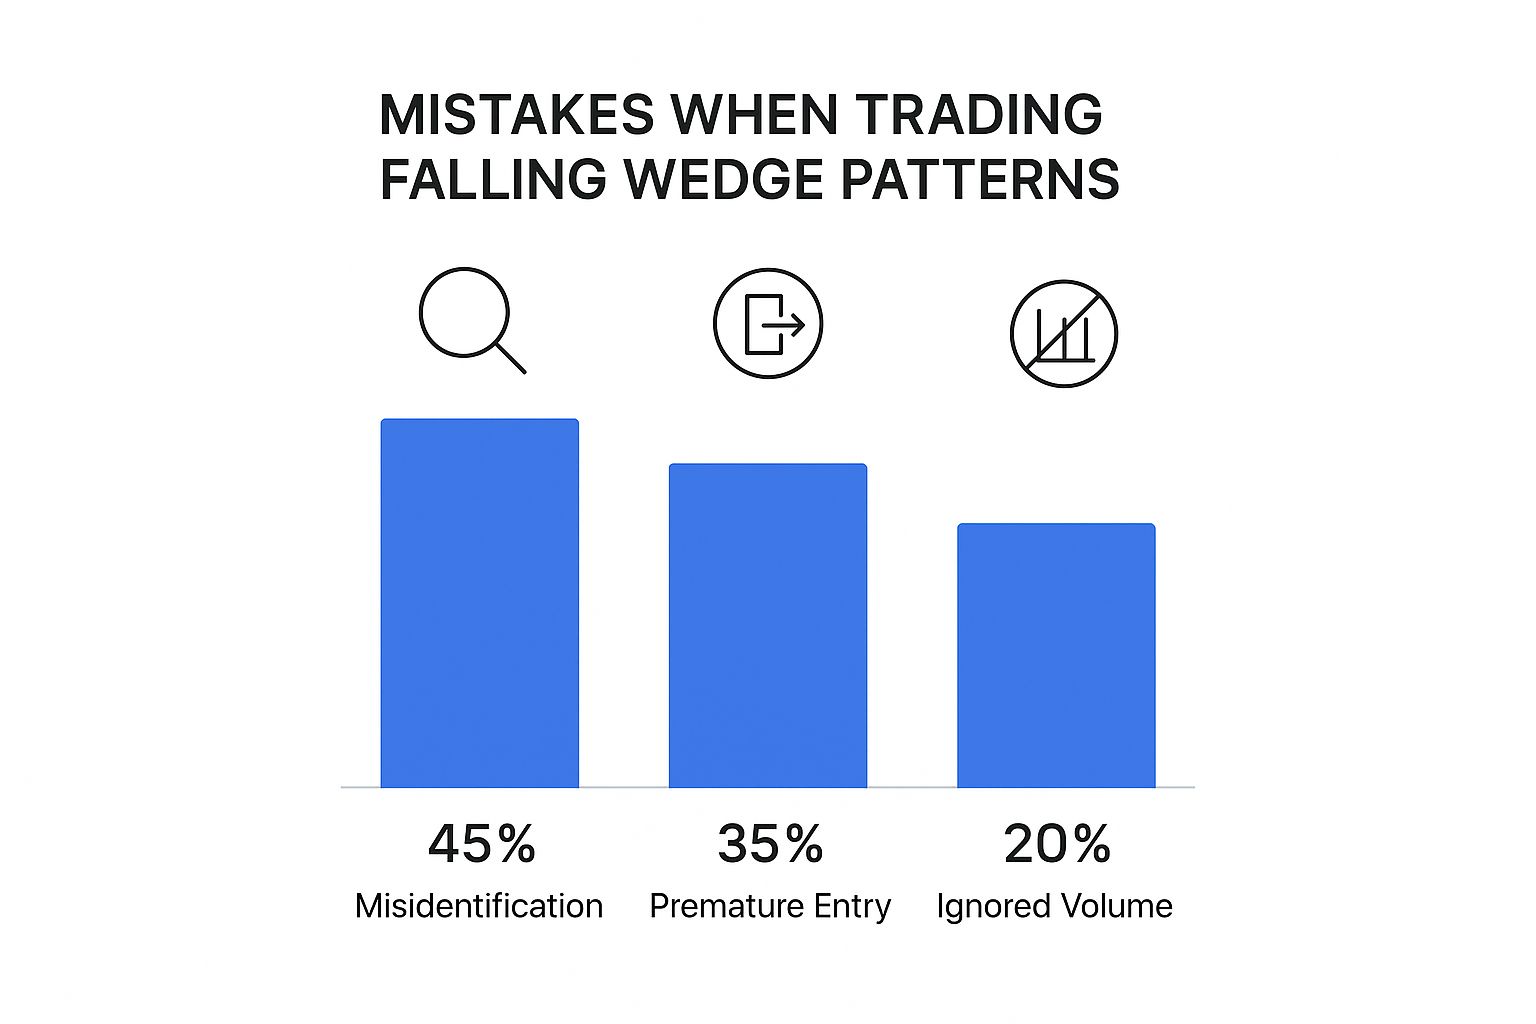
As you can see, misidentifying the pattern is a huge problem, accounting for a massive chunk of trading mistakes when it comes to wedges. This is exactly why you have to take a moment to confirm the slope of the trendlines and consider the bigger picture of the price action. By cementing the difference between the falling wedge and the rising wedge in your mind, you give yourself a much better shot at reading the market correctly and making the right call.
Putting It All Together with Real World Examples
Theory is great, but there's nothing like seeing a falling wedge pattern unfold in a real, live market to build your confidence. This is where we bridge the gap. We're going to break down actual patterns using the tools inside ChartsWatcher to show you how this bullish setup works across different assets and timeframes.
One of the best things about the falling wedge is its versatility. The core psychology—sellers running out of steam—is the same whether you're looking at a fast-moving crypto, a major forex pair, or a blue-chip stock. Let's see how these ideas translate into real trades on a chart.
A Look at a Stock Market Reversal
Picture a popular tech stock that's been sliding for weeks. Pulling it up on ChartsWatcher, you start to see the tell-tale signs: two downward-sloping trendlines that are slowly squeezing the price. It's still making lower highs and lower lows, but the bounces off that bottom support line are getting weaker and less enthusiastic.
At the same time, you glance down at the volume indicator and notice a clear drop-off. This is the confirmation you're looking for. It tells the story of sellers losing their conviction. The stage is set.
- The Setup: A clean falling wedge takes shape over a six-week period.
- The Breakout: The price makes a decisive move, closing firmly above the upper resistance trendline.
- The Volume Spike: That breakout candle is powered by the highest trading volume in over a month, signaling that buyers have jumped in with force.
- The Result: Over the next few weeks, the stock rallies hard, proving the pattern’s bullish signal was spot on.
This is a classic example of how all the pieces—the trendlines, the price action, and the volume—need to lock into place to create a high-probability setup.
Cross-Market Application and Performance
This pattern isn't just a one-trick pony for stocks. When you look at historical data across major financial markets, the falling wedge consistently performs. For instance, it has effectively signaled reversals in stocks like Wayfair (W) and currency pairs like USD/JPY. In both cases, the price consolidated inside the wedge before launching significantly higher. The volume signature was also textbook: declining volume as the wedge formed, followed by a massive surge on the breakout.
By applying the trading strategies we covered earlier—like entering on the breakout and tucking a stop-loss just below the recent swing low—a trader could have jumped on these moves with a clearly defined risk-to-reward ratio.
It's this kind of cross-market consistency that makes the falling wedge such a reliable tool for any trader to have in their back pocket.
If you're looking to see more practical applications and real-world trading examples, the Fundpilot Blog often breaks down relevant market action. Studying these charts is how you train your eye to spot the subtle clues of a developing pattern, turning what looks like random lines into a powerful forecasting tool. The key is practice. The more of these setups you identify, the more prepared you'll be to act when the next perfect opportunity lights up your screen.
Got Questions About the Falling Wedge? We've Got Answers.
Even after you've studied a pattern inside and out, questions inevitably pop up when you're about to put real money on the line. Let's tackle some of the most common ones traders have about the falling wedge.
Think of this as your quick-reference guide for those nagging "what if" moments that can cause hesitation right when you need to act.
How Reliable Is the Falling Wedge Pattern, Really?
In the world of chart patterns, the falling wedge is considered one of the more dependable signals out there. While nothing in trading is a sure thing, the psychology behind this pattern gives it a solid, logical foundation for a bullish reversal. You're seeing seller exhaustion in real-time as buyers quietly begin to step in, creating a high-probability setup.
In fact, some comprehensive studies have found the falling wedge has a breakout success rate pushing 74% when it's identified correctly, especially in an overall bullish market. You can dig deeper into these findings on bapital.com. Its reliability gets a serious boost when you see volume drying up during the pattern's formation, followed by a big spike in volume on the breakout. That's the confirmation you're looking for.
A pattern's reliability isn't just a statistic; it's a reflection of predictable market psychology. The falling wedge reliably signals a power shift from sellers to buyers, which is why traders trust it.
What Happens If a Falling Wedge Fails?
A failed falling wedge is a powerful signal in its own right, just not the one you were hoping for. A failure happens when the price breaks down below the lower support trendline instead of popping up through the upper resistance. This is a clear bearish development.
It’s the market telling you that sellers weren't tired after all; they were just catching their breath before another push lower. This kind of breakdown completely invalidates the bullish idea and strongly suggests the downtrend is about to continue, maybe even with more force. This is precisely why having a stop-loss in place isn't just a suggestion—it's non-negotiable.
Can This Pattern Be Used in Any Market?
Absolutely. The falling wedge is a universal pattern because it's built on human psychology—fear and greed—which is the same no matter what you're trading. You can spot and trade this pattern effectively in just about any market:
- Stocks: From household names to high-flying tech stocks.
- Forex: On major currency pairs like the EUR/USD or USD/JPY.
- Cryptocurrencies: In fast-moving markets like Bitcoin and Ethereum.
- Commodities: On everything from gold and oil to agricultural products.
The core principles of fading momentum and potential trend reversal apply just as well on a 5-minute chart as they do on a weekly chart.
Ready to spot these patterns in real-time? ChartsWatcher provides the advanced scanning and charting tools you need to identify high-probability falling wedge setups across any market.
