A Trader's Guide to the Hull Moving Average
The Hull Moving Average (HMA) is a slick, modern technical indicator cooked up by Alan Hull. His goal? To create an indicator that’s both incredibly responsive to recent price action and surprisingly smooth. Unlike the old-school moving averages that always seem to be a step behind the market, the HMA is designed to give you earlier, cleaner signals about where a trend is heading.
Why Traders Needed a Better Moving Average
Ever feel like you're trying to drive a car by only looking in the rearview mirror? That’s what trading with standard moving averages can feel like. Indicators like the Simple Moving Average (SMA) and Exponential Moving Average (EMA) are staples, but they have an inherent flaw: they lag. They show you where the price has been, which is often too late to make a good decision.
This delay can mean you either miss the boat on a great trade or, even worse, jump in just as the trend is about to fizzle out.
It was this fundamental problem that pushed Australian trader Alan Hull to build a better mousetrap. He wanted an indicator that could keep up with the market’s pace without all the "noise" and false signals you get from other fast-moving averages. The mission was to build a tool that delivered the best of both worlds: speed and clarity.
The Need for Speed and Smoothness
With traditional indicators, you're always forced to make a trade-off.
- Simple Moving Average (SMA): This one gives you a beautifully smooth line, but it’s notoriously slow to react to what the price is doing right now. It's like a heavy family sedan—reliable, but not exactly agile.
- Exponential Moving Average (EMA): The EMA cuts down on some of that lag by putting more weight on recent prices, but it can still be sluggish and prone to getting you chopped up in volatile, sideways markets.
The Hull Moving Average was engineered to shatter this compromise. Think of it as a high-performance race car. It’s built to hug the curves of the price chart, accelerate hard when a new trend kicks off, and brake smoothly, giving you a much sharper view of the market's immediate direction.
At its core, the HMA was created to solve the persistent lag problem that plagues most moving averages. Its design prioritizes responsiveness, allowing traders to identify trend shifts much earlier than with conventional tools.
The real magic of the HMA is in its math. Alan Hull developed a unique formula that uses a clever framework involving Weighted Moving Averages (WMAs) and the square root of the period. The calculation is HMA = WMA(2 * WMA(n/2) − WMA(n), √n), where 'n' is your chosen period.
This process effectively halves the typical lag while simultaneously ironing out the noisy data, letting you spot trends earlier. You can learn more about this innovative formula on Forex Tester. This clever design is what makes the Hull Moving Average such a vital tool for any modern trader, giving you a distinct edge in gauging trend momentum with real precision.
How The HMA Formula Achieves Its Speed And Smoothness
To really get why the Hull Moving Average is such a game-changer, you have to pop the hood and see how it’s built. It uses a clever, three-step process to tackle the two biggest headaches for trend traders: lag and noise.
At first glance, the math might look a little intimidating, but the logic behind it is actually quite brilliant and easy to follow. The entire calculation is engineered to hug recent price action tightly without turning into the jittery, unreliable mess you often get with other "fast" indicators. Let's walk through how each piece of the puzzle works.
The Foundation: A Weighted Moving Average
Everything starts with the Weighted Moving Average (WMA). Unlike a Simple Moving Average (SMA) that gives every single price point an equal vote, the WMA plays favorites. It gives much more importance to the most recent prices.
Think of it like this: an SMA is like asking a big group for their opinion and treating everyone's input the same. A WMA, on the other hand, listens most closely to the person who just saw what happened. This simple difference makes the HMA faster than any SMA-based indicator right out of the gate.
This diagram shows you exactly what we're talking about—the classic lag problem that every trader faces, and how the HMA was designed as the high-speed solution.
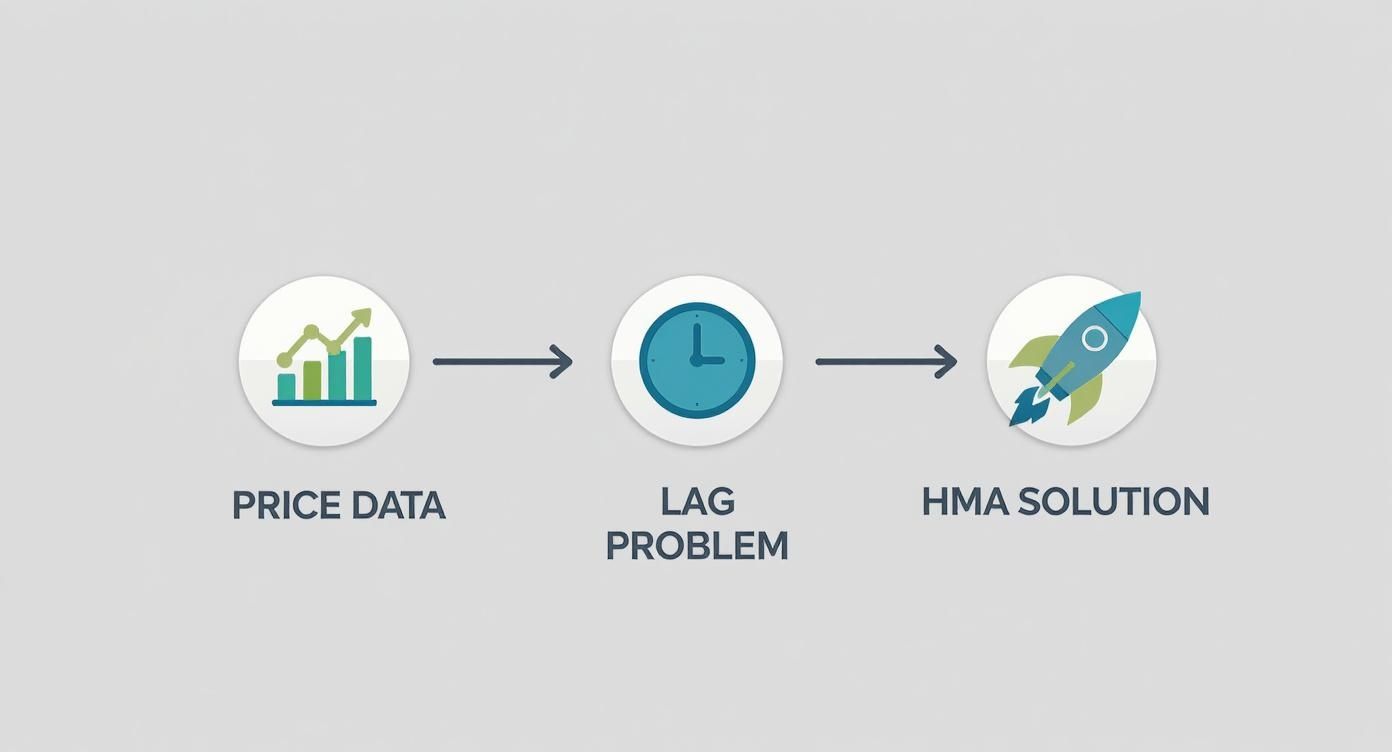
As you can see, the whole point is to cut through the noise and get a signal that’s actually relevant to what’s happening now, not ten bars ago.
The Lag-Cancellation Trick
This is where the real magic happens. Alan Hull's formula has a brilliant way of combining two different WMAs to essentially cancel out the built-in lag that plagues other moving averages.
Let’s use a standard 16-period HMA as our example. Here’s the breakdown:
-
First, the Fast WMA: The indicator calculates a WMA using half the period. For our 16-period HMA, that means it runs an 8-period WMA. This initial average is incredibly quick and responsive to every little price shift.
-
Then, the Slow WMA: Next, it runs a second WMA using the full period—in this case, a 16-period WMA. This one acts as a more stable, smoothed-out baseline of the recent trend.
-
The Subtraction: Now for the clever part. The formula takes the fast 8-period WMA, doubles it, and then subtracts the slower 16-period WMA from that result. This move isolates and boosts the impact of the most recent price data while stripping away the old, lagging information that was common to both averages.
This process of combining a half-period and full-period WMA is the HMA's secret weapon against lag. It allows the indicator to aggressively track current price action far more closely than an EMA or SMA ever could.
The Final Smoothing Step
After that lag-cancellation step, the resulting data is super responsive, but it can be a little too raw and choppy. The final step is to apply one last layer of smoothing to give us a clean, actionable line on the chart.
To do this, the formula applies one more WMA. But instead of using a fixed number, it uses the square root of the original period. For our 16-period HMA, the square root is 4, so a final 4-period WMA is applied to the data.
This last touch is what gives the HMA its signature look. It filters out the insignificant market chatter without re-introducing all the lag we just worked so hard to remove. The final output is the Hull Moving Average line: an indicator that’s both exceptionally fast and remarkably smooth.
If you want to go even deeper, our guide on how to calculate moving averages for trading is a great next step. But this three-part construction is precisely what makes the HMA such a powerful tool for modern traders.
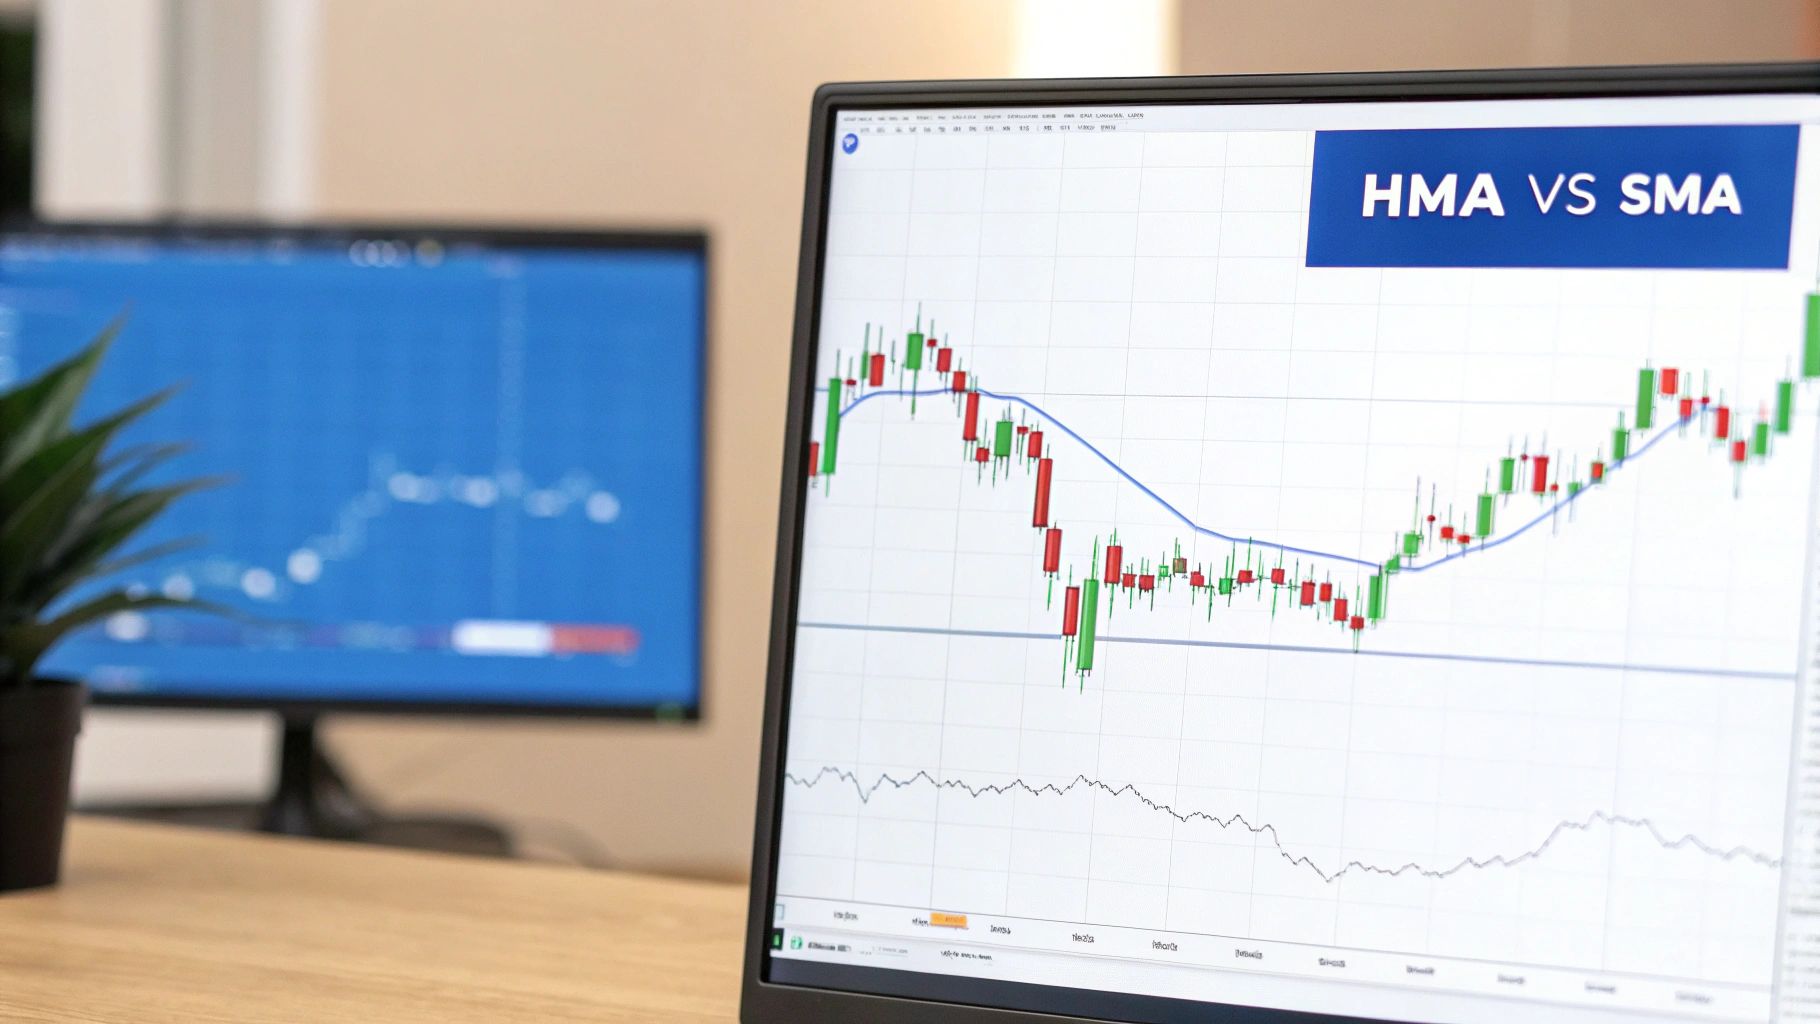
HMA vs. SMA and EMA: A Visual Comparison on the Charts
Reading about the Hull Moving Average is one thing, but seeing it in action on a live chart is where the lightbulb really goes on. When you plot the HMA next to its older cousins—the Simple Moving Average (SMA) and Exponential Moving Average (EMA)—the difference is impossible to ignore. The visual proof speaks for itself, showing exactly how the HMA gives traders a much cleaner, more immediate read on what the market is doing.
This side-by-side view highlights the practical edge the HMA’s unique formula provides. You can see right away how it hugs the price action, a direct result of its clever design to cut down on lag. This isn't just a tiny tweak; it fundamentally changes how you see trend strength and, more importantly, how you time your trades.
Let's walk through how each indicator stacks up in three common market conditions to really understand their pros and cons.
Performance in a Strong Trending Market
During a powerful, sustained run—either up or down—the lag becomes painfully obvious. An SMA, with its slow and steady calculation, often drifts far behind the current price. It's smooth, sure, but that massive gap means your trend confirmation comes way too late, and you’ve likely missed a huge chunk of the move.
The EMA does a little better by putting more emphasis on recent prices, which pulls it closer to the action. Still, there’s a noticeable delay. The Hull Moving Average, on the other hand, moves almost in perfect sync with the price candles. This tight tracking gives traders a few key advantages:
- Enter Trends Earlier: The HMA will pivot up or down much faster than an SMA or EMA, giving you one of the earliest signs that a new trend might be taking hold.
- Confirm Trend Strength: In a solid trend, the price will ride consistently on one side of the HMA, offering clear, ongoing confirmation that the move has legs.
- Ride Trends Longer: The HMA works like a dynamic support or resistance level that’s actually relevant to the current price, making it a far better guide for trailing a stop-loss.
Navigating a Sharp Market Reversal
This is where the HMA really earns its keep. In those sudden, V-shaped reversals, slower moving averages just get left in the dust. When a market abruptly flips, an SMA can take several bars just to flatten out, let alone cross over. That extreme lag makes it almost worthless for catching the new trend anywhere near the bottom or top.
The EMA reacts quicker than the SMA, but you can still be left waiting for a signal while the new trend is already well underway. The HMA, however, will often turn on a dime, right along with the price. Its responsiveness gives you a signal to get out of your old position—and maybe into a new one—much, much faster.
The HMA's ability to swiftly change direction during a reversal is its biggest superpower. While other moving averages are still chewing on old data, the HMA is already reflecting the new market reality, giving you a critical timing advantage.
The Challenge of a Choppy, Sideways Market
Of course, no indicator is a silver bullet. The HMA's greatest strength—its incredible responsiveness—can become its biggest liability in a choppy, range-bound market. When the price is just bouncing around without any real direction, the HMA's sensitivity can trigger a flurry of false signals, known as whipsaws.
Because it follows the price so tightly, it will spit out constant buy and sell signals as the price pinballs inside the range. Funnily enough, this is where the slow, plodding nature of an SMA can actually be helpful. It will often slice right through the noise and stay flat, correctly telling you that there’s no trend to trade. This is exactly why the Hull Moving Average is best used alongside other tools that help you figure out if the market is trending or just stuck in the mud.
HMA vs Traditional Moving Averages: A Feature Comparison
To make the choice clearer, here’s a direct comparison of the key characteristics of the Hull Moving Average against other common MAs. This table can help you quickly decide which tool is the right fit for your trading style and the current market environment.
| Feature | Hull Moving Average (HMA) | Simple Moving Average (SMA) | Exponential Moving Average (EMA) | Weighted Moving Average (WMA) |
|---|---|---|---|---|
| Responsiveness | Extremely high; minimal lag | Very low; significant lag | Medium; faster than SMA but still lags | High; faster than EMA but less smooth |
| Smoothing | Excellent; very smooth despite its responsiveness | Excellent; the smoothest of all MAs | Good; smoother than price but can be choppy | Fair; can be jagged due to linear weighting |
| Best For | Trend identification, timing entries/exits in trending markets | Identifying long-term trends, filtering out market noise | General trend following, balancing responsiveness and smoothing | Short-term signals where recent price is most important |
| Biggest Drawback | Prone to false signals (whipsaws) in sideways markets | Very slow to react to price changes | Can still produce whipsaws and lag during sharp reversals | Can be overly sensitive to the most recent candle |
| Calculation | Weighted average of two different WMAs to reduce lag | Simple arithmetic average of past prices | Exponentially weighted, giving more importance to recent prices | Linearly weighted, giving more importance to recent prices |
Ultimately, the HMA is a specialized tool built for speed and accuracy in trending conditions. While traditional MAs like the SMA and EMA offer stability and are great for filtering noise, they come at the cost of significant lag. The HMA flips that trade-off, giving you a sharper view of the market's immediate intentions.
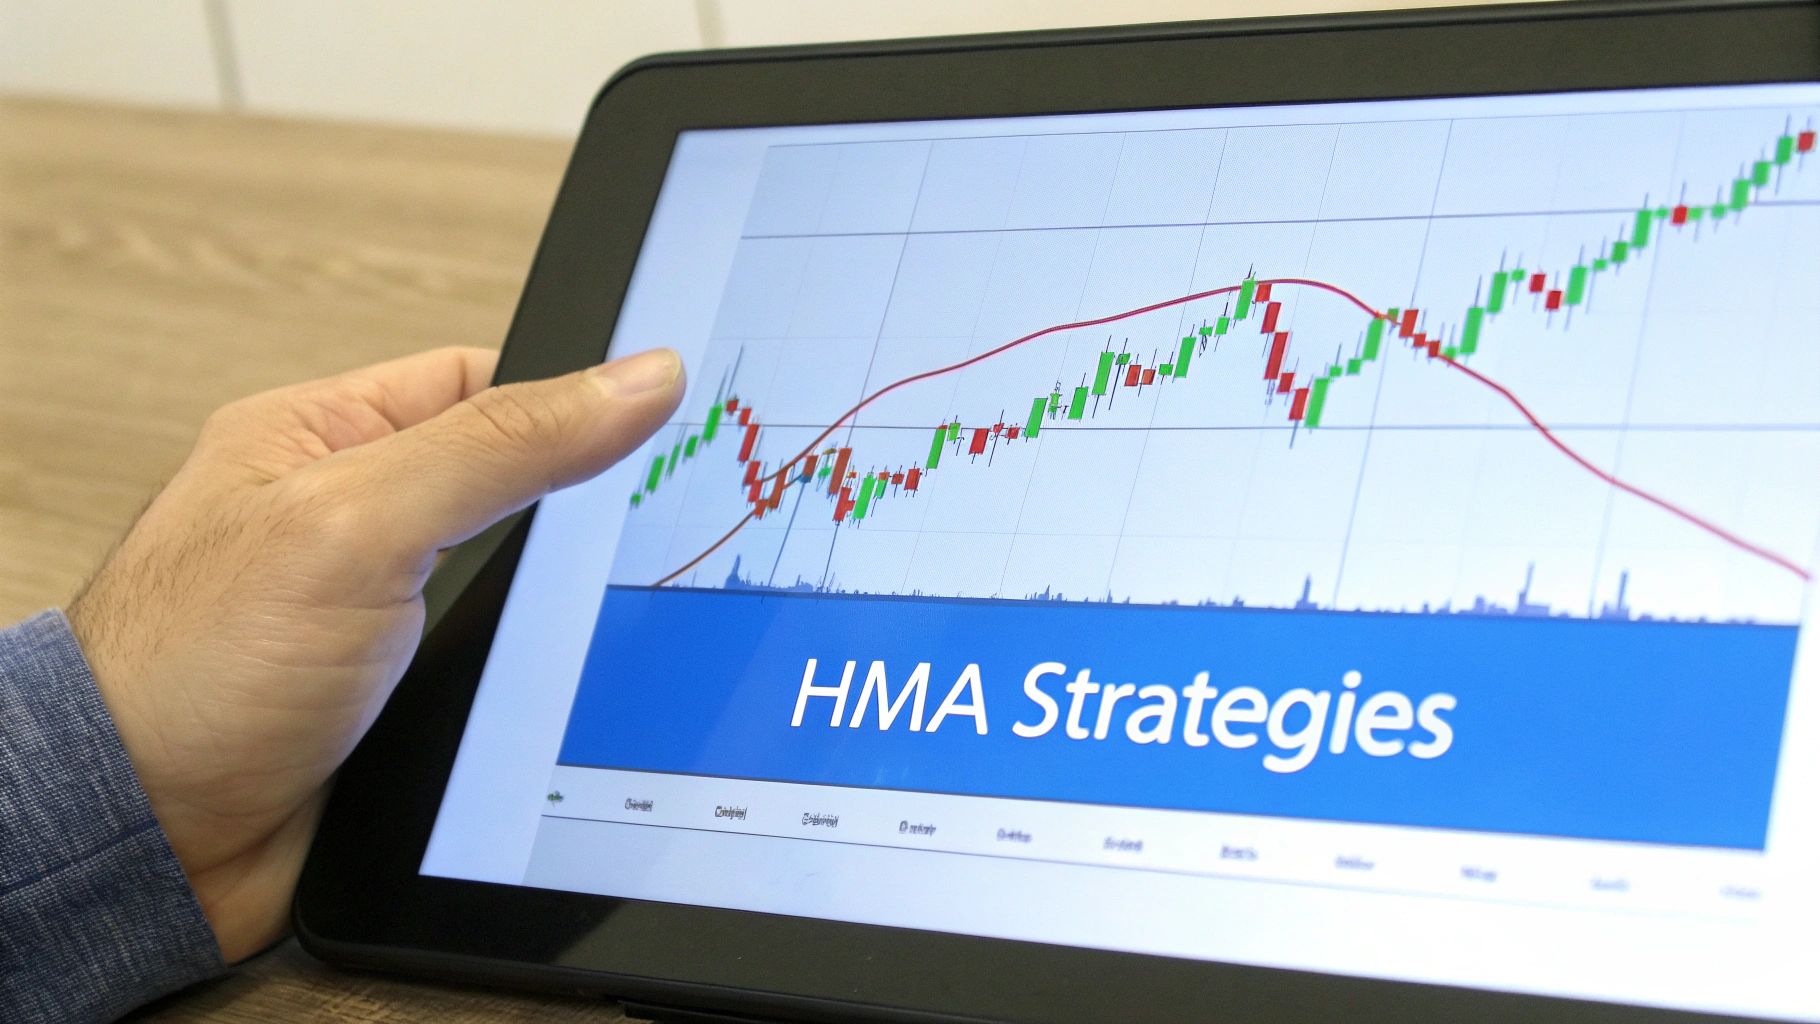
Actionable Trading Strategies Using the HMA
Knowing how the Hull Moving Average works is one thing, but turning that knowledge into a real trading plan is where the magic happens. The HMA’s combination of speed and smoothness makes it a fantastic foundation for a few practical strategies. We'll walk through two of the most popular and effective approaches you can start testing right away.
These aren't just vague ideas; they're designed to give you clear, rules-based signals for getting in and out of trades. When you have specific conditions for every action, you take the guesswork and emotion out of the equation. Whether you’re a die-hard trend follower or you prefer the clean signals of a crossover system, the HMA is flexible enough to fit your style.
Let's dive into how you can read the HMA's signals for trend following and how to build a solid crossover system with it. I'll lay out clear guidelines for each approach so you can start putting them into practice.
Strategy 1: The Trend Following Method
The simplest and most direct way to use the Hull Moving Average is as a guide for trend direction. Because it hugs the price so tightly, the angle of its slope gives you an instant, high-fidelity read on the market’s momentum. This strategy is all about getting your trades on the right side of the dominant market force.
The rules couldn't be more straightforward. In fact, many charting platforms make it even easier by color-coding the HMA line—often green when it's rising and red when it's falling.
- Bullish Signal (Buy): A buy signal pops up when the HMA’s slope flips from flat or down to up. On your chart, you'll see the line start to angle upwards, usually changing from red to green. The entry is typically taken once a candle closes above the rising HMA.
- Bearish Signal (Sell): A sell or short signal happens when the HMA’s slope turns from positive to negative. The line will begin to point down, changing from green to red. You'd enter the trade as the price closes below the falling HMA.
The core idea is beautifully simple: trade in the direction of the HMA's slope. When the HMA is climbing, you should only be looking for long trades. When it's falling, you should only be thinking about shorting. This single rule is a powerful filter against low-probability counter-trend trades.
Just a heads up: this strategy really shines in markets that are clearly trending. You'll get your cleanest signals when there's a sustained move in one direction. In choppy, sideways markets, the constant slope changes can lead to a lot of false signals, or "whipsaws." It's a good idea to pair this approach with another indicator that can confirm a trend is actually in place.
Strategy 2: The HMA Crossover System
For traders who like more definitive entry and exit points, an HMA crossover system is an excellent choice. This strategy uses two Hull Moving Averages with different settings—a "fast" one and a "slow" one. When they cross over each other, you get a signal. It’s a classic moving average strategy, but supercharged with the HMA's responsiveness.
A common setup that works well is a 21-period HMA (fast) and a 50-period HMA (slow). The fast HMA reacts quickly to recent price moves, while the slow HMA gives you a sense of the bigger, underlying trend. The signals come from how these two lines interact.
Here are the rules for the crossover strategy:
- Buy Signal: A long entry is triggered when the fast HMA (21) crosses above the slow HMA (50). This tells you that short-term momentum is shifting to the upside and is now stronger than the longer-term trend.
- Sell Signal: A short entry is triggered when the fast HMA (21) crosses below the slow HMA (50). This signals that short-term momentum has flipped bearish and is now overpowering the longer-term trend.
This dual-HMA system helps filter out some of the noise a single HMA might pick up on its own. A crossover confirms that a potential new trend has enough juice to pull both the short-term and long-term averages into alignment. For a deeper dive into similar approaches, you can master the moving averages crossover strategy for profitable trading in our detailed guide.
Managing Your Trades
A great entry signal is worthless without a plan for managing your trade. No matter which HMA strategy you choose, having clear rules for your entry, stop-loss, and exit is non-negotiable if you want to be successful in the long run.
- Setting a Stop-Loss: For the trend-following method, a logical place for a stop-loss is just below a recent swing low for a long trade, or just above a recent swing high for a short. For the crossover system, you could place your stop just on the other side of the slow HMA line.
- Taking Profits: You can set profit targets using a fixed risk-to-reward ratio (like 2:1 or 3:1), or you can trail your stop-loss behind the HMA. This lets you ride a strong trend for as long as it runs, only getting out when the signal finally reverses.
Avoiding Common Pitfalls When Trading with the HMA
The Hull Moving Average is an exceptionally sharp tool, but like any high-performance instrument, you have to use it with care and a healthy respect for its limitations. Its greatest strength—incredible responsiveness—can quickly become its biggest weakness if you're not careful. Mastering the HMA isn't just about knowing when to jump in, but more importantly, when to sit on your hands.
This speed means the HMA can fire off a flurry of false signals, a headache traders call whipsaws, especially when the market is just drifting sideways. In these choppy, range-bound conditions, the price bounces around without any real direction. The HMA, doing its job, will dutifully flip up and down with every minor twitch, signaling trades that are destined to go nowhere fast.

If you blindly act on every HMA crossover in a sideways market, you’re setting yourself up for a series of small, frustrating losses that can quickly drain your account. The key to staying in the game is learning how to filter out all that market noise.
Filtering Out the Noise with Confirmation Tools
The single most effective way to sidestep HMA whipsaws is to never use it in isolation. It was built to follow trends, so its signals only really mean something when a clear trend is actually in motion. You need a second opinion—another indicator to act as a "trend filter"—to confirm that market conditions are right for an HMA-based trade.
Here are a few proven tools to pair with your HMA:
-
Average Directional Index (ADX): The ADX is built for one job: to measure the strength of a trend, not its direction. A solid rule of thumb is to only consider HMA signals when the ADX is above 25. If it’s lurking below that level, the market is likely consolidating, and you should probably ignore what the HMA is telling you.
-
Momentum Oscillators (RSI or Stochastic): An oscillator like the Relative Strength Index (RSI) helps confirm that momentum is on your side. For a long signal, you could look for the HMA to turn up while the RSI is also above 50. For a short, you'd want the HMA to point down while the RSI is below 50.
-
Longer-Term Moving Averages: Using a much slower moving average, like a 200-period SMA or EMA, gives you a bird's-eye view of the primary trend. The rule is simple: only take long HMA signals when the price is trading above the 200-period MA, and only consider shorts when it's below.
The golden rule for trading with the HMA is simple: Confirm, then commit. Always wait for a secondary indicator to validate the market environment before acting on an HMA signal. This discipline is what separates consistently profitable traders from those who get chopped up by market noise.
The Critical Role of Backtesting
Finally, one of the biggest traps you can fall into is assuming an HMA strategy will work on any asset or timeframe without checking first. Every market has its own personality. A 21-period HMA might work beautifully on a daily Apple chart but fail miserably on a 5-minute EUR/USD chart. The only way to know for sure is through rigorous backtesting.
In fact, quantitative studies of the Hull Moving Average show just how varied the results can be. Some backtested strategies with short HMA periods have shown positive annual returns between 4-8%. But other setups led to terrifying drawdowns exceeding 70%, all depending on the market and the settings used. These numbers prove that profitability isn't about the indicator itself, but how you combine it with solid risk management and other filters. You can dig into more of these performance details in this comprehensive HMA strategy analysis.
Backtesting your exact strategy on historical data lets you:
- Optimize Your Settings: Dial in the HMA period that actually works best for your chosen asset and timeframe.
- Understand Performance Metrics: Get a real look at your strategy's historical win rate, average profit, and maximum drawdown.
- Build Confidence: Trading a system you've tested and validated yourself is a game-changer. It helps remove the fear and hesitation that can sabotage your execution.
By pairing the HMA with solid confirmation tools and thoroughly backtesting your approach, you can navigate its pitfalls and unlock its true potential as a powerful trend-spotting indicator.
Got Questions About the Hull Moving Average?
Once you start using the Hull Moving Average, you're bound to have a few questions. It’s a powerful tool, but like any indicator, it has its quirks. This is where we'll tackle the most common things traders ask, giving you straight, practical answers to help you use the HMA smartly and sidestep those costly beginner mistakes.
We’ll cover everything from dialing in the right settings for your trading style to whether it even works in the wild west of crypto. Each answer is designed to build on what you've already learned, making sure you walk away with a solid, actionable plan.
What Are the Best Settings for the Hull Moving Average?
There’s no magic number here. The "best" setting is always going to depend on your strategy and the chart you're looking at. Anyone telling you there's a one-size-fits-all period is selling you a fantasy. The real key is matching the indicator's sensitivity to what you're trying to accomplish.
Swing traders working off daily charts, for example, often lean towards longer periods like 50 or 100. Why? Because it helps them stay in major, multi-week trends without getting spooked by minor pullbacks.
On the other hand, a day trader staring at a 5-minute chart needs speed. They might go for something like 16 or 21 to catch quick intraday moves. A popular starting point for many is 21, since it roughly lines up with a month of trading days. At the end of the day, the only way to find your sweet spot is to backtest different settings on your asset and timeframe. Stop searching for a holy grail number and start testing.
Can I Use the Hull Moving Average as a Standalone Indicator?
Honestly, trying to trade with just the HMA is a recipe for disaster. I strongly advise against it. Its biggest strength—its incredible sensitivity to price changes—becomes a massive weakness in choppy, sideways markets. In those conditions, it will spit out a relentless stream of false signals, chopping up your account. You absolutely need a filter to tell you when the market is actually trending.
Don't just take my word for it. Despite being built for speed, backtests on major stocks show pretty mixed results when the HMA is used on its own. One deep-dive study looked at eight years of daily data for 30 Dow Jones stocks. The result? Strategies trading solely on HMA signals had a win rate of only about 17%. That means these trades beat a simple buy-and-hold strategy just 17% of the time, leading to an 83% underperformance when used in isolation. You can learn more about these HMA performance findings yourself.
Always pair the HMA with other tools to build a complete trading system. Use an indicator like the ADX to confirm the trend has legs, or look at the RSI to see if momentum is on your side. This kind of confluence is what filters out the noise and dramatically stacks the odds in your favor.
Is the HMA Effective in All Markets Like Crypto and Forex?
Absolutely. The HMA is a versatile beast that works on any market you can chart—stocks, forex, commodities, and even the high-octane world of crypto. The math is based purely on price, so its core principles of tracking trend and momentum are universal. It works the same whether you’re analyzing Bitcoin or a blue-chip stock.
The catch? You’ll often need to tweak its settings based on the personality of the asset you’re trading. A notoriously volatile market like crypto might need a different HMA period to smooth out the noise compared to a slow-and-steady utility stock. The behavior of the asset tells you how to tune your tools.
The bottom line is simple: always test and adapt your strategy for the market you're in. A setup that prints money on one chart might need a few adjustments to work on another. This optimization process is what separates serious traders from the rest.
Ready to put this all into practice? ChartsWatcher gives you the powerful scanning, backtesting, and charting tools you need to build and validate your own Hull Moving Average strategies. Stop guessing and start trading with data-driven confidence. Explore our features and start your free trial today at ChartsWatcher.com.
