A Trader's Guide to the Gap and Go Strategy
If you've spent any time in day trading circles, you've probably heard of the "gap and go strategy." It’s a classic momentum play that revolves around stocks opening significantly higher or lower than where they closed the previous day. The idea is to spot these "gaps," which are usually fueled by some overnight news, and "go" with the momentum—buying gappers and shorting losers—right after the opening bell.
What a Gap Trade Really Looks Like
Before you jump in, you have to get what's happening behind the scenes. At its core, this strategy is all about that empty space on the chart between one day's close and the next day's open. These aren't just random graphical glitches; they’re the direct result of powerful overnight catalysts.
Think about what happens when the market is asleep. Companies drop earnings reports, the FDA announces clinical trial results, and major economic news breaks. All this information builds up a ton of buying or selling pressure, causing a stock's value to shift dramatically before the opening bell even rings. That gap you see on the chart? That's the market's first, gut reaction to the news.
Knowing Your Gaps Is Half the Battle
A huge mistake I see traders make is treating every gap the same. Trust me, the ability to tell different gap types apart is your most important filter for finding a setup with a real edge. Not all gaps are created equal, and knowing the difference helps you weed out the noise and focus on real opportunities.
To help you get started, I've put together a quick rundown of the main gap types you'll run into. Understanding these will give you a much better sense of whether you're looking at a genuine opportunity or a potential trap.
Quick Guide to Market Gap Types
| Gap Type | Common Cause | Likely Price Action |
|---|---|---|
| Breakaway Gaps | Major news (earnings surprise, buyout, FDA approval) on high volume. | Strong momentum. These gaps often kick off a new, powerful trend and are less likely to get filled quickly. |
| Continuation Gaps | Positive or negative news that reinforces an existing trend. | Also called "runaway gaps." They signal the current trend is still very much alive and likely to keep going. |
| Common Gaps | No significant news, often on low volume. | The most frequent and least reliable. Usually just minor price adjustments that tend to get "filled" the same day. |
| Exhaustion Gaps | Occurs after a long, sustained price run, often on a final surge of volume. | Signals the potential end of a trend. The last of the buyers (or sellers) are in, setting the stage for a reversal. |
As you can see, the "why" behind the gap is just as important as the gap itself. It's the story that gives the price action its meaning.
Key Takeaway: The context behind the gap is everything. A stock gapping up on record-breaking earnings is a fundamentally different setup than one gapping up on low volume with no apparent news.
Catalysts and Volume Tell the Real Story
The strength of the news catalyst is directly tied to how well a gap and go trade might work out. A massive earnings beat is a far better reason for a gap than a minor analyst upgrade. This is where a little bit of homework goes a long way.
The "Gap and Go" strategy is built on finding stocks that have gapped significantly and betting that momentum will carry them further. Backtesting shows that some gaps, especially breakaway gaps fueled by big news, are much better predictors of continued price movement. On the other hand, common gaps are far more likely to reverse and get filled during the day. If you're curious about the data, you can look into the performance of various setups with a gap fill trading strategy.
Alright, let's get down to business. Now that you have a good sense of what a high-quality gap looks like, it's time to put that knowledge into practice. We need a way to find these opportunities systematically, and for that, a well-built pre-market scanner is your most critical tool. It's the only way to sift through the noise and get a clean, actionable watchlist before the market even opens.
I’m going to walk you through the exact scanner settings I use every single day. These aren’t just random numbers; they’re the result of years of trial and error, specifically designed to pinpoint stocks with real liquidity, strong momentum, and a lower chance of giving you a headache with erratic moves.
This is the first, most crucial step in the whole process: spotting the gapped-up stocks that are actually worth your time.
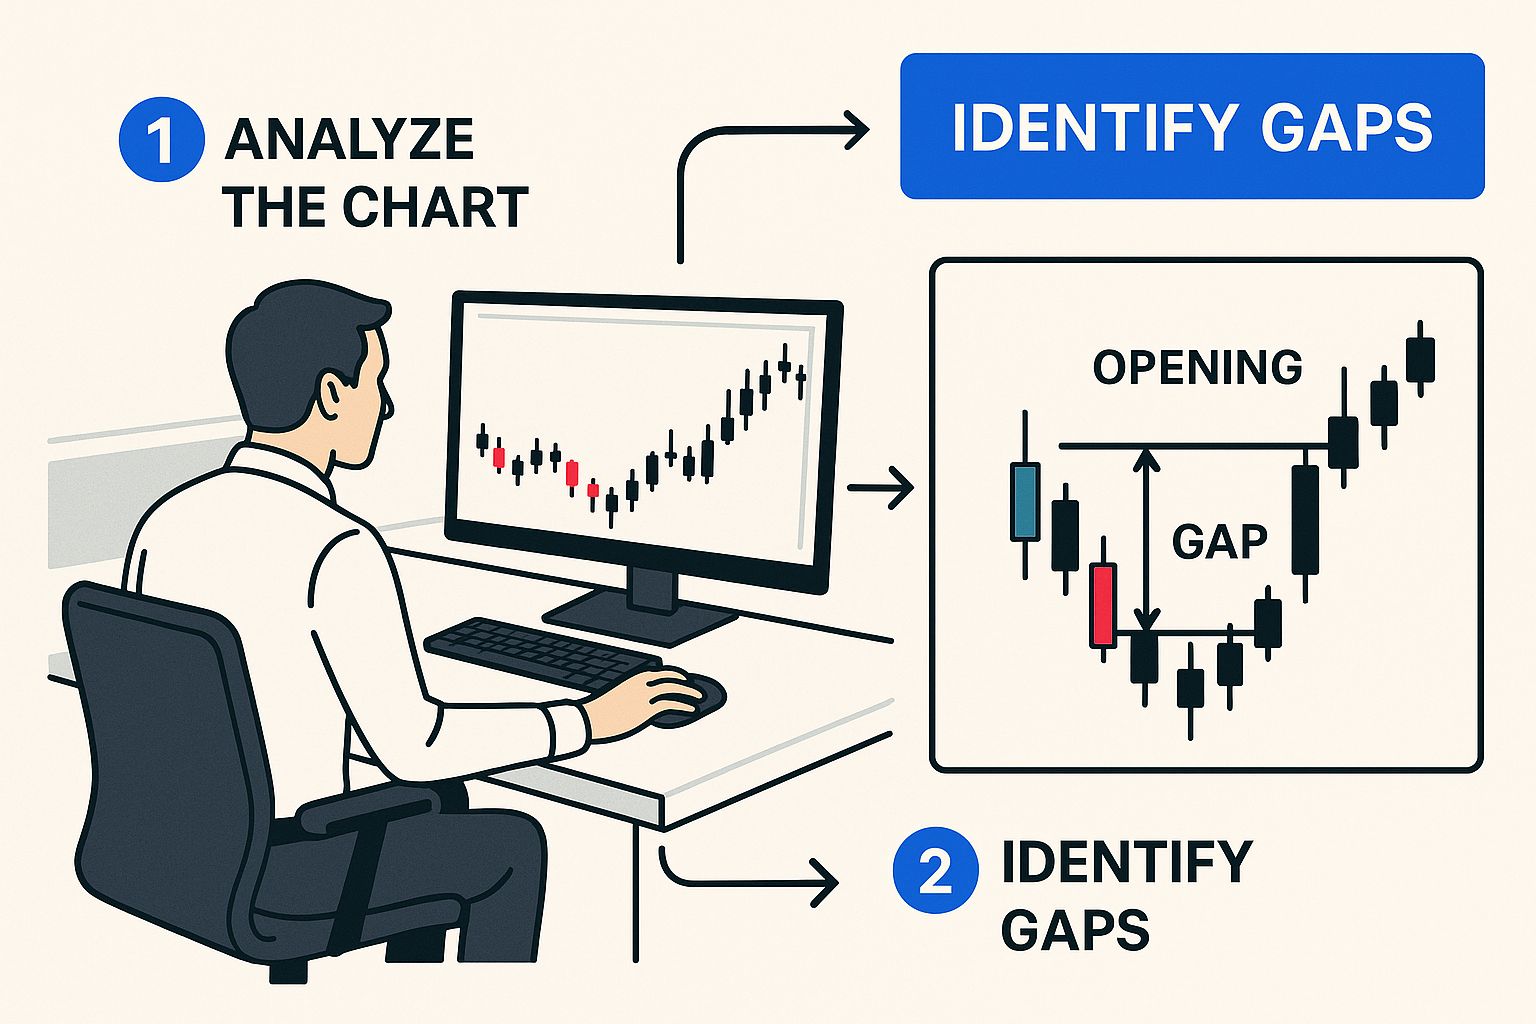
The image above perfectly illustrates what we're after—a clean chart with a distinct gap. Our scanner's job is to deliver these directly to us, every single morning.
Dialing in Your Scanner Filters
The whole point of the scanner is to find stocks that have both a meaningful price gap and serious pre-market interest. Each filter we add is another layer of quality control, getting us closer to the ideal setup.
Here are my core scanner settings. I've tweaked these over countless trading sessions to weed out the junk and focus only on stocks with the best shot at a clean opening drive.
Scanner Filter Breakdown
| Filter | My Setting | The "Why" Behind It |
|---|---|---|
| Price | Over $5 | This one is simple. It gets rid of most penny stocks, which are notorious for manipulation and chaotic price action. Stocks over $5 generally behave more predictably and attract a better class of traders. |
| Pre-Market Volume | Over 100,000 shares | Liquidity is non-negotiable. A stock has to have at least this much volume to prove you can get in and out without massive slippage. It’s also a bright, flashing sign that other traders have their eyes on it. |
| Gap Percentage | At least +3% | Anything less than a 3% gap often doesn't have the urgency needed for a powerful opening move. This filter ensures you’re looking at stocks that are making a genuinely significant move fueled by a real catalyst. |
| Relative Volume (RV) | At least 2.0 | This is a huge one. It means the stock is trading at twice its normal pre-market volume for that time of day. High relative volume is one of the strongest clues that the interest is unusual and something big might be happening. |
This configuration is a battle-tested foundation for any serious gap trader. You can always adjust them later based on market conditions or your own risk appetite, but this is the place to start.
Putting It All Together in ChartsWatcher
Now, let's make this real. Using a platform like ChartsWatcher is perfect because its customization options let us build exactly what we need. You can plug these criteria directly into the scanner to create a dynamic window that feeds you potential plays in real-time.
In the tool, you'd set up your filters to look for:
- Last Price: > 5.00
- Pre-Market Volume: > 100000
- Gap %: > 3
- Relative Volume (Pre-Mkt): > 2.0
A great scanner doesn't just find stocks; it eliminates bad decisions for you. By the time a ticker hits your list, it has already passed your most important tests. Your job isn't to search anymore—it's to analyze.
This setup does the heavy lifting, sorting through the entire market to hand you a short, manageable list of stocks that fit your strategy. This frees up your brainpower to focus on what matters: digging into the news catalyst, analyzing the chart, and crafting your trade plan. If you want to build your own, you can learn more about creating a customized stock scanner and implement these filters yourself.
Crafting a Rules-Based Framework for Your Trades
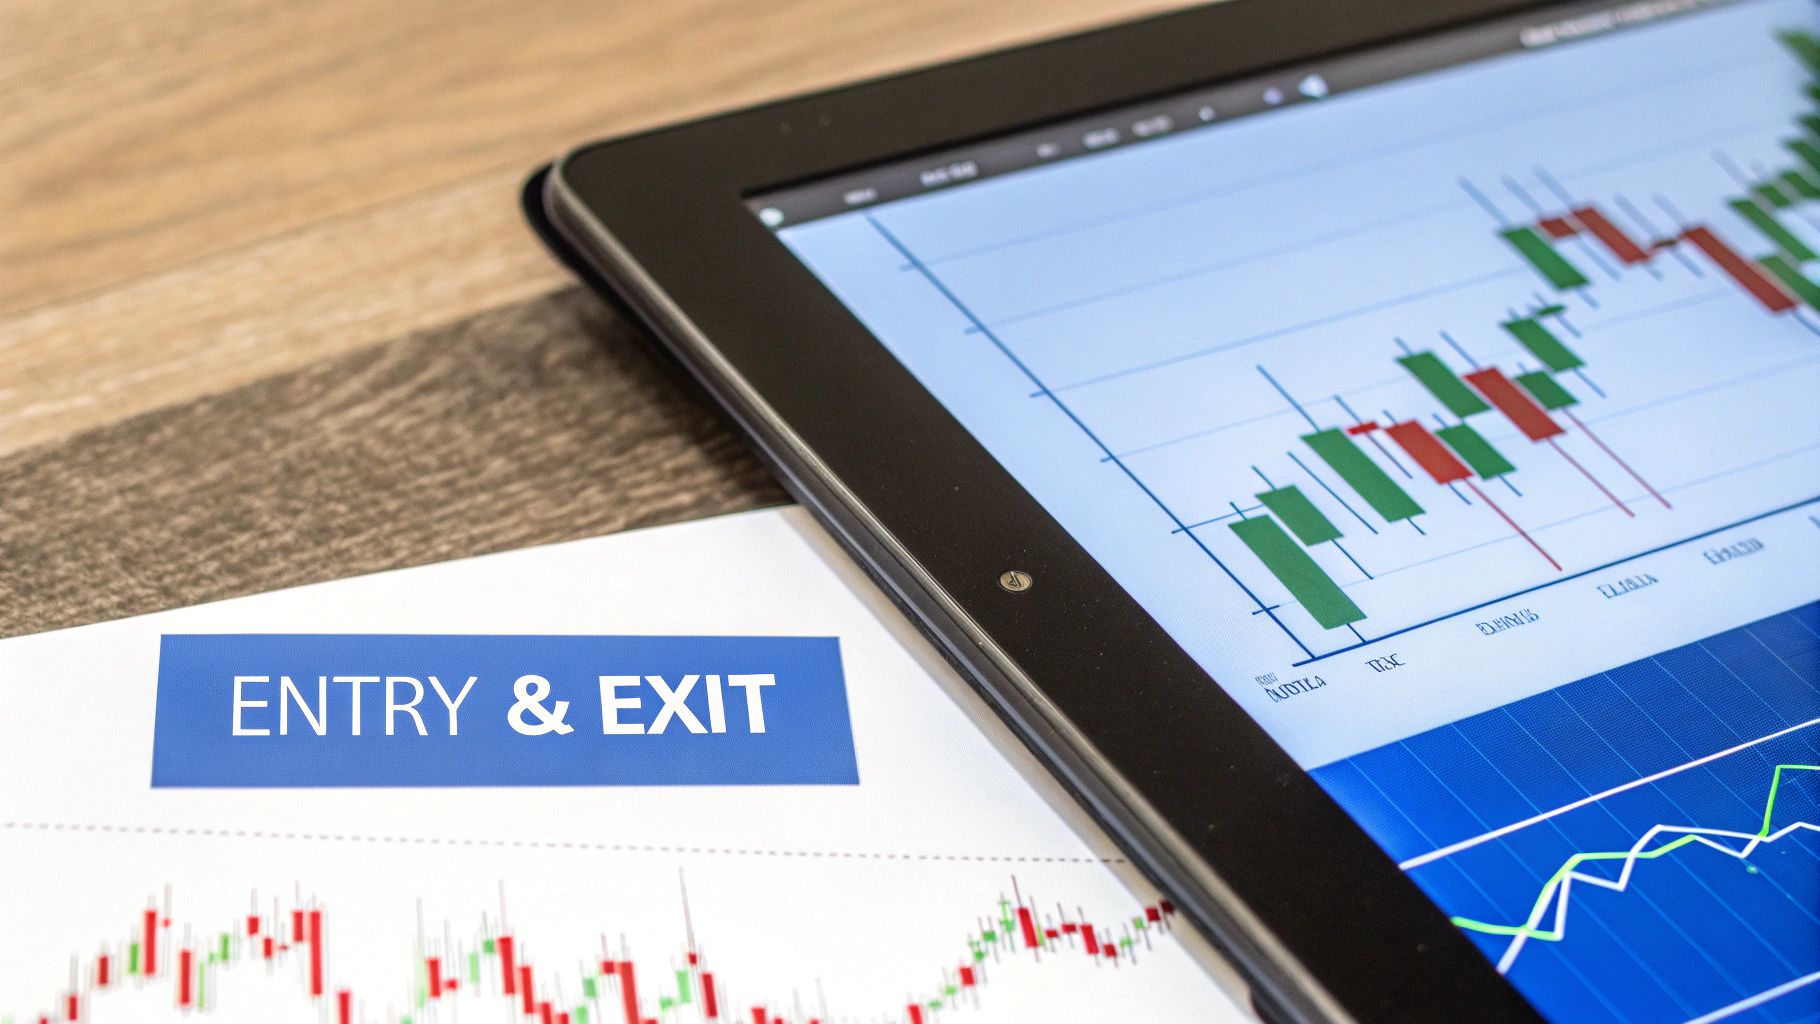
Spotting a promising stock with your pre-market scanner is a great start, but it's only half the battle. The real money is made or lost in the execution—how you get in and how you get out. This is where a rock-solid, rules-based framework comes in. It’s what separates traders who build consistency from those who just ride an emotional rollercoaster. The whole point is to take your feelings out of the equation.
Discipline is everything. The gap and go strategy moves fast, and decisions need to be made in seconds, not minutes. If you don't have a plan before the bell rings, you're setting yourself up to hesitate, chase a stock that's already run too far, or worse, hold onto a loser hoping it will turn around. My entire approach is built on specific, non-negotiable triggers for both entering and exiting a trade.
Pinpointing Your Entry Trigger
That moment right after the 9:30 AM ET open can be pure chaos. Here’s my number one rule: I never buy right at the opening bell. I always wait for confirmation that the initial momentum is real and has legitimate buying pressure behind it.
My go-to entry trigger is all about the first 5-minute candle. This is the specific condition I’m watching for:
- The Entry Signal: The body of that first 5-minute candle has to close decisively above the pre-market high.
This simple rule does two critical things. First, it helps me sidestep those nasty "opening traps" where a stock spikes at the open only to immediately tank. Second, seeing a close above the pre-market high is a powerful confirmation that buyers have stepped in, absorbed any initial selling, and are now in control.
A patient entry is a high-probability entry. When you wait for the market to show its hand, you stop speculating on what might happen and start reacting to what is happening.
Let’s walk through a real-world scenario. Say stock XYZ has gapped up and set a pre-market high of $55. The market opens, and it dips a bit to $54. Instead of getting shaken out or chasing it, you just wait. At 9:35 AM, that first 5-minute candle closes at $55.50. That close above the $55 pre-market high is your signal. That's when you hit the buy button.
Defining Your Exit Plan Before You Even Enter
Your exit strategy is just as crucial as your entry—I’d argue it’s even more important. Every single trade needs a clear plan for taking profits and cutting losses before you ever risk a dime. For me, this is non-negotiable. It's how I protect my capital.
My exit plan always has two parts: a profit target and a stop-loss.
1. Setting a Sensible Profit Target Your profit target shouldn't be some random percentage you pull out of thin air. It needs to be based on actual technical levels on the daily chart. I'm always looking for the next major area of resistance—it could be a prior day's high, a key moving average, or an old pivot point. This grounds your target in reality, not hope.
2. Establishing Your Stop-Loss My stop-loss is just as methodical. If I'm going long after a break of the pre-market high, my initial stop-loss goes just below the low of that first 5-minute entry candle. It’s simple, clean, and defines my risk on the trade from the outset.
The Power of a 2-to-1 Risk/Reward Ratio
The final piece of this puzzle is my strict adherence to a 2:1 risk/reward ratio. This is the mathematical edge that keeps you in the game. It means that for every $1 I’m willing to risk, my potential profit target needs to be at least $2. With this ratio, you don't even need to be right all the time to be profitable.
Let's go back to our XYZ trade to see how this all fits together.
- Entry: $55.50 (right after the 5-min candle closed above the pre-market high).
- Stop-Loss: We'll place it just below the low of that 5-minute candle, let's say at $54.50. This makes our risk exactly $1.00 per share.
- Profit Target: To get our 2:1 ratio, the target needs to be $2.00 above our entry. So, we set our target at $57.50 ($55.50 entry + $2.00 profit).
Before I take that trade, I’ll glance at the daily chart. If I see a clear resistance level sitting at or very near $57.50, then the trade is a go. But if the next major resistance is only at $56, the risk/reward just isn't there (that's only a 1:2 risk to reward). I’d pass on the trade, no matter how good the setup looks. That kind of discipline is what protects your account over the long haul.
Don't Go Broke: Practical Risk Management for the Gap and Go
Let's be real for a second. You can have the most profitable trading strategy in the world, but it's worthless if you don't survive long enough to actually use it. When you're trading something as fast as the gap and go, risk management isn't just a "nice-to-have"—it's the only thing standing between you and a blown-up account.
The speed of these trades means you absolutely must have your rules locked in before you even think about hitting the buy button. This isn't about gut feelings or guesswork. It's about a disciplined, systematic approach to protecting your capital that keeps you in the game day after day.
I'll walk you through my personal framework, which boils down to two core pillars: setting an unbreakable stop-loss on every single trade and calculating your position size with mathematical precision. These two rules work hand-in-hand to make sure no single bad trade can ever knock you out of the market.
Your Stop-Loss Is a Non-Negotiable Contract
This is the one rule you can never, ever break. Every trade gets a hard stop-loss. Period. Without it, you’re just gambling. The stop-loss is your pre-defined escape hatch if the trade goes sour, protecting you from a small mistake turning into a catastrophic loss.
So, where do you put it? A logical and effective spot is just below a key technical level that, if broken, invalidates your entire reason for entering the trade.
In the previous section, we talked about buying after the first 5-minute candle closes above the pre-market high. In that exact scenario, a fantastic place for your stop-loss is just a few cents below the low of that same 5-minute entry candle.
Why there? Because a move below that low tells you the initial burst of buying pressure has failed. The story has changed.
For example, if a stock's 5-minute entry candle has a low of $51.20, I might place my stop-loss at $51.10. This gives the trade a tiny bit of wiggle room but clearly defines my maximum risk.
Risk management is the only part of trading you have 100% control over. You can't control if a stock goes up or down, but you can always control how much you're willing to lose if you're wrong.
Position Sizing: The Secret to Longevity
Once you know where your stop-loss is going, you can figure out the most important number in the entire trade: your position size. This has nothing to do with how many shares you feel like buying. It’s a cold, hard calculation designed to keep your risk identical on every single trade.
The goal is to risk a small, fixed percentage of your total trading capital. A widely accepted and smart rule of thumb is to risk no more than 1% of your account on any one trade. If you have a $30,000 trading account, this means the absolute most you can lose on a single position is $300.
With that number locked in, you can calculate your ideal share size with a simple formula.
Position Sizing Formula
| Step | Calculation | Example |
|---|---|---|
| Determine Max Risk | (Account Size) x (Risk Percentage) | $30,000 x 0.01 = $300 |
| Calculate Risk Per Share | (Entry Price) - (Stop-Loss Price) | $52.00 Entry - $51.10 Stop = $0.90 |
| Calculate Share Size | (Max Risk) / (Risk Per Share) | $300 / $0.90 = 333 shares |
This math ensures that whether your stop-loss is $0.90 away or $2.50 away, your total dollar risk stays the same—$300. This consistency is the key to surviving inevitable losing streaks and keeping your emotions in check.
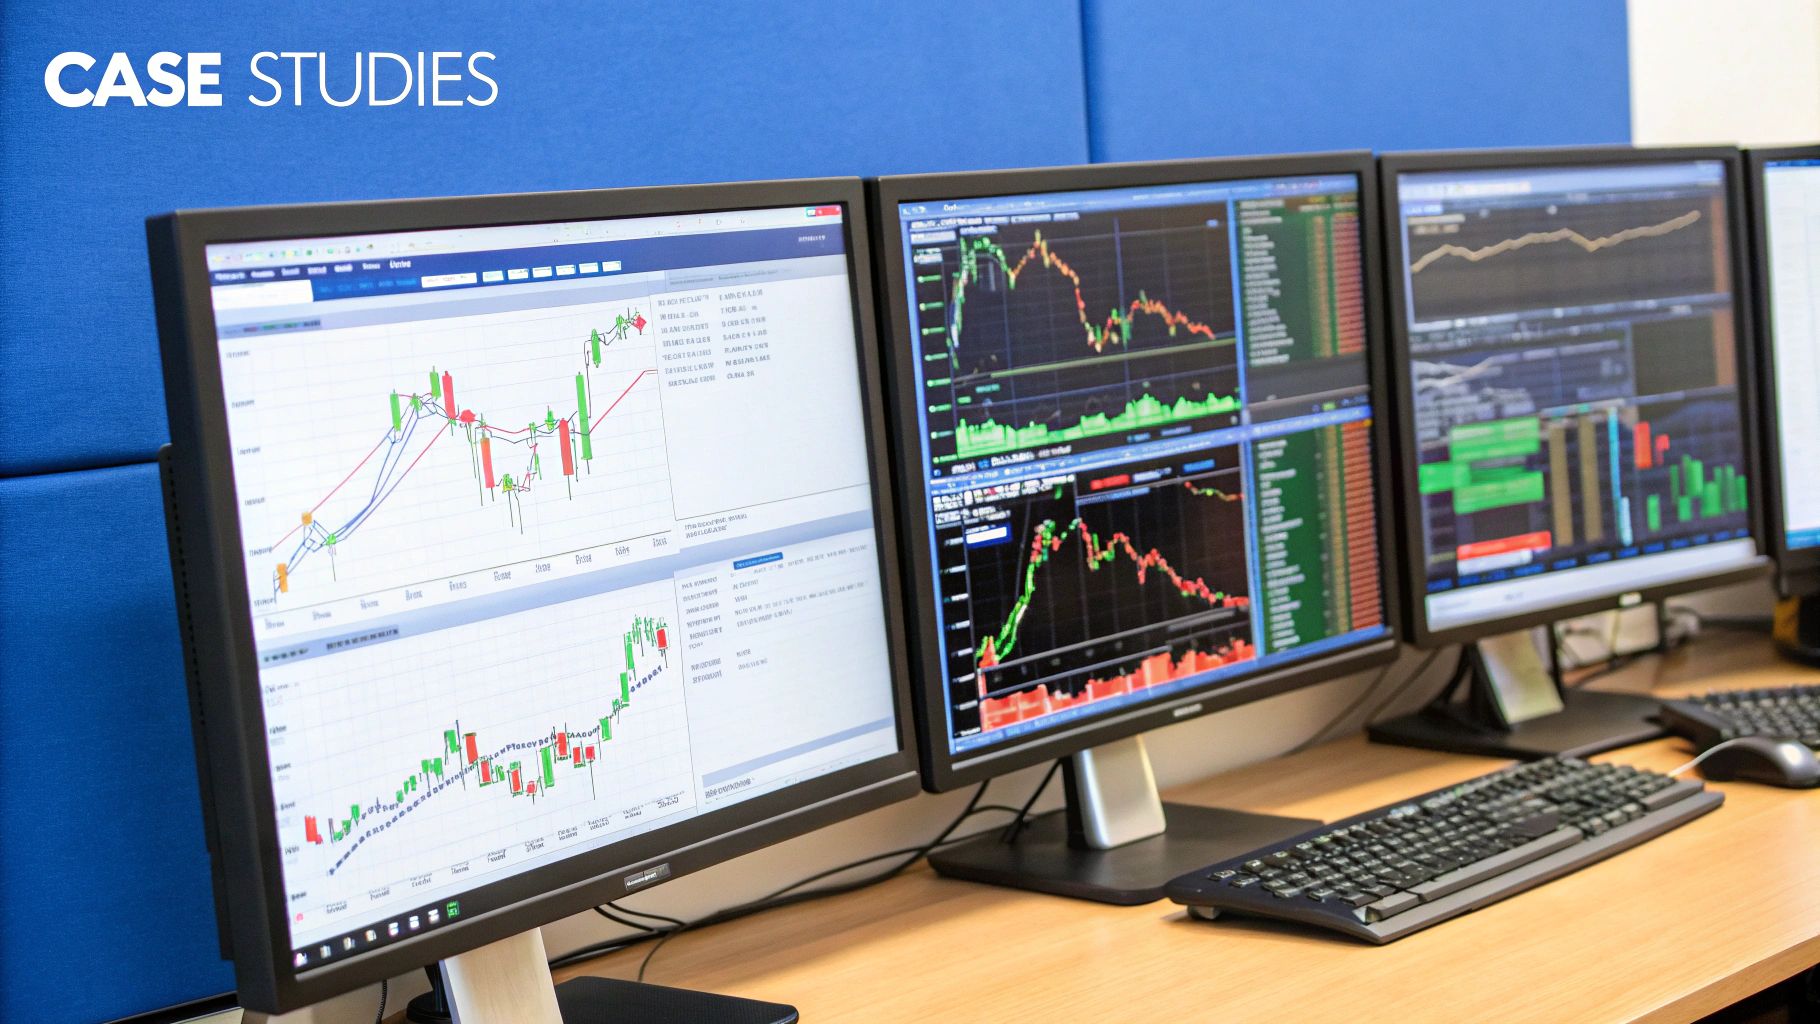
A Practical Walkthrough
Let's tie it all together with a real-world scenario to see how this works from start to finish.
- Account Size: Let's say you have a $50,000 account.
- Your Risk Rule: You're sticking to a 1% risk per trade, which comes out to $500.
- The Setup: A stock has gapped up nicely. Its pre-market high is $75. The first 5-minute candle opens, rallies, and closes at $75.80. The low of that candle was $74.90.
- Your Trade Plan: You decide to enter at $75.80. You'll place your stop-loss at $74.80 (just under the candle's low).
- Calculate Risk Per Share: $75.80 (Entry) - $74.80 (Stop) = $1.00 of risk for every share you buy.
- Determine Position Size: $500 (Max Risk) / $1.00 (Risk Per Share) = 500 shares.
You'd then buy 500 shares at $75.80 and immediately place a stop-loss order to sell at $74.80. Now, no matter what happens next, you know with absolute certainty that the most you can possibly lose on this trade is $500. This is the control that lets professional traders execute their strategies with confidence, day in and day out.
How to Backtest and Refine Your Approach
Confidence in a fast-paced approach like the gap and go strategy doesn’t come from gut feelings. It comes from hard data. Having a set of rules is a great start, but how do you know if those rules actually give you an edge over time? This is where backtesting and diligent record-keeping separate the hopefuls from the profitable.
Think of backtesting as a dress rehearsal for your capital. It’s the process of rewinding the clock, applying your strategy to historical chart data, and seeing how it would have performed. The goal isn't to find a "perfect" system that never loses but to gather the data you need to trust your process when it's time to pull the trigger.
The Manual Backtesting Method
While some platforms offer automated backtesting, I’ve always found tremendous value in rolling up my sleeves and doing it manually. It forces you to look at hundreds, if not thousands, of charts. Over time, this repetition trains your eyes to recognize your specific setups almost instantly.
The process is straightforward. Go back day by day, find every stock that would have appeared on your scanner, and "trade" it based on your exact rules. Did the first 5-minute candle close above the pre-market high? If so, that's a simulated entry. Where would your stop-loss have been? Did the trade hit your 2:1 profit target, or did it stop you out for a loss?
You need to track a few key metrics for every single simulated trade:
- Win Rate: What percentage of your trades were winners?
- Average Win: How much did your winning trades make, on average?
- Average Loss: How much did you lose on an average losing trade?
- Profit Factor: This is your total gross profit divided by your total gross loss. A number above 1.0 means the strategy is profitable on paper.
Processing this historical data is critical. I recommend exporting everything into a spreadsheet to make it easier. If you need a refresher on organizing your findings, you can learn more about how to analyze data in Excel to get the most out of your results. This data-crunching gives you a concrete performance baseline.
Backtesting isn't about predicting the future with 100% certainty. It’s about building a statistical model of your strategy's performance so you can execute with confidence when real money is on the line.
Your Trading Journal: The Ultimate Feedback Loop
Once you have a baseline from backtesting, it’s time to move into forward-testing with a live trading journal. This is non-negotiable. You must document every single trade you take in the live market, win or lose. A detailed journal is the most powerful tool for continuous improvement you'll ever have.
Your journal needs to capture more than just the numbers. Note why you took the trade, what the catalyst was, and the general market conditions that day. Most importantly, log your emotional state. Were you patient? Did you chase the entry? Did you cut a winner short out of fear? Be brutally honest with yourself.
Over time, this journal will reveal your personal patterns—both good and bad. You might discover your gap and go strategy works brilliantly on Thursdays but flops on Mondays. Maybe you have a habit of taking on too much risk after a big win. This kind of feedback is priceless. It lets you make data-driven tweaks, refining your rules based on your own real-world performance. For a deeper dive into the mechanics, our complete playbook for modern traders provides additional insights on how to backtest a trading strategy.
This cycle—backtesting, journaling your live trades, and refining your rules—is what transforms trading from a gamble into a calculated business.
Common Questions About the Gap and Go Strategy
Even with a solid game plan, you're bound to run into new questions once you start trading a strategy in the live market. It's just part of the process. So, let's tackle some of the most common queries I get about the gap and go strategy. My answers are direct and practical, pulled from years of trading this exact setup, to help you navigate these situations with confidence.
What Is the Best Time Frame to Trade the Gap and Go Strategy?
This is a big one, and getting it right is crucial. The gap and go is overwhelmingly a morning strategy, most effective in the first 30 to 60 minutes after the opening bell—that’s 9:30 AM to 10:30 AM ET.
This "golden hour" is when the momentum from any overnight news or catalyst is at its absolute peak. You've got a flood of volume pouring in, which provides the liquidity and directional force you need for the "go" part of the trade.
Can a gapper trend all day? Sometimes. But the explosive, high-probability move usually happens right out of the gate. For actually timing my entries and exits, I live on the lower time frame charts. My go-to setup is a combination of two:
- The 1-Minute Chart: This is for execution. It gives me a real-time, granular view of the order flow and helps me nail my entry right as the stock breaks a key level.
- The 5-Minute Chart: This is for confirmation. Waiting for that first 5-minute candle to form and close gives me a much more reliable signal than just chasing the first few seconds of frantic volatility.
Using these two charts together gives you the best of both worlds: a microscopic view for precise timing and a slightly wider lens for confirming the move has real strength behind it.
How Do I Know if a Gap Will Continue or Fill?
Ah, the million-dollar question. The truth is, there's no magic crystal ball. Instead, it’s about looking for a confluence of factors—a checklist of evidence that stacks the odds in your favor.
Think about it: a stock gapping up on thin volume with no real news behind it is a prime candidate to fail. It’ll probably reverse and fill that gap pretty quickly. These are what traders call "common gaps," and they're best left alone.
The strength of a gap is a story told by multiple characters: the catalyst, the volume, and the opening price action. When all three are telling the same bullish story, you have a high-probability setup.
When I’m sizing up a potential gap trade, I have a mental checklist I run through. A gap is much more likely to continue if it has these things going for it:
- A Powerful Catalyst: Is there a real reason for the gap? I’m talking about a significant earnings beat, a major FDA approval, a buyout offer—something undeniable. This is the fuel.
- High Pre-Market Volume: Is the stock trading heavy volume before the market even opens? I personally look for at least 500,000 shares traded as a baseline. This shows me that big players—the institutions—are interested.
- Convincing Price Action at the Open: This is the final confirmation. When the bell rings, does the stock break its pre-market high with authority? Is it doing so on a surge of opening volume? This is the market screaming that buyers are in control.
If you can check all three of these boxes, your probability of a successful gap and go trade goes way up.
Can This Strategy Work for Stocks That Gap Down?
Absolutely. The logic behind the gap and go strategy is completely symmetrical. A "Gap Down and Go" is just the bearish version of the same trade, and it’s a perfect setup for short-sellers. The thinking is identical, just flipped upside down.
Instead of looking for stocks gapping up, you’d set your scanner to find stocks gapping down on heavy pre-market volume with a clear negative catalyst. Think of things like a disastrous earnings report, a product recall, or a damaging lawsuit.
The execution is a mirror image of the long setup:
- The Entry Trigger: A break below the pre-market low on the 1-minute or 5-minute chart.
- The Stop-Loss: Placed just above a key resistance point, like the opening price or the high of your entry candle.
- The Goal: To ride the wave of intense, early-morning selling pressure.
The core principle doesn't change one bit. You're still finding a stock with a powerful overnight catalyst and betting that the initial momentum will carry it further in the direction of the gap.
Ready to stop guessing and start building a systematic approach to trading? ChartsWatcher provides the powerful, real-time scanning and charting tools you need to find and execute high-probability gap and go trades every morning. Build your custom scanner, analyze charts, and find your edge.
