A Trader's Guide to the Commodity Channel Index
The Commodity Channel Index (CCI) is a classic momentum oscillator that helps traders figure out one crucial thing: how far has a stock's price strayed from its statistical average? Think of it as a way to spot when market sentiment is getting a little too hot or a little too cold, which often signals that a price reversal or a brand new trend is just around the corner. It’s a workhorse indicator, just as useful in stocks as it is in commodities or forex.
Getting a Feel for the Commodity Channel Index
Let's use a simple analogy. Imagine a river that represents a stock's average price over the last few weeks. Most of the time, the water level—the current price—stays comfortably within the riverbanks. The CCI is like a flood gauge for that river. It tells you exactly when the water has risen to a dangerous high (overbought) or dropped to an unusual low (oversold).
When you see the CCI line surge past +100 or dive below -100, that’s your signal. It’s a clear warning that the price has moved a long way from its comfort zone, and the conditions are ripe for a change in direction.
This powerful but intuitive tool was developed by a technical analyst named Donald Lambert back in 1980. He wanted to create an indicator that could reliably identify cyclical turns, not just in commodities, but in any traded market. He did such a good job that it remains a core part of almost every trading platform decades later.
The Real Job of the CCI
The main purpose of the Commodity Channel Index is to add context to price action. A stock is going up—great. But how strong is that move compared to what it's done recently? The CCI helps you answer the questions that actually matter:
- Is this rally getting overextended and likely to pull back?
- Is this sell-off running out of gas and maybe finding a bottom?
- Has the momentum truly shifted, giving a green light to a new trend?
Lambert specifically designed the indicator so that roughly 70-80% of all CCI readings would naturally stay between the -100 and +100 "riverbanks." This statistical rule is what makes the signals so meaningful when the price finally breaks out of that range. The CCI famously dipped below -100 weeks before the 1987 crash when the Dow plunged 22.6% on Black Monday, proving its worth as a potential early warning system. You can dig deeper into the indicator's development and its mathematical constants.
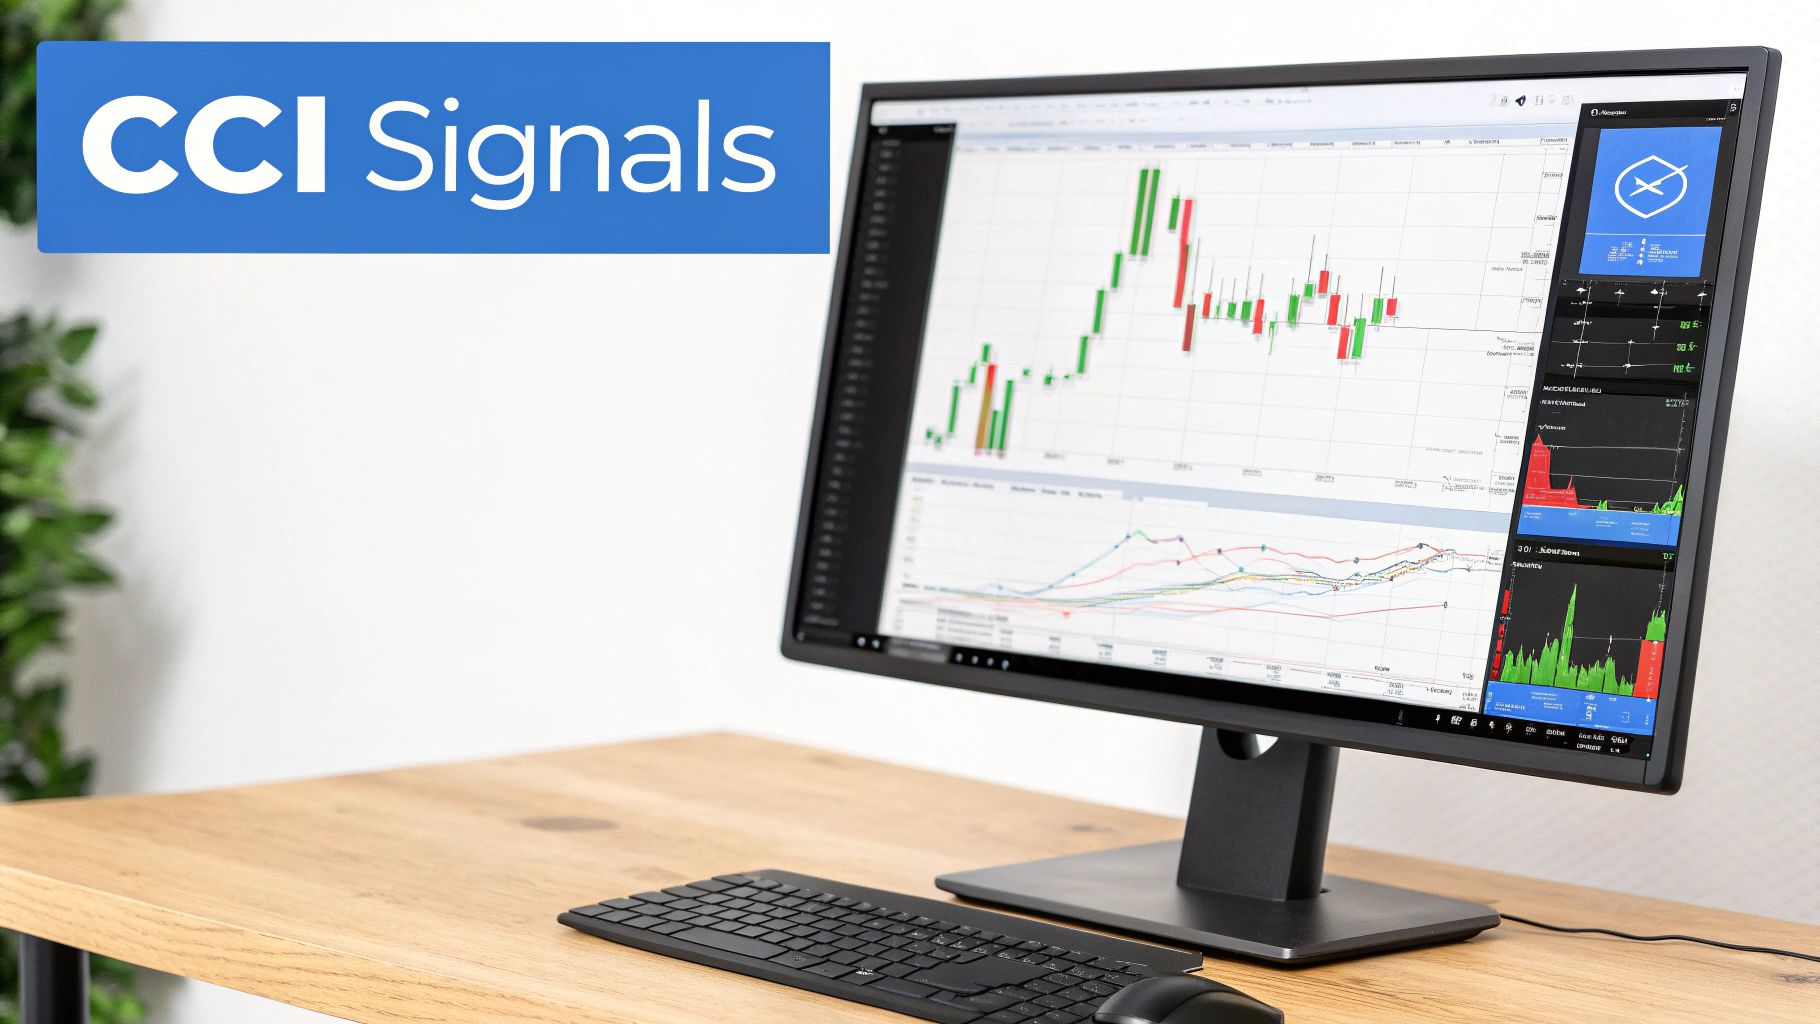
The screenshot below from the ChartsWatcher platform shows you exactly what this looks like in practice. The CCI is plotted right below the price chart, giving you a clean visual of these key zones.
Take a look at how the CCI line moves above and below the zero line. Every so often, it breaches the +100 and -100 thresholds, flagging those extreme conditions. Once you learn how to read these signals—which we're about to cover—you can give yourself a serious edge.
How the CCI Indicator Is Calculated
Let’s be honest, the formula for the Commodity Channel Index can look a little scary at first. But you don’t need a math PhD to get what’s happening under the hood. When you break it down, it's actually a pretty logical process that measures how far the current price has wandered from its average—kind of like tracking a planet's deviation from its usual orbit.
At its core, the CCI calculation is all about establishing a fair, average price for each period and then seeing how far the current price is from that baseline.
Establishing a Baseline with Typical Price
Instead of just grabbing the closing price like many other indicators, the CCI formula starts with something called the Typical Price. This gives us a much more balanced feel for what happened during a trading session.
It's a simple average of the high, low, and close for whatever period you're looking at:
(High + Low + Close) / 3
This approach paints a more complete picture of the price action inside a single candle, rather than just pinning everything on one data point. Think of it like judging a basketball game by the average score throughout each quarter, not just the final buzzer-beater.
Next, the formula needs a baseline to compare this Typical Price against. It does this by calculating a Simple Moving Average (SMA) of the Typical Price, usually over 20 periods. This SMA becomes our centerline, representing the "normal" or expected price.
Measuring the Deviation from Average
Once that baseline is set, the next step is to measure how far the Typical Price is straying from it. This is where the concept of Mean Deviation comes into play.
Mean Deviation simply calculates the average distance between the Typical Price of each period and that SMA we just calculated. In essence, it tells us what a "normal" amount of volatility or price movement looks like for that asset. It defines the riverbanks—showing you how wide the typical trading range is.
Finally, Donald Lambert threw in a special constant: 0.015. This little number is the secret ingredient that keeps the indicator's readings consistent across different securities. It scales the final value so that about 70-80% of all CCI readings fall between the +100 and -100 levels. This is huge, because it makes any move outside this range statistically significant and worthy of our attention.
The process flow below visualizes how these calculations translate directly into market sentiment readings we can actually use.
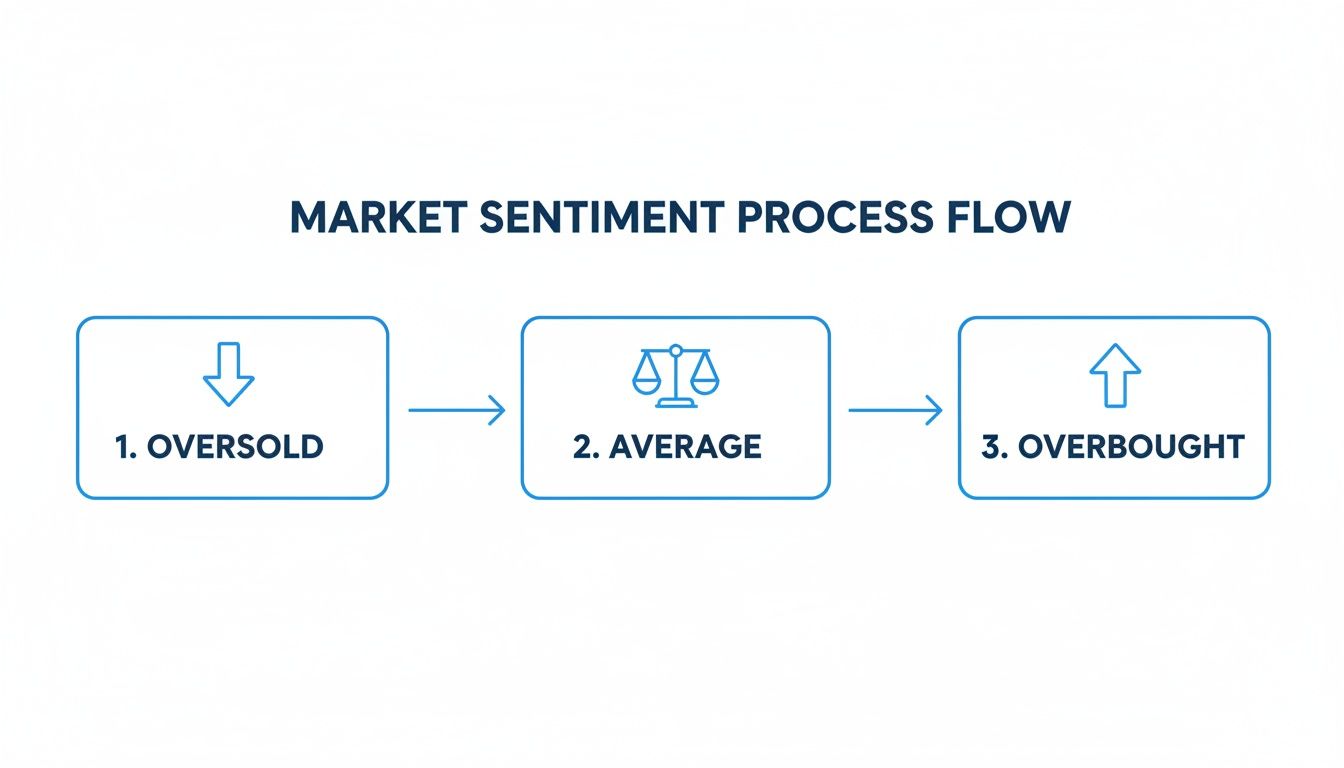
This graphic perfectly illustrates the journey from an oversold state back through average conditions and into an overbought one—with the zero line acting as the midpoint, just as intended.
Choosing the Right Period Length
The single most important setting you'll have to deal with is the period length. This one parameter dictates the indicator's sensitivity and the kind of signals it spits out. Tweaking it is how you tune the CCI to your specific trading style.
A shorter period makes the CCI more sensitive to recent price changes, generating more signals. A longer period smooths out the indicator, reducing noise and focusing on more significant, longer-term trends.
There's no single "best" answer here; the right setting really depends on your strategy. A scalper glued to a 5-minute chart needs a totally different level of responsiveness than a swing trader who holds positions for weeks.
To give you a starting point, here’s a breakdown of how different period settings typically behave.
CCI Period Parameter Comparison
| CCI Period | Sensitivity | Signal Frequency | Best For | Example Use Case |
|---|---|---|---|---|
| 14 | High | High | Day Trading & Scalping | Capturing quick momentum shifts on a 5-minute or 15-minute chart for rapid entries and exits. |
| 20 | Medium | Moderate | Swing Trading | Identifying multi-day price swings on a 4-hour or daily chart, filtering out minor daily noise. |
| 50 | Low | Low | Trend Following | Confirming the strength and direction of major trends on a daily or weekly chart, ideal for position traders. |
| 100 | Very Low | Very Low | Long-Term Analysis | Identifying major market cycle tops and bottoms over several months or years on a weekly chart. |
The best way to figure out what works for you is to get your hands dirty. By experimenting with these different parameters in a platform like ChartsWatcher, you can find that sweet spot between responsiveness and reliability that fits your system perfectly.
How to Read CCI Signals for Trading
Knowing the math behind the Commodity Channel Index is one thing. But turning its wiggles on the chart into real, actionable trade ideas? That’s where the magic happens. Think of the CCI as a barometer for market momentum; learning to read it is like learning the language of price strength and exhaustion.
At its core, the CCI swings around a central zero line, with critical thresholds at +100 and -100. These aren't just random numbers. They're statistically set to contain most of the price action, which means any time the indicator breaks past them, it’s a big deal.
Mastering Overbought and Oversold Levels
The classic way to use the CCI is by watching for overbought and oversold readings. When the CCI climbs above the +100 level, it’s a sign that the asset is stretched way beyond its recent average price—what we call an overbought condition. On the flip side, a drop below -100 suggests it’s oversold.
Here’s where a lot of new traders get tripped up: they see an overbought signal and immediately hit the sell button. That can be a costly mistake. An extreme reading doesn't just signal a potential reversal; it can also scream that the current trend is incredibly powerful.
An overbought reading doesn't always mean "sell," and an oversold reading doesn't always mean "buy." In a powerful uptrend, the CCI can remain above +100 for an extended period. The key is to wait for the CCI to cross back below +100 to signal that upward momentum is fading.
To trade these levels with a bit more finesse, try this approach:
- Potential Sell Signal: Wait for the CCI to move above +100 (overbought) and then cross back down below that line. This tells you the buying frenzy might be over and a move lower could be starting.
- Potential Buy Signal: Let the CCI drop below -100 (oversold) first. A potential buy signal triggers when it rallies back above -100, suggesting the sellers are exhausted.
This simple tweak gives you a more confirmed entry, rather than just jumping the gun the second the CCI hits an extreme. If you want to dive deeper into this, check out our guide on using oversold and overbought indicators to time your trades.
The Significance of the Zero-Line Cross
While the +100 and -100 levels get all the glory, the zero line is arguably the indicator's most important feature. It represents the equilibrium point—the exact spot where the current price matches its average. A cross of this line is a clean, clear signal that momentum has shifted.
- Bullish Zero-Line Cross: When the CCI moves from negative to positive territory by crossing above zero, it signals that momentum has officially flipped from bearish to bullish. This is often used to confirm an entry into a fresh uptrend.
- Bearish Zero-Line Cross: Conversely, when the CCI moves from positive territory to negative, crossing below zero, it indicates that momentum has swung bearish. This can confirm the start of a new downtrend.
Entire trend-following strategies have been built on this simple concept. It acts as a fantastic filter, helping you stay on the right side of the market's dominant short-term push.
Uncovering Divergence Signals
Divergence is one of the most powerful—and subtle—signals the CCI can give you. It happens when the indicator and the price start telling two different stories, often giving you a heads-up that a trend is running out of gas.
You’ll want to watch for two main types:
- Bullish Divergence: This happens when the price chart shows a new lower low, but the CCI chart forms a higher low. This disagreement is a clue that selling pressure is secretly weakening, and a bullish reversal could be just around the corner.
- Bearish Divergence: This forms when the price makes a new higher high, but the CCI paints a lower high. It’s a huge red flag. It tells you that even though prices are pushing up, the underlying buying momentum is fading, hinting at a potential bearish reversal.
Think of divergence like finding a crack in a trend's foundation. The price chart might still look perfectly healthy, but the CCI is whispering that the internal strength is starting to crumble. Spotting these patterns takes practice, but it can give you a massive edge by positioning you ahead of a major trend change. It’s a proactive signal, unlike the more reactive crossovers.
Advanced CCI Trading Strategies
Once you've got the hang of the basics—like spotting overbought signals and watching for zero-line crosses—it's time to dig into more structured and nuanced ways of using the Commodity Channel Index. Advanced strategies take you beyond just reacting to a signal and move you into systematic, rule-based trading that can give you a clearer edge. The goal here is to filter out the market noise and lock in on higher-probability setups.
A great starting point is using the CCI for trend confirmation. Instead of automatically selling the moment the indicator pokes above +100, a trend-following trader sees that as a green light. A cross above +100 can signal that a powerful new uptrend is kicking off, giving you the confidence to jump into a long position or add to one you already have.
The same logic applies on the downside. A dip below -100 isn't just an oversold reading; it can be the opening bell for a strong downtrend. By flipping your perspective and using these extremes as trend starters instead of reversal points, you align yourself with the market's real momentum. This simple mental shift is often what separates newbies from experienced chart technicians.
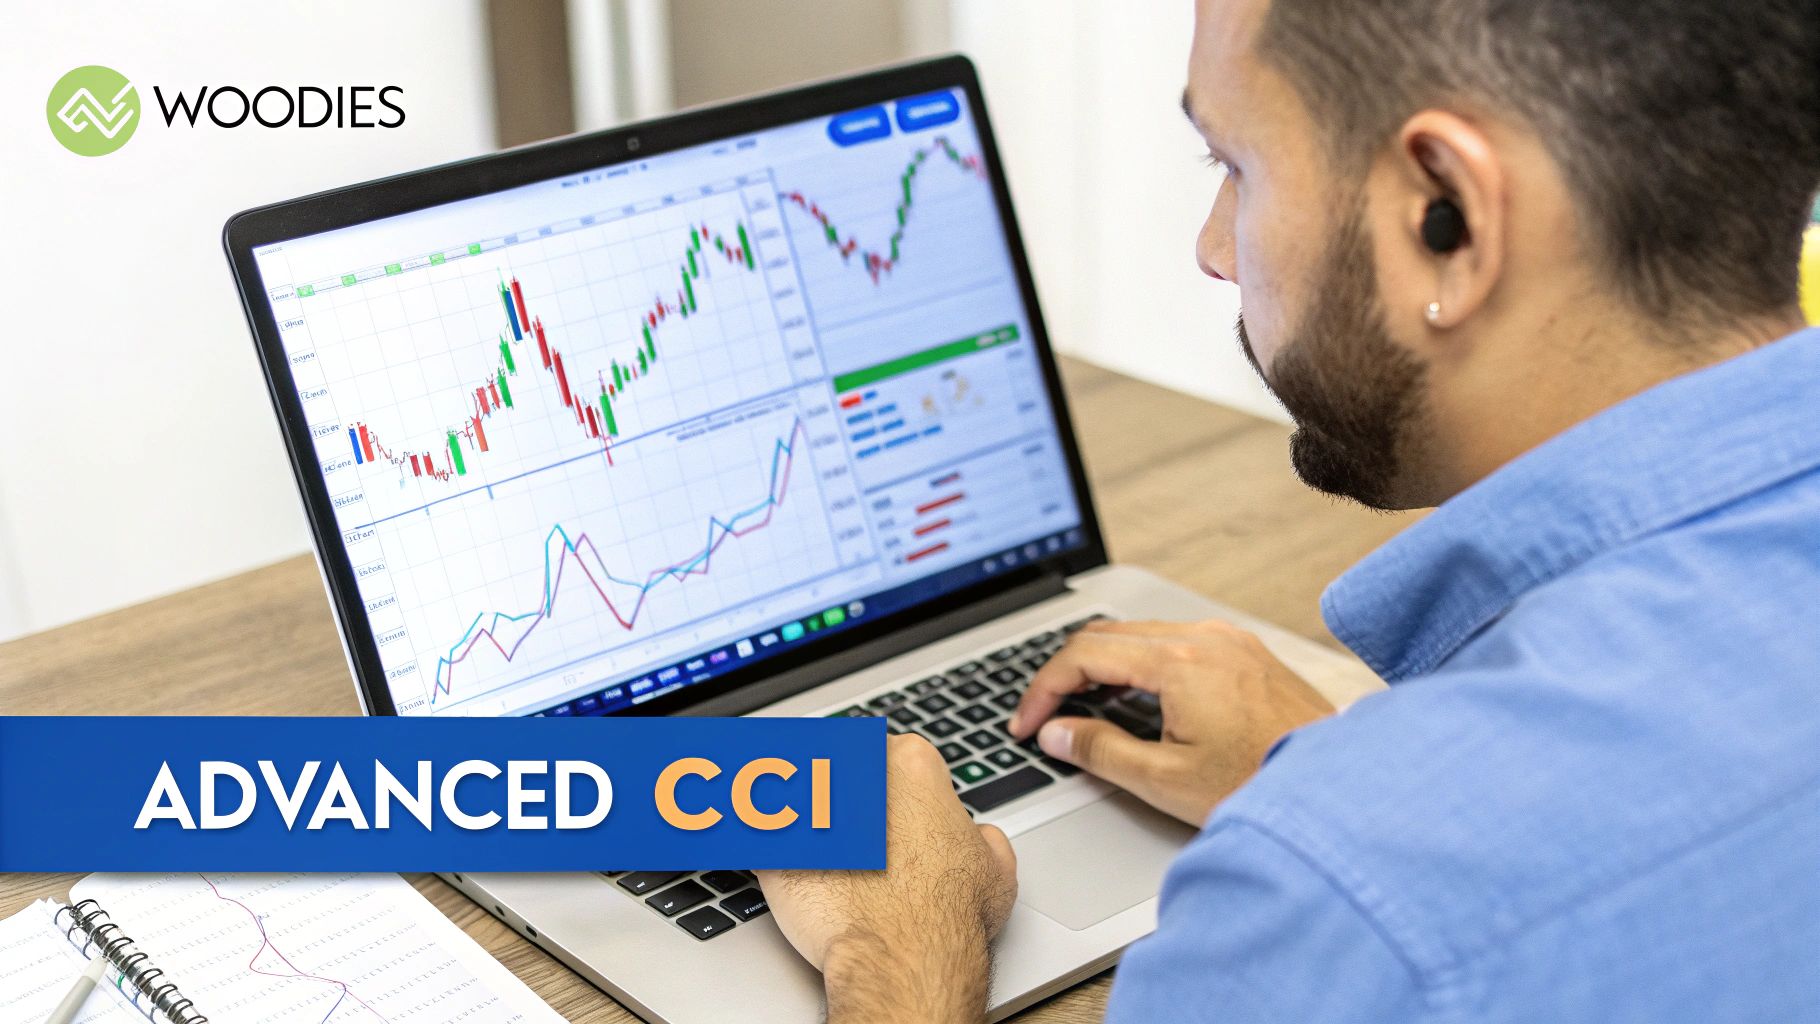
The Woodies CCI System Explained
For traders who want a complete, ready-made framework, the Woodies CCI system is a classic. Developed by Ken Wood, this popular approach treats the CCI not as a simple add-on indicator but as a full-fledged trading system with its own unique patterns and rules. It typically uses two CCI indicators on the chart: a standard CCI(14) for entry signals and a shorter-term CCI(6) that acts as a filter.
The Woodies system is known for its named patterns, which give you far more context than a simple line crossing ever could. These patterns are specifically designed to pinpoint trend continuations and potential reversals with a much higher degree of precision.
Here are a few key patterns from the Woodies playbook:
- Zero-Line Reject (ZLR): This is a powerful signal that the current trend is still in play. During an uptrend, the CCI will pull back toward the zero line but then "bounce" off it without crossing, signaling the trend is ready to take off again.
- Trend Line Breaks (TLB): This one is fascinating—you draw trend lines directly on the CCI indicator itself. A break of a trend line on the CCI often happens just before the price trend breaks, giving you an early heads-up that momentum is shifting.
- Hook from Extreme (HFE): This pattern forms after the CCI has hit an extreme level (above +100 or below -100). The indicator turns back toward the zero line, but then "hooks" back in the direction of the original trend before it gets there. It's a great signal that a minor pullback is over and the main trend is resuming.
The core idea behind the Woodies CCI system is to give traders a more refined edge by focusing on specific chart patterns within the indicator itself, rather than just relying on standard overbought or oversold levels.
This system, which came about in the early 2000s, has a surprisingly robust track record. Backtests on large-cap stocks show a 67% accuracy on daily and 4-hour timeframes. In forex markets, the win rate for zero-line rejects in range-bound conditions jumps to 82%. More importantly, it's designed to give you a real edge, generating 41% fewer losing trades than standard oscillators in sideways markets. You can find more insights on the effectiveness of the Woodies system on luxalgo.com.
Implementing Woodies CCI Patterns
To really apply these patterns, you have to adjust your mindset. In the Woodies system, the zero line is everything. It’s the battle line between bullish and bearish territory. The fundamental rule is simple: only take long trades when the CCI is above zero and short trades only when it’s below.
Let's walk through a classic Zero-Line Reject (ZLR) setup:
- Identify the Trend: The CCI(14) is consistently holding above the zero line, confirming a solid uptrend.
- Wait for a Pullback: Watch for the CCI to drift down toward the zero line as the price takes a breather.
- Spot the "Reject": The CCI must turn back upwards before it touches or crosses zero. That's the rejection signal.
- Confirm the Entry: A trader would typically enter a long position on the price candle that lines up with the CCI turning back up from the zero line.
This method keeps you on the right side of the trend while letting you get in on pullbacks, which often gives you a much better risk-to-reward ratio. By mastering these specific patterns, you can build a truly systematic trading plan around the Commodity Channel Index. The ChartsWatcher platform makes this easy by allowing you to plot multiple CCI indicators on a single chart, so you can implement systems like Woodies CCI and scan for these exact setups across the market.
Common Mistakes When Using the CCI
The Commodity Channel Index is a remarkably powerful tool, but like anything potent, it has a few traps that can easily snare new traders. Getting a handle on these common mistakes is the best way to sidestep them and start using the CCI with real confidence.
One of the biggest blunders is shorting a stock just because the CCI screams "overbought" by ripping past +100. In a strong bull run, this is a recipe for disaster. That extreme reading isn't necessarily a reversal signal; it's often a sign of powerful, sustained momentum. A stock can stay "overbought" for weeks while it grinds higher, stopping out every trader who tried to call the top.
The biggest trap is treating an overbought CCI signal as an automatic sell order during a powerful uptrend. In this context, a reading above +100 often confirms the trend's strength, not its end.
Instead of trying to fight the freight train, just wait for confirmation. A much smarter play is to wait for the CCI to cross back down below the +100 line before you even think about a short position. That simple bit of patience confirms the bullish momentum is actually starting to give out.
Navigating Whipsaws and Sideways Markets
Another major headache is dealing with "whipsaws." These are the rapid-fire, fake-out signals that plague choppy, sideways markets. When a stock is just bouncing around in a tight range with no real direction, the CCI can flop wildly around the zero line, spitting out a stream of confusing and money-losing signals.
Acting on every one of those signals in a rudderless market is a quick way to bleed your account dry. The fix? Add a trend-confirming indicator to your chart.
- Moving Averages: Throw a long-term moving average on your chart, like the 200-period SMA. Then, only take long signals from the CCI when the price is above that moving average. And only consider short signals when the price is below it. Simple.
- ADX Indicator: You can also use the Average Directional Index (ADX) to tell you if there's a trend worth trading. If the ADX is hanging out below 25, it's signaling a weak, choppy market. That’s your cue to ignore most CCI signals until things start trending again.
Ignoring the Bigger Picture
Finally, one of the most critical errors is looking at the CCI on just one timeframe. A great-looking bullish signal on a 15-minute chart might be nothing more than a tiny bounce in the middle of a brutal downtrend on the daily chart. This is what traders call "fighting the primary trend," and it rarely ends well.
Always practice multi-timeframe analysis. Before you jump into a trade, zoom out. Check a higher timeframe to make sure your signal isn't running head-on into a much larger trend. If the daily chart is bearish, you should be extremely skeptical of long signals on your hourly chart. This discipline keeps you swimming with the current instead of against it, and that will dramatically improve your odds with the CCI.
How to Backtest a CCI Strategy
An idea on a chart is just a guess. A backtested strategy, on the other hand, is a data-driven plan. To turn your Commodity Channel Index setups from theory into a reliable system, you absolutely must put them through rigorous testing.
This process isn't just about finding a winning formula. It’s about understanding how your strategy breathes—its strengths, its weaknesses, and its breaking points—so you can trade it with confidence and unwavering discipline when real money is on the line.
The first step is to define your rules with absolute, razor-sharp precision. Ambiguity is the enemy of successful backtesting. You have to lay out a specific, mechanical set of instructions that leaves zero room for interpretation.
Defining Your Trading Rules
Start by outlining every single component of your trade plan. Your rules must cover your entry, your exit, and how you manage risk. No wiggle room.
Here’s a simple checklist to get you started:
- Entry Trigger: What exact CCI event gets you into a trade? Be painfully specific. Is it the moment CCI crosses above -100? Or is it a specific Zero-Line Reject pattern?
- Exit Conditions (Profit): How will you take profits? Maybe you’ll exit when the CCI crosses back below +100. Or perhaps you'll use a fixed risk-to-reward ratio like 2:1.
- Exit Conditions (Loss): Where is your stop-loss? You could base it on a recent swing low, a specific percentage of the price, or even an opposing CCI signal.
- Position Sizing: How much capital will you risk on each trade? Sticking to a fixed percentage of your account, like 1%, is a standard professional practice for a reason.
With these rules clearly defined, you can use a platform like ChartsWatcher to run your strategy against historical data. The goal is to see how this exact set of rules would have performed over months or even years of past market action, giving you a clear, unbiased picture of its potential.
To dive deeper into this crucial process, check out our essential guide on how to backtest a trading strategy.
Analyzing Key Performance Metrics
Once your backtest is finished, you’ll have a mountain of data. It’s tempting to just look at the total profit, but that's a rookie mistake. True understanding comes from digging into the performance metrics that reveal the strategy’s real character and resilience.
A profitable backtest is encouraging, but understanding the maximum drawdown is critical. It tells you the largest peak-to-trough decline your account would have experienced, preparing you psychologically for the inevitable losing streaks.
Look for key metrics like win rate, profit factor (gross profit divided by gross loss), and maximum drawdown. A high win rate feels great, but a lower one can still be incredibly profitable if it has a high profit factor. This is where quantitative analysis proves its worth.
For instance, a detailed 20-year backtest on the S&P 500 using a CCI(50) strategy found that going long when the CCI crossed above -100 generated a 1,108% total return. That absolutely crushed the index's 555% buy-and-hold gain over the same period.
Even better, this system produced a maximum drawdown of just 22% compared to the S&P 500's crippling 57% drop during the 2008 crisis. You can discover more insights about this CCI backtest on QuantConnect. This is the kind of hard data that validates your edge and turns a hopeful idea into a confident trading plan.
Have More Questions About the CCI?
Even after you've got a handle on the strategies and common mistakes, some specific questions always seem to pop up. Let's tackle the most common ones head-on so you can start using the CCI with a bit more confidence.
What’s the Best Timeframe to Use for the CCI?
There’s no magic answer here—it all boils down to your trading style. Day traders, for example, often live on the 5-minute or 15-minute charts, using the CCI to pinpoint quick momentum shifts. Swing traders will likely find more value on the 1-hour or daily charts to catch trends that last several days.
Even long-term investors can put it to work on weekly charts to get a feel for major market cycles. The trick is to align the CCI's period setting with your timeframe. Think shorter periods like 10-14 for faster charts and longer ones like 50-100 for the daily or weekly to smooth out the noise.
Can I Use the CCI on Stocks and Crypto?
Absolutely. Don't let the name fool you. While it was born in the commodities market, the Commodity Channel Index is a versatile oscillator that works on pretty much anything with a price chart—stocks, forex, indices, and yes, even crypto. The underlying math just measures how far the price has strayed from its average, which is a universal concept.
One thing to keep in mind is you'll probably need to tweak the settings depending on what you're trading. A notoriously volatile asset like Bitcoin might need a slightly longer CCI period to filter out the wild swings compared to a stable blue-chip stock.
How Can I Scan for CCI Signals?
This is where a good stock scanner becomes your best friend. Instead of manually flipping through hundreds of charts, you can build custom screens to find the exact CCI setups you're looking for. For instance, you could set up alerts for conditions like:
- Finding Overbought Setups:
CCI(20) Crosses Above 100 - Spotting Oversold Opportunities:
CCI(50) Crosses Below -100 - Catching Momentum Shifts:
CCI(14) Crosses Above 0
You can then layer on other filters, like volume or market cap, to really zero in on the best opportunities.
Ready to stop hunting and start finding? You can build these exact custom CCI scans and backtest your strategies with ChartsWatcher. Our platform is built to help you find high-probability setups across the entire market, in real-time. Start scanning for your next trade at https://chartswatcher.com.
