A Trader's Guide to the Bullish Flag Pattern
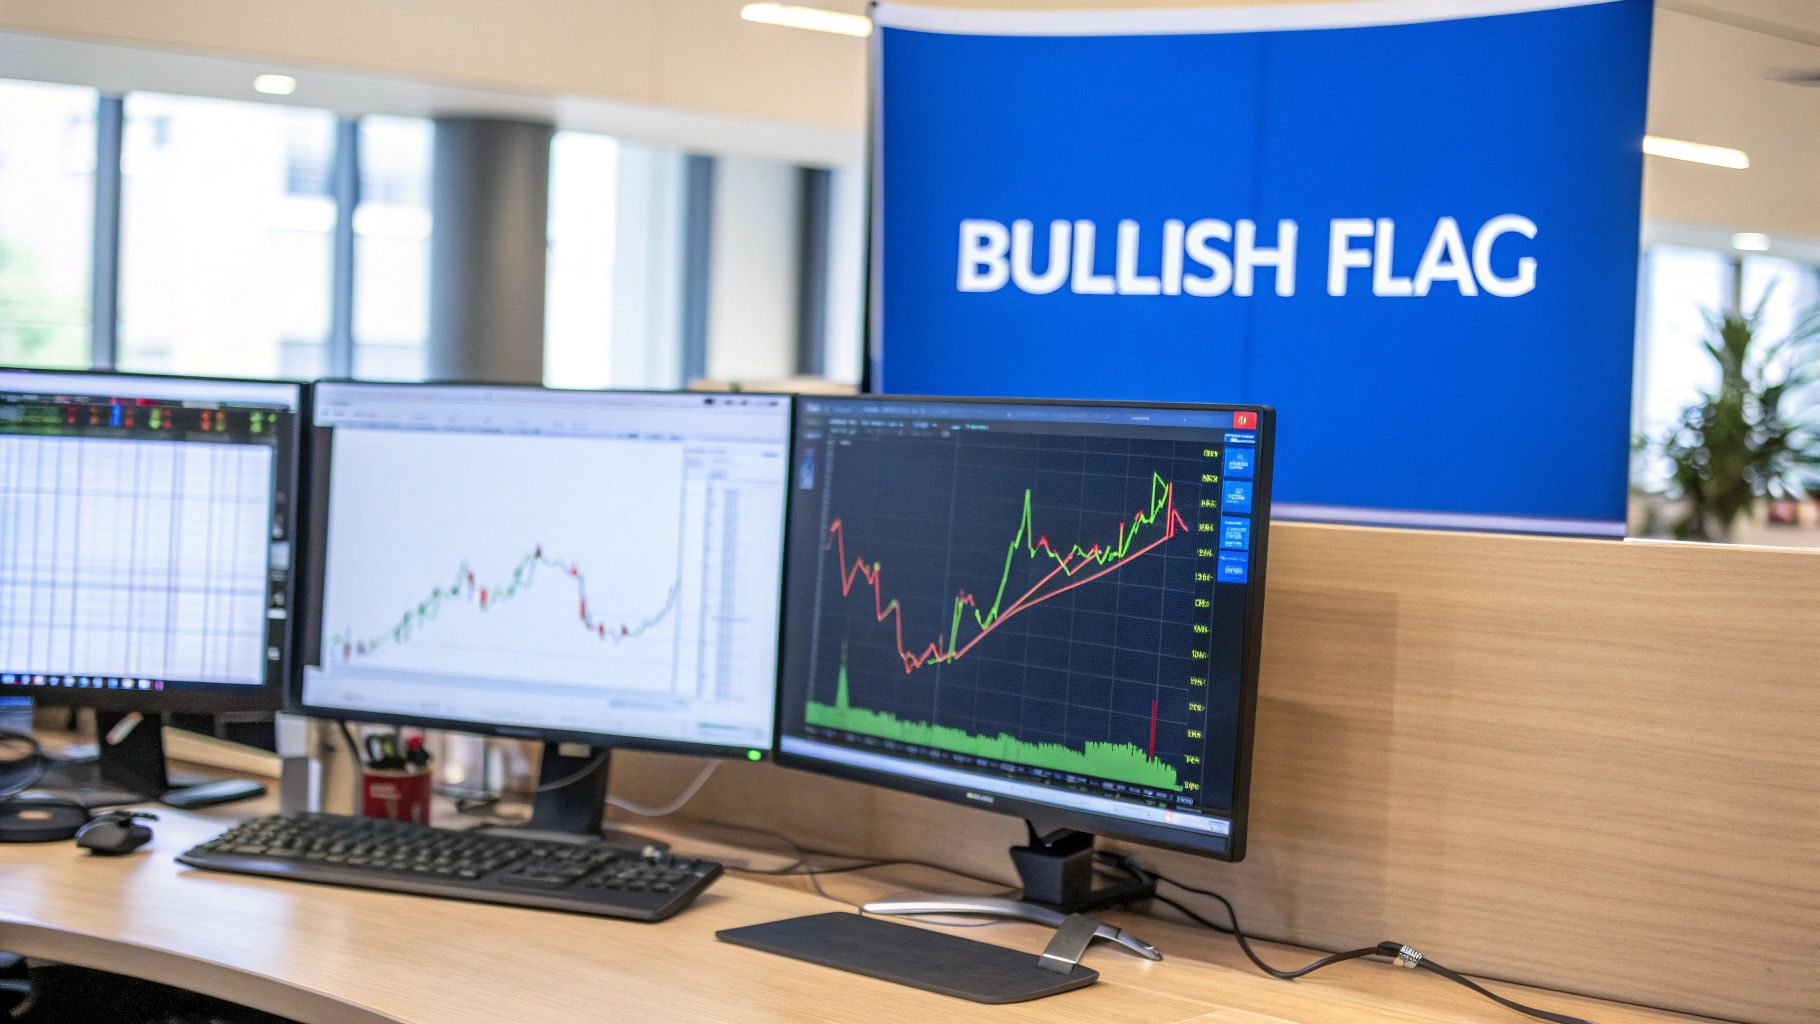
Of all the patterns in a technical trader's playbook, the bullish flag is one of the most reliable signals out there. It’s a continuation pattern, which simply means it signals a high probability that a powerful uptrend is about to resume after a brief pause.
Think of it like a market catching its breath. When you spot one, it's often a sign that the smart money is getting ready for the next big push higher, making it a critical pattern for traders looking to enter strong trends with confidence.
What a Bullish Flag Signals About Market Behavior
At its heart, the bullish flag tells a story of overwhelming buyer strength. Imagine a sprinter who, after a powerful burst off the starting line, settles into a steady, controlled pace to conserve energy before the final push. The market does the same thing. This pattern shows a temporary and orderly consolidation, not a genuine loss of momentum.
Understanding this gives you a huge edge. It helps you distinguish between a healthy pullback and a real trend reversal. It’s a visual map of market psychology: initial excitement drives a sharp price surge, followed by a period of calm profit-taking before the next wave of buyers jumps in.
Key Characteristics of a Bullish Flag Pattern
To help you quickly identify this pattern on a chart, here’s a breakdown of its core components and what they mean. Think of this as your quick-reference guide.
| Component | Description | Market Implication |
|---|---|---|
| The Flagpole | The initial, sharp, almost vertical price move on high volume. | Represents intense buying pressure and strong conviction from the bulls. |
| The Flag | A brief consolidation phase with a slight downward or sideways drift. | Shows a weak and orderly pullback on low volume, indicating sellers lack power. |
| Volume | High volume during the flagpole, low volume during the flag consolidation. | Confirms the trend's underlying strength and the temporary nature of the pause. |
| Breakout | The price breaking above the flag's upper trendline, often on rising volume. | Signals the end of the consolidation and the likely resumption of the uptrend. |
Recognizing these elements together is what gives the bullish flag its predictive power. It’s the complete story—the explosive start, the quiet pause, and the powerful continuation—that makes it such a compelling trade setup.
The Two Core Components of a Bullish Flag
The pattern is made up of two distinct parts. You need to see both to have a valid setup.
-
The Flagpole: This is the big, explosive move that kicks things off. You want to see a strong, near-vertical price surge happening on significant volume. This tells you the buying pressure is intense and the bulls mean business.
-
The Flag: This is the consolidation that comes right after. It looks like a small, downward-sloping rectangle or channel. That slight downward drift is crucial—it shows that while some profit-taking is happening, the sellers just don't have enough muscle to truly reverse the trend.
Key Takeaway: The magic of the bullish flag is in the combination: a powerful upward thrust (the flagpole) followed by a weak, orderly pullback (the flag). This suggests the underlying trend is very much alive and well.
Why This Pattern Is a Continuation Signal
The bullish flag is classified as a continuation signal because it almost always resolves in the direction of the prior trend. History backs this up. Market studies have shown the success rate can be quite high, which is why it's a favorite among so many technical traders.
The real secret lies in the volume. The flagpole forms on a blast of high volume, confirming strong buyer interest. But during the flag consolidation, the volume should dry up noticeably. This is your clue that the selling pressure is weak and disorganized. When the price finally breaks out from the flag, you’ll often see another spike in volume, confirming that buyers are back in control and ready to push the price higher.
By mastering this pattern, you can find excellent entry points to join an established uptrend that still has plenty of room to run. If you want to dive deeper into technical analysis and other powerful chart patterns, a comprehensive trading education like the vTrader Academy can be an invaluable resource.
Anatomy of a High-Probability Bullish Flag
Not all bull flags are created equal. You’ll see formations that look like a flag all over the charts, but only a select few have the right DNA for a high-probability trade. Learning to spot these critical visual cues is what separates traders who consistently profit from patterns and those who get chopped up by false signals.
It all comes down to understanding the story the chart is telling through two key components: the flagpole and the flag. Each piece of the puzzle has to be just right.
First, you have the flagpole, which is the initial, explosive burst of buying pressure. This isn't some slow, lazy grind upwards. It’s a sharp, almost vertical surge that tells you buyers are in complete control.
Then, the market needs to take a breather. That’s where the second piece, the flag, forms. This is a period of quiet consolidation where the price drifts down or sideways within a neat, orderly channel. This gentle pullback is a sign of immense strength, not weakness.
The Flagpole: An Explosive Start
The flagpole is the foundation of the entire setup. Without a strong one, the pattern is invalid. Think of it as the market shouting its intentions from the rooftops.
A proper flagpole has a couple of non-negotiable characteristics:
- A Steep Angle: The move has to be aggressive, sharp, and nearly vertical. A slow, grinding uptrend lacks the impulsive power needed for a reliable pattern.
- High Volume: This is critical. The powerful price surge must happen on a significant spike in trading volume. This confirms the move is backed by institutional money and broad market conviction.
If you don't see a powerful flagpole built on a mountain of volume, then any consolidation that follows is just market noise. It's not a tradable flag. The initial force of this move is what coils the spring for the next leg up.
The Flag: A Quiet Consolidation
After the firework show of the flagpole, the price settles into the flag phase. This is where the sellers get their chance to step in, but in a quality setup, they barely make a dent. The way this consolidation looks tells you everything about the underlying battle between buyers and sellers.
A textbook bullish flag should slope gently downwards, against the primary trend of the flagpole. This tells you the selling is just weak profit-taking, not a real attempt to reverse the trend.
The most important clue during this phase is a dramatic drop in volume. As the price drifts sideways or down in the flag, volume should completely dry up, often falling well below average. This is the tell-tale sign that sellers have zero conviction. They simply don't have the firepower to push the price down in a meaningful way, confirming that the bulls are just resting and are still firmly in charge.
To really see the components of a bull flag come to life, it helps to know your way around a basic chart. For those new to charting, understanding how to create a time series chart is a great starting point for visualizing this price and volume data over time.
Differentiating Strong Patterns From Weak Ones
Once you know the ideal anatomy, filtering out the junk setups becomes much easier. A weak or failed bull flag will almost always have a "tell" that you can spot ahead of time.
| Strong Bullish Flag (High-Probability) | Weak Bullish Flag (Low-Probability) |
|---|---|
| Steep, near-vertical flagpole. | A slow, grinding flagpole with a shallow angle. |
| Significant volume spike during the flagpole. | Low or average volume during the flagpole move. |
| Flag slopes gently downward or sideways. | Flag slopes upward (this is a rising wedge, a bearish pattern). |
| Volume dries up significantly during the flag. | Volume remains high or erratic during consolidation. |
By training your eye to hunt for these specific details—an explosive, high-volume flagpole followed by a quiet, low-volume consolidation—you can screen out the noise and focus only on the A+ trading opportunities. This disciplined eye is key to using the bullish flag pattern effectively.
A Step-by-Step Guide to Trading the Bullish Flag
Spotting a high-probability bullish flag is one thing, but turning that pattern into profit is a different game entirely. It demands a disciplined, repeatable trading plan. Having a clear framework for when to get in, where to get out, and how to protect yourself removes the emotional rollercoaster from trading and helps you manage risk like a professional.
Think of this process less like a rigid rulebook and more like a pilot's pre-flight checklist. Before a pilot ever dreams of taking off, they systematically check every critical component. A trader should do the same before risking a single dollar. This structured approach is what separates consistent traders from gamblers.
Step 1: Confirm the Pattern Is Valid
Before you even think about hitting the "buy" button, your first job is to be a tough quality-control inspector. Go back to the chart and make sure the pattern you've found actually meets the textbook criteria for a high-probability setup.
- A Strong Flagpole: Was that first move up sharp and aggressive? Did you see a noticeable spike in volume pushing it higher? A weak, grinding flagpole is a major red flag.
- A Proper Flag: Is the consolidation period drifting gently downward or sideways? A flag that slopes up is a serious warning sign that the pattern is likely flawed.
- Volume Contraction: Has the volume dried up during the flag's formation? This is a non-negotiable element. It's the market's way of telling you that sellers are losing interest.
If any of these pieces are missing, the pattern is suspect. It’s far better to pass on a mediocre setup and wait for an A+ opportunity than it is to force a trade on a shaky foundation.
This diagram shows the ideal flow of a bullish flag, from the initial surge all the way to the breakout.
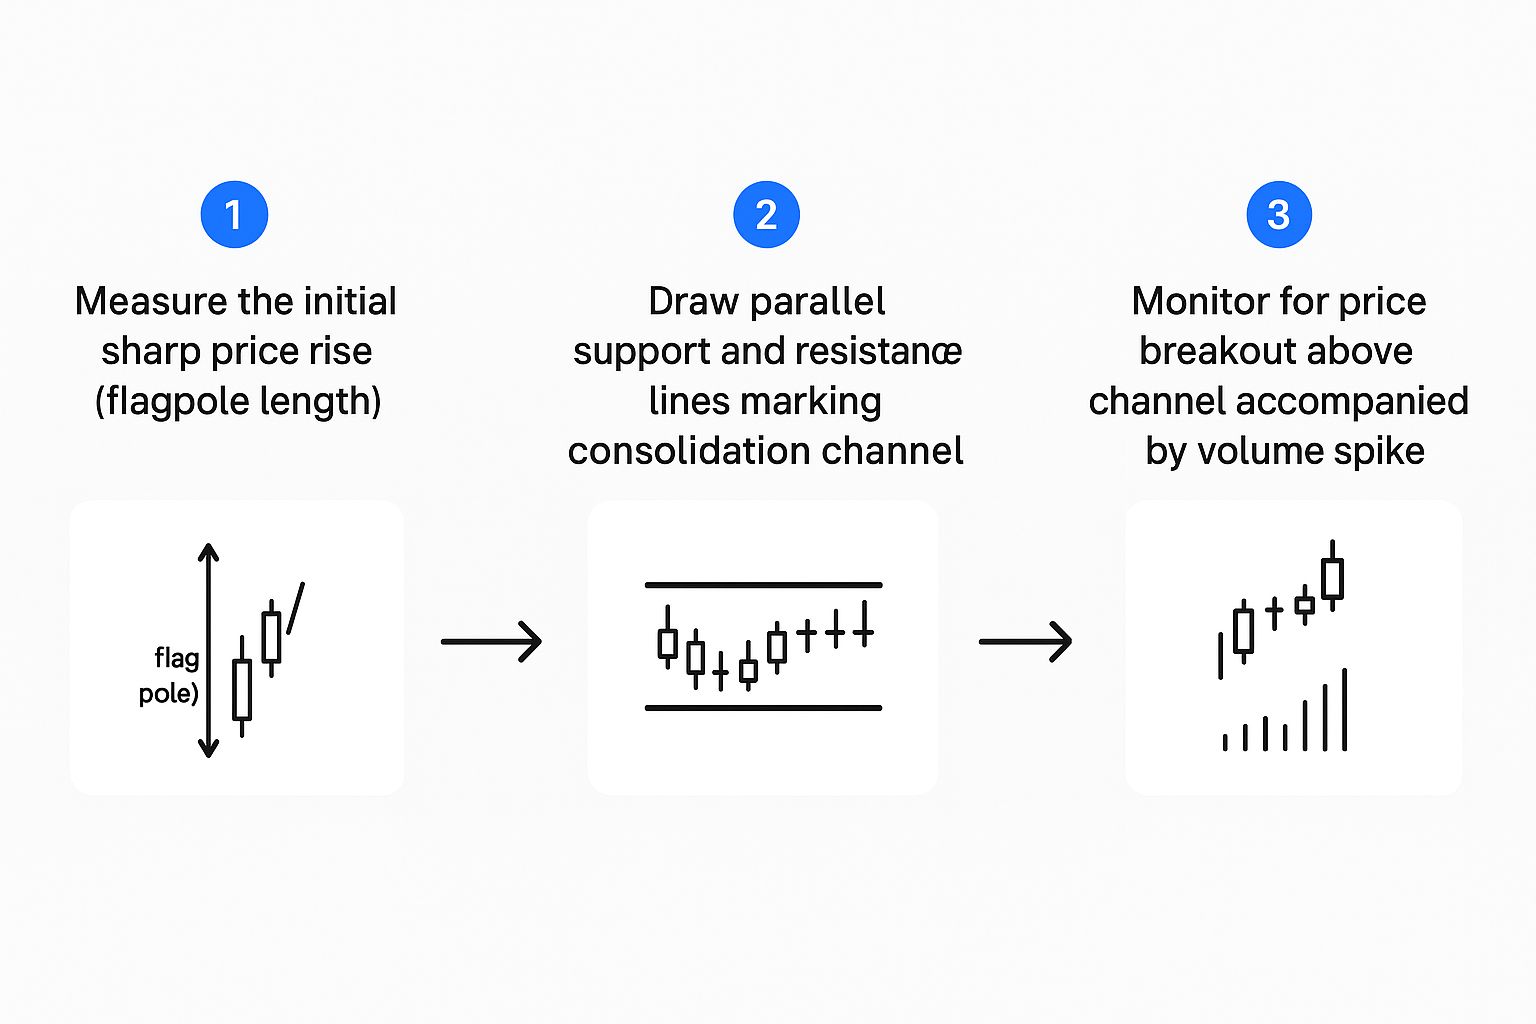
This visual process shows the key stages a trader watches for: confirming the powerful initial run-up, the quiet and orderly consolidation, and finally, the decisive volume-backed breakout.
Step 2: Pinpoint Your Entry Point
Once you’ve confirmed the pattern is the real deal, it's time to figure out exactly where to get in. The most common and reliable entry for a bullish flag pattern is on the breakout.
Your entry trigger is a decisive price close above the upper resistance line of the flag. Don't jump the gun on a mere price poke; you want to see clear commitment from buyers pushing the price firmly out of the consolidation channel.
Many experienced traders will wait for a full candle to close above that resistance line on their chosen timeframe (like a 15-minute or 1-hour candle) before entering. A little patience here can save you from getting suckered into "false breakouts," where the price pops above the line for a moment only to get slammed back down by sellers.
This breakout is the market signaling that the pause is over and the primary uptrend is back in business. For a deeper look at this critical moment, check out our guide on using a breakout trading strategy to maximize gains.
Step 3: Set Your Protective Stop-Loss
No trading strategy is perfect, which is why risk management is everything. As soon as you enter a trade, you must place a protective stop-loss order. This is your non-negotiable safety net—it defines the absolute maximum you're willing to lose if the trade turns against you.
For a bullish flag, the most logical place to set your stop-loss is just below the lowest point of the flag's consolidation. Putting it here gives the trade some room to breathe without exposing your account to a big hit. If the price breaks down below the flag's support level, the entire pattern is invalidated, and you want to be out of that trade immediately to protect your capital.
Step 4: Establish Your Profit Target
Finally, you need a plan for taking your profits. A great entry is useless without a clear exit strategy. There are two main ways to set a profit target when trading a bullish flag.
-
The Measured Move Technique: This is the classic method. You simply measure the height of the flagpole (from the low to the high of that initial explosive run-up). Then, you project that same distance upward from the breakout point. This gives you a logical price target based on the initial momentum that created the pattern in the first place.
-
Targeting Key Resistance: Another smart approach is to look to the left on your chart and find the next major resistance level. This could be a previous high, a big psychological number (like $100), or an old pivot point. This method works on the principle that the price will likely run to the next known area where sellers have gathered before.
By clearly defining your entry, stop-loss, and profit target before you ever risk any money, you build a disciplined and objective process for trading the bullish flag.
Real-World Examples of Bullish Flag Patterns
Theory is great, but there's nothing like seeing a pattern unfold on a real chart to make it click. Moving from textbook diagrams to live-market action is what builds the confidence you need to pull the trigger on a trade. By walking through a few historical examples, we can see exactly how all the moving parts—the flagpole, the consolidation, the volume, and the breakout—actually come together when money is on the line.
Let's dissect a couple of case studies. Think of this as the chart review you'd do inside a platform like ChartsWatcher. The goal is to train your eye to move from knowing the pattern to truly recognizing it in the wild.
Case Study: Tesla (TSLA) Daily Chart
High-growth, high-momentum stocks are perfect hunting grounds for continuation patterns like the bull flag. A company like Tesla (TSLA) is a prime example of how this pattern can signal a powerful trend resumption right after the market seems to take a quick breather.
In this instance, Tesla's stock was in a strong uptrend before pulling back into a classic consolidation phase. This "pause" was defined by two nearly parallel trendlines, creating the flag shape. Once the price blasted through the top of that consolidation range, TSLA continued its upward march for the next three months, proving just how predictive the pattern can be. For a closer look at similar setups, you can find more analyses of how bull flags appear on stock charts.
Let's break down the key ingredients as they appeared on the TSLA chart:
-
The Flagpole: The stock shot up with an aggressive, near-vertical rally over several days. This wasn't a quiet move; it was accompanied by a huge spike in trading volume, which told us that big institutions were likely piling in.
-
The Flag: Right after hitting its peak, the price settled into a consolidation period. It formed a tidy, downward-sloping channel as some of the early birds decided to take profits. The most important clue here? Volume dried up significantly. This was a huge tell that sellers didn't have the strength or conviction to reverse the trend.
-
The Breakout: After a few days of quiet trading, the price decisively broke above the flag's upper trendline. This breakout was confirmed by another surge in volume, signaling that buyers were back in control and ready to push the price to new highs.
Key Insight: The Tesla example hammers home just how critical volume is. High volume on the flagpole confirmed the initial buying pressure, low volume during the flag showed the weakness of the pullback, and the volume spike on the breakout confirmed the trend was back on.
Analyzing Another Bull Flag Example
The bull flag isn't exclusive to headline-grabbing tech stocks. You can find it across all sorts of sectors and market caps, as long as the core ingredient—strong prior momentum—is there.
Imagine a different scenario: a mid-cap biotech company releases stellar clinical trial results. The stock gaps up and rallies hard for two days, carving out a clean flagpole. Then, for the next week, the price just drifts down gently in an orderly channel on noticeably light volume.
What's happening here? The market is simply digesting the good news. The initial burst of excitement has faded, but the underlying positive sentiment is still very much intact. When the price eventually cracks the top of that channel, it often acts as a trigger for the next wave of buyers who were patiently waiting on the sidelines for their entry signal.
This pattern is just one of many essential tools in a trader's arsenal. Building a solid foundation by mastering the most common formations is a non-negotiable skill. If you're looking to expand your knowledge, our guide on the top 8 day trading chart patterns every trader should know is a great place to start.
By repeatedly reviewing these real-world examples, you'll train your brain to spot the subtle cues that define a high-probability setup. You'll start to internalize the natural rhythm of price and volume, moving beyond just following mechanical rules to developing a more intuitive feel for how markets truly behave.
How to Avoid False Breakouts and Confirm Signals
Just spotting a picture-perfect bullish flag isn’t enough. That's only half the battle. The most disciplined traders I know understand that a pattern alone never justifies putting real money on the line. Lasting success in the markets comes from managing risk and demanding confirmation—those extra pieces of evidence that stack the odds firmly in your favor.
Think of it like a detective building a case. A single clue is just a starting point, not a conviction. You need corroborating evidence, like witness statements and physical proof, to be sure. It's the same with trading. You should never trade a bullish flag in a vacuum. You need to verify the signal before you commit.
The most common trap here is the dreaded false breakout. This is where the price pokes its head just above the flag’s resistance, tricking eager buyers into jumping in, only to slam right back down inside the channel. Avoiding these bull traps requires a healthy dose of discipline and a multi-layered confirmation process.
Volume: The Ultimate Confirmation Tool
If there's one confirmation signal you should never ignore, it's trading volume. Volume is the market's truth serum. It reveals the real conviction—or lack thereof—behind any price move. A breakout on weak, anemic volume is a massive red flag and often a prelude to failure.
Here’s the ideal sequence you want to see:
- Low Volume During Consolidation: As the flag itself forms, you should see volume dry up. This tells you that sellers are losing steam and don't have the power to push the price down significantly. It's a sign of a healthy pause.
- High Volume on Breakout: This is the moment of truth. When the price breaks above the flag's upper trendline, you must see a significant surge in volume. This is your proof that buyers have stormed back into the market, ready to overwhelm the sellers and power the next leg up.
A breakout that lacks this volume spike is highly suspicious. It suggests there isn't enough institutional buying power behind the move, making it much more likely to fizzle out.
Using Indicators for a Second Opinion
While volume is your go-to confirmation, other technical indicators can offer a valuable second opinion. They help you get a feel for the broader market momentum and confirm whether conditions are truly ripe for the uptrend to resume. A fantastic tool for this is the Relative Strength Index (RSI).
The RSI is a simple momentum oscillator that measures how fast and how far prices have moved, on a scale of 0 to 100. It helps you identify when an asset might be "overbought" (typically above 70) or "oversold" (typically below 30).
When you see a bullish flag taking shape, take a quick look at the RSI. If it's hovering in neutral territory—say, around 50 or 60—it suggests the stock has plenty of gas left in the tank for another push higher. This adds another layer of confidence to your trade idea.
A breakout from a bullish flag is much more likely to succeed when the RSI is in neutral or moderately bullish territory, signaling that the trend has energy left for another push.
On the other hand, if the price is breaking out while the RSI is already deep in overbought territory (above 70 or 80), it’s time to be cautious. This could be a "late-stage" breakout that's exhausted and prone to a quick reversal.
Spotting and Sidestepping the False Breakout
Getting caught in a false breakout, or "bull trap," is one of the most frustrating things that can happen to a trader. The secret to sidestepping it comes down to two things: patience and discipline. Instead of rushing in the second the price ticks above the resistance line, wait for more definitive proof.
One of the most effective techniques is simply waiting for a candle to close above the resistance line on your chosen timeframe. A quick wick poking above the line means very little; a solid candle body closing above it shows much stronger commitment from buyers. This one simple act of patience can filter out a surprising number of false signals.
Statistically, the bull flag is a robust pattern, but its reliability really hinges on these confirmation factors. Research shows that bull flags are most effective when they appear in a strong, established uptrend. In these conditions, a bull flag can signal a continuation of the trend about 75% of the time, though this depends on market conditions and the strength of the initial flagpole. The height of that flagpole can also give you a rough idea of the potential price move after the breakout. You can discover more insights about bull flag statistics on axi.com.
By combining pattern recognition with a sharp eye for volume, a quick check of your indicators, and patient entry tactics, you stop being just a pattern spotter and become a true risk manager. It’s this disciplined approach that separates traders who get lucky from those who build long-term consistency.
Common Questions About the Bullish Flag Pattern
 Even after you get the hang of the basic structure and trading rules, questions always pop up when you're trying to use the bullish flag pattern in a live market. Let's run through some of the most common sticking points traders face.
Think of this as a quick FAQ to clear up any lingering doubts. Getting these details right is often what separates a confident, well-managed trade from a hesitant one.
What Is the Ideal Timeframe for a Bull Flag to Form?
This is a classic question. Does the bull flag work better on a 5-minute chart or a weekly chart? The simple answer is: both. The pattern is fractal, which is just a fancy way of saying it appears and works across all timeframes. You can day trade a bull flag on a 5-minute chart just as effectively as you can swing trade one on a daily.
What matters isn't the timeframe itself but the proportionality of the pattern on that chart. A flag forming on a daily chart might take weeks to consolidate, while an intraday flag could resolve in a few hours. The key is that the flagpole is a sharp, aggressive move and the flag is a clear, low-volume rest stop relative to the chart you are looking at.
How Steep Should the Flagpole Be?
The steepness of the flagpole is a huge tell about the pattern's potential. Ideally, you want to see a sharp, almost vertical surge in price. This kind of explosive move signals intense, impulsive buying pressure—the very fuel that powers the entire setup.
A slow, grinding move that just kind of blends in with the prior trend doesn't cut it. That lacks the conviction and power you need to see from buyers. This distinction is critical because a weak flagpole often leads to an unreliable pattern that's more likely to fail.
Can a Bull Flag Slope Upwards Instead of Downwards?
This is one of the most important questions because it separates a real bull flag from a deceptive trap. A classic, high-probability bullish flag absolutely must slope down against the primary trend or, at the very least, move sideways in a tight horizontal range. This gentle downward drift on low volume is the market telling you that sellers are exhausted and have no real power.
If you see a "flag" that's sloping upwards, that's a major red flag. This isn't a bull flag at all; it's a completely different and often bearish pattern called a rising wedge. An upward-sloping channel shows that buying pressure is fading with each new high. Never mistake it for a bull flag.
Key Takeaway: A textbook bullish flag pattern features a gentle downward slope, indicating a healthy and temporary pullback. This shows that while some profit-taking is occurring, sellers lack the strength to reverse the primary uptrend.
Ready to find high-probability bullish flag patterns before they break out? ChartsWatcher provides powerful scanning and charting tools to help you identify these setups across the market in real time. Customize your dashboards, set precise alerts, and stop missing opportunities.
