A Trader's Guide to Open Range Breakout Strategy
The open range breakout strategy is a classic day trading setup that hones in on the high and low of the first few minutes of a trading session to find potential entry points. At its core, it's about waiting for the price to make a decisive move beyond this initial range, which can signal a strong directional bias for the rest of the day. This simple, rules-based approach has long been a go-to for traders looking to ride the wave of early market momentum.
Understanding the Core Logic of Breakout Trading
The open range breakout strategy, or ORB for short, is built on a simple yet powerful idea: the first few moments of the trading day often set the tone for what's to come. Think about it. This is when a flood of orders hits the market as traders react to overnight news, earnings reports, and pre-market sentiment.
This initial flurry of activity carves out a temporary price range. A breakout from that range often tells you which side—the bulls or the bears—is winning the early battle.
The strategy boils down to watching two key levels:
- The Opening Range High: This is the highest price a stock hits within a specific initial window, like the first 5, 15, or 30 minutes. A clean break above this level is a bullish signal.
- The Opening Range Low: This is the lowest price reached in that same timeframe. A break below this level points to building bearish pressure.
Traders essentially use these levels as tripwires. When the price moves decisively above the range high, it signals a potential long (buy) trade. Conversely, a drop below the range low indicates a possible short (sell) setup.

Why This Approach Works
The logic behind the ORB is all about market psychology and order flow. The opening range acts as an early, temporary point of balance. When the price breaks out, it suggests a new consensus is forming and the path of least resistance has been found. This initial move often pulls in more and more traders, adding fuel to the fire and strengthening the trend.
The real secret to the open range breakout isn't just about spotting the levels; it's about judging the conviction behind the move. A breakout that happens on a huge surge in trading volume is far more trustworthy than one that limps along on weak volume. Volume confirmation is your best friend for telling a real trend from a costly head fake.
Before jumping into this strategy, it's crucial to have a firm grasp of its moving parts. The table below breaks down the essential components you'll need to understand.
Key Elements of the Open Range Breakout Strategy
| Component | Description | Critical Consideration |
|---|---|---|
| Opening Range | The high and low price points established within a set time after the market opens (e.g., first 5-30 minutes). | The chosen time frame (5, 15, or 30 mins) can significantly impact signal frequency and reliability. Shorter times are more sensitive, while longer times are more conservative. |
| Breakout | A decisive price movement that closes above the opening range high (bullish) or below the opening range low (bearish). | The "decisiveness" of the break is key. A small poke above the high isn't enough; you want to see a strong, committed move. |
| Volume Confirmation | An increase in trading volume accompanying the breakout, confirming institutional interest and conviction. | A breakout on low volume is a major red flag. It often leads to "false breakouts" or reversals. Always check the volume. |
| Entry Signal | The specific price point at which a trader enters a long (buy) or short (sell) position, typically just above/below the breakout level. | Pre-defining your entry rules removes emotion and hesitation when the moment comes. |
| Stop-Loss | A pre-determined price level to exit the trade if it moves against you, protecting your capital. | A common placement is just below the breakout level for a long trade, or just above it for a short trade. |
| Profit Target | The price level at which you plan to exit the trade to lock in gains. | Can be based on a fixed risk-reward ratio (2:1, 3:1), a trailing stop, or key technical levels on the chart. |
Understanding these elements is the foundation of building a robust ORB trading plan. Each piece works together to create a systematic approach, helping you navigate the chaotic opening minutes of the market with a clear head.
Ultimately, mastering this strategy is about more than just drawing lines on a chart. It demands an understanding of context, the discipline to wait for confirmation, and ironclad risk management. If you're new to the idea, our guide on achieving success with the open range breakout for day trading is a fantastic place to start.
How to Build Your ORB Trading Plan
Okay, so you understand the theory behind the open range breakout. Now for the hard part: turning that knowledge into a concrete trading plan you can actually execute. This isn't just about jotting down a few ideas; you need a non-negotiable blueprint for every single trade. When the market is moving fast and your money is on the line, a solid plan is what keeps emotion and hesitation out of the picture. It’s what separates disciplined trading from gambling.
The first real decision you have to make is picking the timeframe for your opening range. There’s no magic answer here. The best choice really comes down to your personal trading style and the specific asset you're watching.
- The 5-Minute Range: This one's for traders who like speed. You’ll get a lot more potential signals, but you also have to be ready for more false breakouts and "whipsaws." This demands quick reflexes and a stomach for higher-frequency action.
- The 15-Minute Range: For many, this is the sweet spot. It does a decent job of filtering out the initial market noise you'd see on a 5-minute chart but still serves up timely signals. It’s a very popular choice for day trading stocks.
- The 30-Minute Range: This is the most conservative approach. By waiting a full half-hour, the range becomes more established and, often, more reliable. The breakouts can be more powerful, but the trade-off is fewer signals and usually a wider initial stop-loss.
With your timeframe locked in, it's time to nail down your entry and exit rules. These need to be crystal clear. There can be no room for guesswork when you're in the heat of the moment.
Defining Your Entry Rules
Your entry trigger is the specific event that screams, "Go!" For an ORB strategy, that's obviously a price move past the range high or low. But you need to be more precise than just that.
A common and effective rule is to wait for a full candle to close above the range high (for a long) or below the range low (for a short). This simple patience provides far more confirmation than just jumping in the second the price pokes through the level—which can often be a "head fake" designed to trap eager traders.
This is the basic flow for spotting a setup.
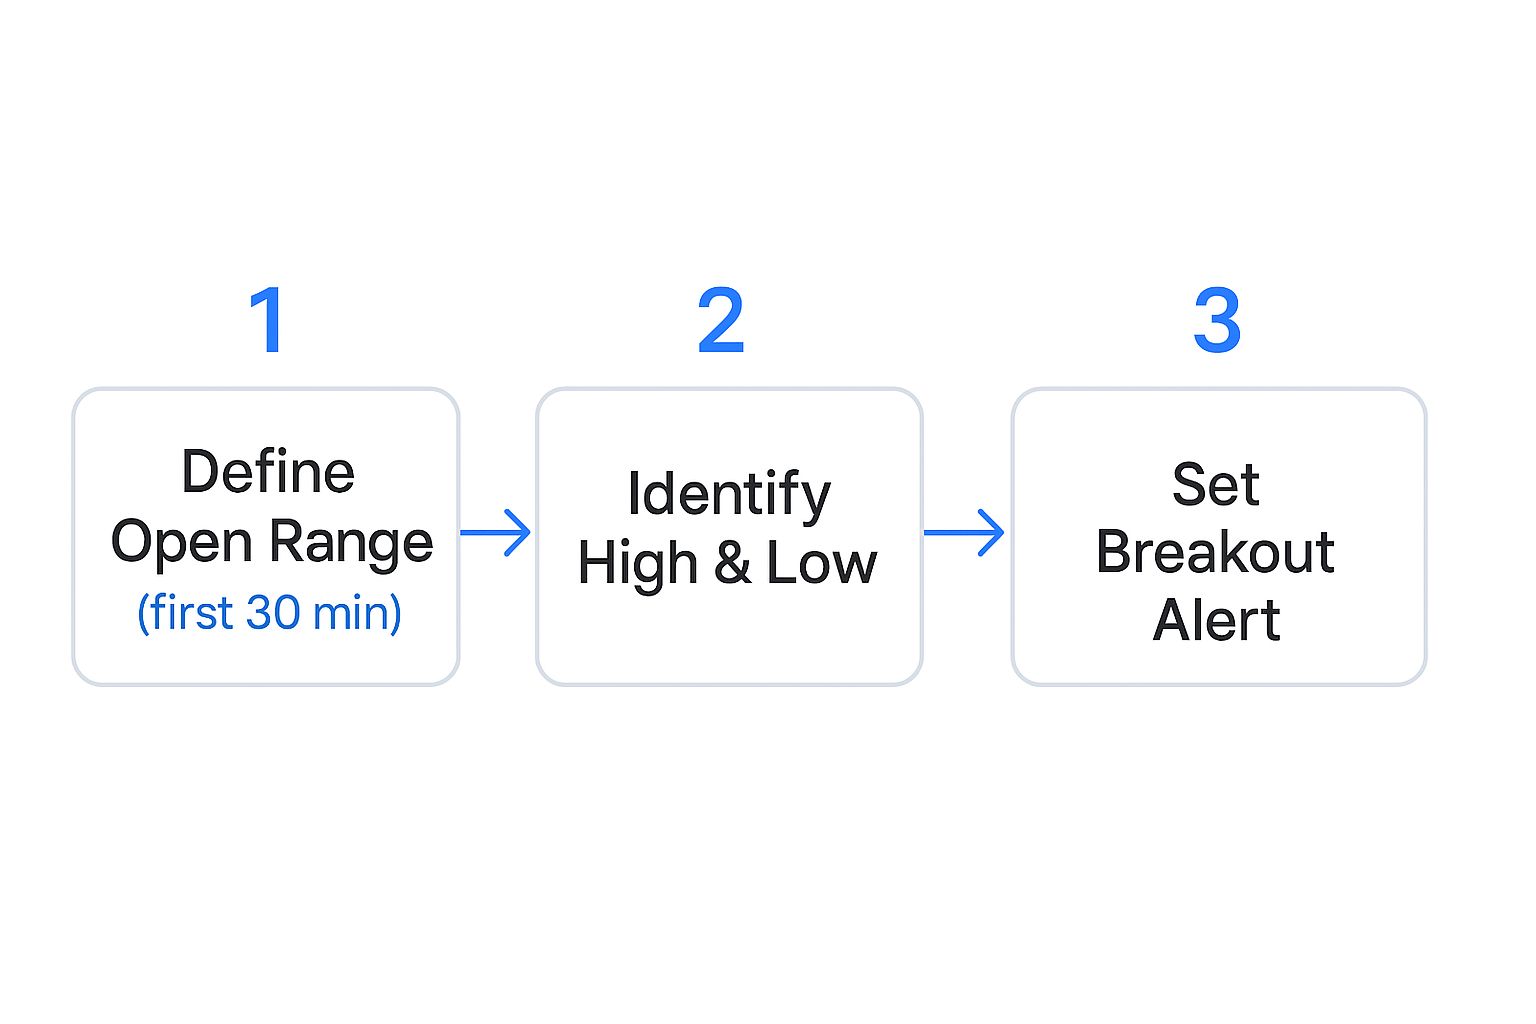
As you can see, it all starts with defining that initial range. Then you mark the boundaries and get ready for a potential breakout.
Setting Your Stop-Loss and Profit Targets
Risk management is everything. Seriously. It’s the cornerstone of any plan that has a shot at long-term success. Your stop-loss is your safety net, defining the absolute maximum you’re willing to lose on any given trade.
For a long breakout trade, the logical place for your initial stop-loss is just below the low of the opening range. For a short, it’s just above the high. This placement makes perfect sense: if the breakout fails and the price reverses all the way back through the range, you're out with a manageable, pre-defined loss.
Your profit targets are the other side of the coin, defining your exit on a winning trade. These have to be set before you even enter the trade.
A disciplined trader knows their exit points—for both a profit and a loss—before they ever click the "buy" or "sell" button. The goal is to make trading a systematic process, not an emotional reaction.
One of the simplest ways to set a profit target is with a fixed risk-to-reward ratio. For instance, if your stop-loss represents a risk of $50, a 1:2 risk-reward ratio means your profit target would be set at a level that banks you a $100 gain.
Another powerful method is to use the chart itself to find key technical levels that could act as roadblocks. Look for things like:
- The previous day's high or low
- Major pivot points from recent price action
- Significant moving averages
By setting your profit target just under a key resistance level (for a long trade) or just above a key support level (for a short), you dramatically increase the odds of your target getting hit before the price has a chance to turn around. Having this complete, written plan—covering your timeframe, entry, stop, and target—is what will ultimately elevate you from a gambler to a trader.
Taking Your Breakout Trades to the Next Level
Once you’ve got the hang of the basic open range breakout, it's time to start layering in some more advanced techniques. This is where you really start to separate yourself from the novice crowd. These refinements add critical layers of confirmation that can seriously improve your trade selection and, ultimately, your profitability. Moving beyond a simple price break is how you gain a real, sustainable edge.
The first and, in my experience, most important enhancement is learning to read volume. Price tells you what is happening, but volume tells you the conviction behind the move. A breakout that explodes on a massive spike in volume has a much higher chance of follow-through than one that just kind of limps over the line on weak interest.
Why? High volume suggests the big players—the institutions—are getting involved. They’re the ones with the deep pockets needed to fuel a real trend. On the flip side, a breakout on below-average volume is a huge red flag. It often means there isn't broad participation, which dramatically increases the odds of a "false breakout"—a nasty reversal that traps hopeful traders. Learning to read the volume bar is just as critical as reading the price candle itself.
Using Volatility for Dynamic Exits
Static stop-losses and profit targets are fine to start, but they’re rigid. They don’t adapt when the market gets choppy or goes quiet. A much smarter approach is to use volatility to set dynamic, more responsive exit points. The Average True Range (ATR) indicator is my go-to tool for this.
The ATR essentially measures a stock's typical daily price movement, giving you a number that quantifies its recent volatility. You can then use this data to tailor your stops and targets to what the stock is actually doing on that specific day.
Here’s how you can put it into practice:
- Setting Your Stop-Loss: Instead of just placing a stop right below the opening range, try setting it 1.5x ATR below your entry price. On a really volatile day, this gives your trade the room it needs to breathe and helps you avoid getting shaken out by normal price swings.
- Setting Your Profit Target: You can do the same for your target. Aiming for a profit of 3x ATR above your entry, for example, ensures your target is realistic based on how much the stock is capable of moving.
This method makes your risk management fluid. It adapts automatically, whether the market is calm or chaotic.
A core principle of professional trading is confluence. A setup becomes exponentially stronger when multiple, independent signals all point in the same direction. A price breakout, confirmed by heavy volume, and moving in sync with the overall market trend is a combination you should always be looking for.
Aligning with the Broader Market
Here’s a hard truth: no stock trades in a vacuum. The overall market has a powerful gravitational pull. This is why trading an open range breakout in alignment with the broader market trend can massively stack the odds in your favor. Before you even think about pulling the trigger, you need to check the direction of the major index futures, like the SPY (for the S&P 500) or the QQQ (for the Nasdaq 100).
Imagine you spot a perfect bullish ORB setup in a tech stock, but the QQQ is getting hammered and breaking down. That’s a trade you should probably pass on. The selling pressure from the wider market can easily snuff out the buying interest in your one stock, turning a great-looking setup into a frustrating loss.
Conversely, going long on a breakout when the whole market is rocketing higher gives your trade a powerful tailwind. You’re swimming with the current, not fighting against it. This simple filter is one of the best ways to weed out low-probability trades and focus your capital where it has the best chance to succeed.
Think of it as building a case for your trade. Each layer of confirmation—strong volume, adaptive exits, and market alignment—adds another piece of evidence. While the basic open range breakout is a solid strategy on its own, integrating these advanced techniques is what truly transforms it into a robust, professional trading method.
Managing Risk and Avoiding Common ORB Pitfalls
Nailing a perfect open range breakout entry feels fantastic, but that's not what keeps you in the game. Real, consistent profitability is forged in the less glamorous world of risk management.
Even the most picture-perfect setups can and will fail. How you handle those failures is what separates a long-term trading career from a short, frustrating one. The most critical piece of this puzzle is managing your position size.
Calculating Your Position Size
Your share count should never be a gut feeling. It has to be a calculated decision based on two things: how much of your account you're willing to lose, and the specific risk on that one trade (the distance to your stop-loss).
A solid rule of thumb is to risk no more than 1% of your account on any single trade.
Let's walk through an example. If you have a $25,000 account, 1% is $250. Now, say your ORB setup gives you a clear stop-loss that's $0.50 away from your entry price. Your position size is a simple calculation: $250 / $0.50 = 500 shares. This mathematical discipline strips emotion from the decision and ensures that one bad trade can't cripple your account.
Navigating Common Traps and False Breakouts
Beyond position sizing, a few common pitfalls can easily derail an otherwise solid ORB strategy. Learning to spot these traps before you step in them is a skill you'll develop through experience and sharp observation.
One of the most frequent mistakes is chasing extended breakouts. You see a stock rocket through its opening range high and run hard without you. FOMO kicks in. You jump in late, often right as the early birds are cashing out and taking profits. This almost guarantees you get the worst possible price, right before a pullback.
Another major pitfall is trying to force ORB trades in choppy, low-volume markets. This strategy needs momentum and conviction to work. When the broader market is just churning sideways or volume is thin, breakouts are far more likely to fail. These "head fakes" look real for a moment but quickly reverse, trapping anyone who jumped the gun.
A "head fake" is the market's way of testing commitment. It will push just past a key level to trigger breakout orders, only to slam back into the range, fueled by the stop-losses of newly trapped traders. Your job is to avoid being that liquidity.
The key to surviving a false breakout is having your stop-loss in a logical place from the start—often just back inside the opening range. When a breakout attempt fails and the price retreats back into that range, your plan should be to get out immediately. Don't hang on and hope. A failed breakout is a crystal-clear signal that your initial idea was wrong.
The Evolving Edge of the ORB Strategy
It's also crucial to face a hard reality about this popular setup. Despite its fame, quantitative backtesting shows that the effectiveness of the basic Opening Range Breakout strategy has been declining, especially in major markets. The edge has been "priced in"—so many traders are watching the same levels that the simple breakouts no longer offer a reliable advantage. Backtests on the S&P 500, for example, show that by 2025, a pure ORB approach just doesn't cut it anymore. You can learn more about the statistical evidence behind the ORB strategy for a deeper dive.
This doesn't mean the strategy is dead. It just means you have to be smarter about it.
The most successful ORB traders today don't take the pattern in a vacuum. They use it as a foundation and add their own filters to stack the odds in their favor.
Here are a few ways to refine the basic setup:
- Volume Confirmation: Only take breakouts that happen on a significant surge in relative volume. No volume, no conviction.
- Market Context: Trade in line with the broader market's direction. For example, focus on long breakouts only when the SPY is in a clear uptrend.
- Volatility Filters: Use a tool like ATR (Average True Range) to screen out setups. If volatility is too low, there's no fuel for a move. If it's too high, your stop-loss might be impossibly wide.
By blending the core ORB principles with disciplined risk management and intelligent filtering, you can transform a simple pattern into a robust framework for attacking the market's open.
How To Scan For High-Potential ORB Setups
If you're manually flipping through dozens of charts every morning, you're going to miss the best trades. It's a surefire way to get overwhelmed and let prime opportunities slip by.
To trade any open range breakout strategy effectively, you absolutely need an automated process to bring the most promising stocks to you. This is where a real-time market scanner becomes your most valuable weapon, sifting through thousands of tickers to find the handful that actually meet your criteria for a high-potential trade.
Using a platform like ChartsWatcher, you can build a custom scanner that automates this entire discovery process. This frees you from the frantic pre-market search and lets you focus your mental energy on what matters: analysis and execution. The whole point is to filter out the market noise and zero in on stocks that are truly "in play" and have the liquidity for a clean breakout.
Building Your Core Scanner Criteria
Your scanner is only as good as the rules you give it. If your filters are too vague, you'll get a list of mediocre, choppy stocks. If they're too tight, you might end up with nothing to trade. It’s all about finding that sweet spot that highlights stocks with unusual pre-market activity and enough volume to trade cleanly.
Here are the essential filters to build into your morning scanner:
- Minimum Share Price: Start by setting a minimum price, like $5 or $10. This immediately weeds out penny stocks, which are often far too volatile and easily manipulated for a reliable ORB strategy.
- Minimum Average Daily Volume: Liquidity is non-negotiable. I like to set a filter for at least 500,000 shares of average volume over the last 30 or 90 days. This ensures you can get in and out of your trades without fighting significant slippage.
- Pre-Market Volume: This is a huge tell. A stock trading over 100,000 shares before the opening bell is clearly on other traders' radars, usually because of news or an earnings report. It’s a sign of real interest.
- Pre-Market Price Change: Filter for stocks that are already gapping up or down. A minimum pre-market move of +/- 2% helps you focus on names that have a catalyst driving the action.
These filters will give you a manageable watchlist of stocks that are already showing signs of life before the market even opens. This is your core pool of candidates for the day. For a deeper look into the mechanics, you might be interested in our guide on how to use a stock screener with 7 smart investing tips.
Refining Your Scan With Relative Volume
While absolute volume is a great starting point, the real magic is in relative volume (RVOL). This metric compares a stock's current volume to its average volume for that same time of day.
Think about it: an RVOL of 5.0 means the stock is trading at five times its normal volume. That’s a powerful signal of institutional interest or heavy retail participation.
Adding an RVOL filter is one of the most effective ways to confirm that a pre-market move is legitimate. A stock gapping up 3% on low RVOL is far less interesting than one gapping up 3% with an RVOL of 10.0 or higher.
A high relative volume is the market's way of shouting that something important is happening with a particular stock. Ignoring this signal is like trying to trade with earmuffs on; you're missing a critical piece of the story.
The screenshot above shows how a custom scanner in ChartsWatcher can lay out all this critical data side-by-side. You can see pre-market volume, price change, and other key metrics in a clean, actionable format. This organized view allows for a quick assessment, helping you instantly identify which tickers deserve a spot on your primary watchlist for a potential ORB trade.
Common Questions About the Open Range Breakout
Even with a solid strategy in hand, a few questions always pop up when the market opens and things get real. Let's tackle some of the most common ones I hear from traders trying to master the open range breakout.
What’s the Best Time Frame for the Opening Range?
There's no magic answer here; the "best" time frame really boils down to your personal trading style and the personality of the stock you're watching.
A 5-minute range is the most aggressive. It's highly sensitive and will give you more trade signals, but be prepared for more noise. You'll see more false breakouts and whipsaws that can easily shake you out of a perfectly good trade.
On the other end of the spectrum, a 30-minute range is the conservative play. It gives the market more time to settle down, so the range is often more stable and breakouts tend to be more reliable. The trade-off? Fewer signals and usually a wider stop-loss, which means you're risking more on each trade.
For many traders, the 15-minute range hits the sweet spot. It does a decent job of filtering out that initial 5-minute chaos while still being responsive enough to catch the main move of the day. My advice is to paper trade all three and see which one feels right for you and the stocks you trade.
Can This Strategy Be Used on Any Stock?
Absolutely not. Trying to use the open range breakout on just any old stock is a quick way to get frustrated. This strategy thrives on stocks with two critical ingredients: liquidity and daily volume.
You want to hunt for stocks that are "in play"—maybe they have a major news catalyst or just reported earnings. These are the names with a ton of eyes on them and capital flowing in, which gives them a much better shot at making a clean, sustained move.
Steer clear of low-volume, illiquid stocks. They're notorious for choppy price action and wide bid-ask spreads, making it incredibly difficult to get a clean entry and exit. A clean breakout is a rare sight on these tickers.
The success of an open range breakout often hinges less on the pattern itself and more on the quality of the stock you choose to trade. A great setup on a poor-quality stock will almost always fail.
What Happens If a Trade Fails Immediately?
It happens. A quick, sharp reversal right after a breakout is a classic risk of this strategy. We call it a "false breakout" or a "breakout failure," and it's precisely why your stop-loss isn't just a suggestion—it's your lifeline.
Think about it: if the price pokes its head out of the range and then immediately dives back inside, that's a huge tell. It screams that the initial move had zero conviction. This is the worst time to sit there and hope things turn around. Your stop-loss, placed just back inside that original range, should take you out of the trade automatically.
This is how you protect yourself from a much bigger loss if the stock completely reverses. Taking a small, planned loss on a failed breakout is just the cost of doing business in trading.
What Is the Real Success Rate of This Strategy?
It's really important to have realistic expectations. A massive analysis of 50,000 Opening Range Breakout trades on S&P 100 stocks showed that the win rate, across 5, 15, and 30-minute time frames, sits right around 52-53%. That's a slight statistical edge, but it's not much better than a coin flip.
Interestingly, the data hinted that the shorter 5-minute range might have a slightly better success rate. But don't get too excited—a win rate just over 50% doesn't automatically mean you'll be profitable. Your overall success will come down to disciplined risk management and picking the right stocks in the first place. You can dive deeper into the statistical findings of the ORB strategy to really understand the numbers. The data proves that while the strategy can point you to potential moves, the real edge is found in your execution.
Ready to stop searching and start finding high-potential setups? ChartsWatcher gives you the power to build custom real-time scanners, backtest your strategies, and organize your trading day with unparalleled control. Automate your discovery process and focus on what truly matters—execution. Explore our powerful tools today at https://chartswatcher.com.
