Master the Opening Range Breakout for Day Trading Success
Understanding The Opening Range Breakout Foundation
The Opening Range Breakout (ORB) strategy is a classic approach used by many traders. It focuses on the market's first few minutes to predict price direction for the day. This initial period often sees intense activity between institutional and retail traders, with experienced players sometimes using these early movements to their advantage. What makes these opening moments so important, and how can traders use this information effectively?
The opening range refers to the highest and lowest price reached during a specific timeframe after the market opens, typically the first 5 to 60 minutes. This range sets a baseline for the day’s trading, giving traders a framework for anticipating potential breakouts. Think of it like a coiled spring: a tighter range suggests more potential energy for a strong price move once the range is broken. Understanding how this range forms is the first step in mastering the ORB strategy.
The ORB strategy has its roots in the work of traders like Toby Crabel and Mark Fisher. They developed specific methods for defining the opening range (the high and low within the first 5 to 60 minutes) to predict the day’s price movement. The core principle is simple: a price breaking above the morning's high signals bullish momentum, while a break below the low signals bearish momentum. Want a deeper dive into opening range breakouts? Check out this resource: The Trading Analyst Over time, this foundational strategy has been adapted and refined, leading to modern variations of the ORB.
Why the Opening Range Matters
The opening range is significant because it often reflects the initial sentiment and intentions of both large institutional traders and individual retail traders. Large institutional orders can heavily influence price during these early minutes, effectively setting the tone for the remainder of the day. For example, a substantial buy order could push the price up, creating a higher opening range high. This high can then act as a point of attraction, drawing in more buyers if the price breaks above it.

The opening range also helps identify key support and resistance levels. The high and low of the range often serve as important markers. Traders watch closely for breaks above or below these levels. This creates a self-fulfilling prophecy: a breakout can trigger more buying or selling, accelerating the price movement. Understanding the psychology behind the opening range can give traders a valuable advantage.
The Evolution of the ORB Strategy
While the basic principles of the ORB strategy remain the same, its application has evolved. Modern algorithmic trading now incorporates ORB principles. This enables automated trade execution based on pre-set rules. This has increased the speed and efficiency of spotting and acting on breakout opportunities.
The human element is still essential, however. Experienced traders often combine algorithmic signals with their own market analysis. They consider factors such as trading volume, news events, and overall market sentiment to refine their ORB strategies. This combination of technology and human insight continues to shape the evolution and effectiveness of the opening range breakout strategy in today's markets.
Setting Up Your Opening Range Breakout Parameters
Success with opening range breakouts (ORBs) starts with a solid setup. This means choosing the right parameters based on your trading style and how much risk you're comfortable with. It's not a one-size-fits-all approach. It's about finding what works for you. Let's explore the key decisions every trader faces.
Choosing Your Time Frame
The first critical step is selecting the opening range time frame. This is the period used to define the high and low of the opening range. Popular choices include 15-minute, 30-minute, and 60-minute windows. Each time frame has its own pros and cons. Shorter time frames, like 15 minutes, can offer faster entries but are also prone to false breakouts. Longer time frames, like 60 minutes, can filter out some market noise but might lead to missed opportunities. The ideal time frame depends on your trading preferences and the current market conditions. You might find this helpful: How to master day trading chart patterns.
The following infographic compares the success rates and average pip movement across the 15-minute, 30-minute, and 60-minute ORBs.
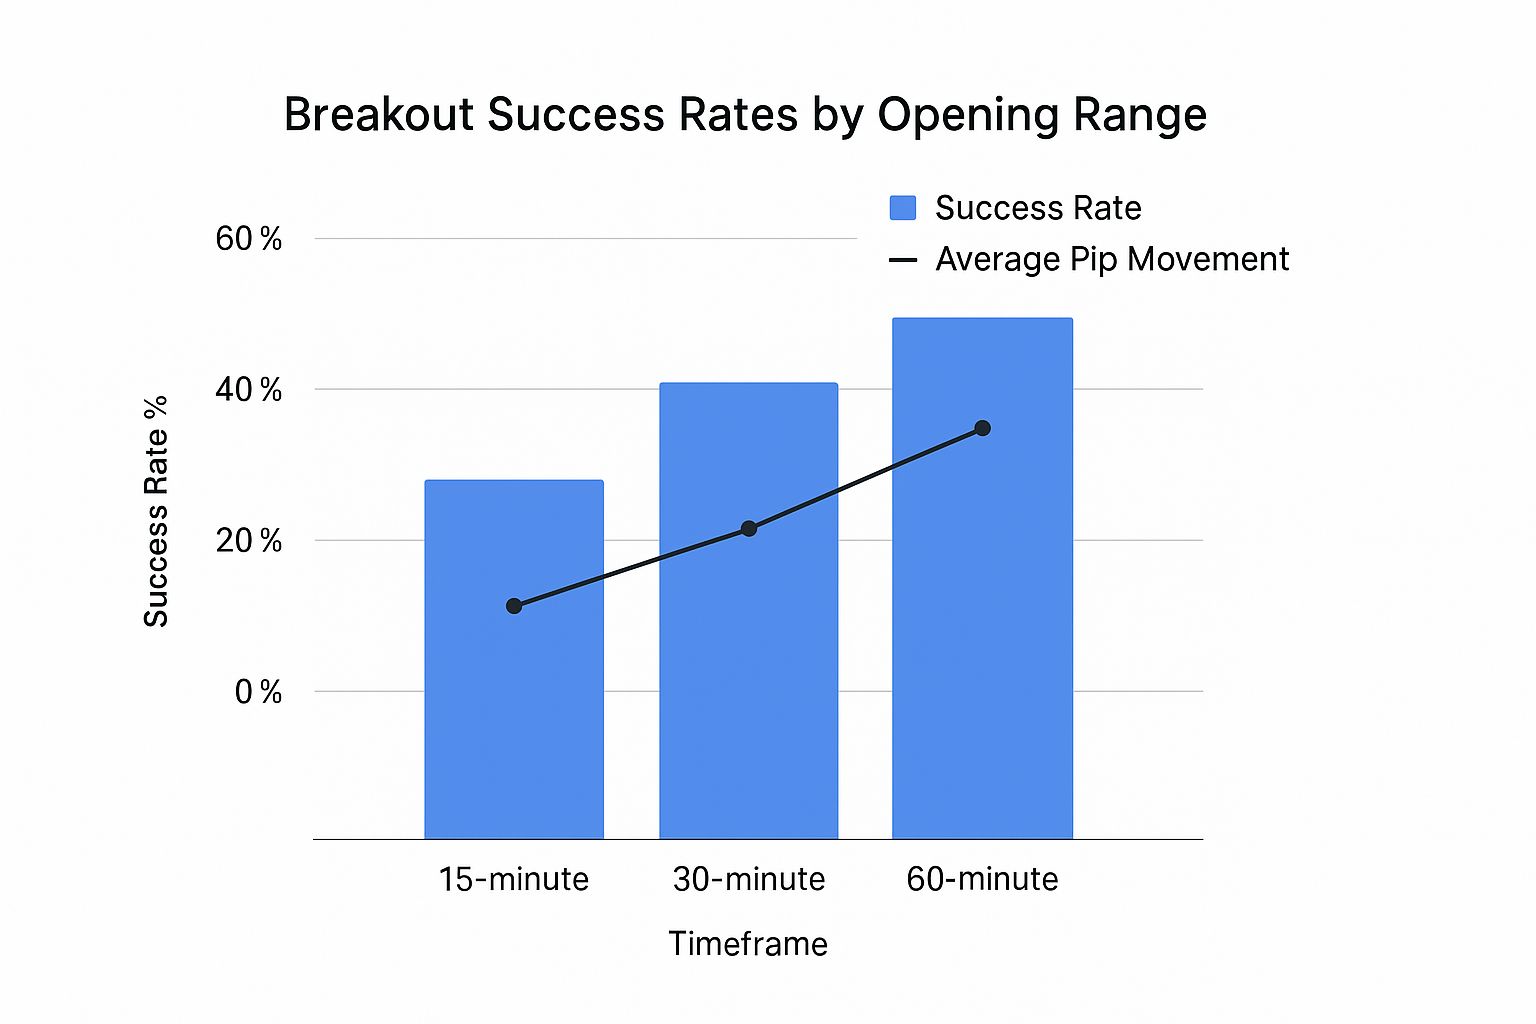
As you can see, the 15-minute time frame boasts the highest success rate, but the smallest average pip movement. On the other hand, the 60-minute time frame has the highest average pip movement but a lower success rate. This demonstrates the balance between how often you trade and how much you can potentially gain on each trade.
Let's look at the different time frames in more detail with a comparison table:
Opening Range Time Frame Comparison: This table compares different opening range periods, highlighting their pros, cons, and optimal market conditions.
| Time Frame | Best Market Conditions | Win Rate | Risk Level | Ideal For |
|---|---|---|---|---|
| 15-Minute | Trending Markets, Low Volatility | High (as per infographic) | High | Scalpers, Day Traders |
| 30-Minute | Balanced Markets, Moderate Volatility | Medium (as per infographic) | Medium | Swing Traders, Day Traders |
| 60-Minute | Range-Bound Markets, High Volatility | Low (as per infographic) | Low | Swing Traders, Position Traders |
This table illustrates the key trade-offs involved in selecting an opening range time frame. Shorter time frames offer more opportunities but with higher risk, while longer time frames offer fewer but potentially larger trades with lower risk.
Identifying Suitable Instruments
Not every financial instrument is suitable for ORB trading. Highly liquid instruments, like major forex pairs or index futures, tend to perform better due to tighter spreads and consistent volume. It's also essential to choose instruments that align with your available capital. Trading volatile instruments with limited capital can quickly lead to substantial losses. Also, consider the specific trading sessions. Some instruments might have more predictable opening range behavior during certain times, creating better opportunities.
Establishing Effective Entry Criteria
Precise trade entry is crucial for ORB success. Many traders wait for a candle to close completely outside the defined range before entering. This confirmation reduces the chance of false breakouts. But it can also mean slightly higher entry prices on winning trades. Some traders enter as soon as the price crosses the range boundary. This might capture more of the price move, but it also increases the risk of a false breakout. This is where your personal risk tolerance and trading style come into play.
Adapting to Market Conditions
A rigid ORB trading approach can be harmful. Experienced traders adapt their parameters based on the current market. During volatile periods, widening your stop-loss orders or using a longer time frame can be helpful. In quieter markets, tighter stop-losses and shorter time frames might be more appropriate. Consider pre-market activity and news events. Important news can cause wider opening ranges and increase the chance of strong breakouts, requiring adjustments to your usual parameters.
Setting Profit Targets and Stop-Losses
Clear profit targets and stop-loss levels are essential for managing risk and maximizing potential gains. Profit targets can be based on a fixed risk-reward ratio, technical support and resistance levels, or a blend of factors. Stop-losses are usually placed just outside the opposite side of the opening range to limit potential losses if the breakout fails. Remember, dynamic markets require dynamic adjustments. Constantly evaluate your risk tolerance and adjust your strategy based on real-time market behavior. This active approach is key to navigating the complexities of ORBs and improving your chances of success.
High-Probability Opening Range Breakout Identification
Not all opening range breakouts lead to profitable trades. Knowing how to identify high-probability setups is what distinguishes successful traders. This involves understanding both technical and fundamental factors that can significantly influence breakout success. Key elements include volume analysis, pre-market gap behavior, and overall market sentiment.
Analyzing Volume for Confirmation
Volume is crucial for confirming breakout strength. High volume during a breakout suggests strong conviction behind the price move, increasing the likelihood of continuation. On the other hand, low volume breakouts can signal a false breakout, a scenario where the price reverses back into the opening range. Think of volume as fuel for a price move: high volume propels the price forward, while low volume leads to a stall. Traders should look for rising volume alongside a breakout as confirmation.
The Significance of Pre-Market Gaps
Pre-market gaps offer clues about potential daily price action. A substantial gap, particularly one with high volume, can suggest strong underlying momentum. Furthermore, studies show that stocks with volatile early trading, often due to news or earnings, have a higher breakout probability. For example, stocks with earnings-related pre-market gaps historically have a 20-30% greater chance of significant directional continuation after an opening range breakout than on normal days. Explore this further: Opening Range Breakout Research. Pre-market analysis can be a powerful addition to an ORB strategy.
Gauging Market Sentiment
Overall market sentiment influences opening range breakout success. In a bullish market, upside breakouts are more likely to succeed, while bearish breakouts might encounter resistance. This is because market sentiment affects trader behavior, creating a bias. Using sentiment indicators like news, social media, and economic data, can add valuable context to opening range breakouts. For more information, read: How to master the opening range breakout strategy.
Recognizing False Breakouts
A major challenge in ORB trading is false breakouts. These happen when the price breaks out but quickly reverses, trapping traders. Recognizing early warning signs is crucial for capital preservation. These signs include low breakout volume, long upper or lower wicks on candlesticks at the breakout level, and a failure to accelerate after the breakout. Understanding these signals can help traders avoid losses.
Confirming Sustainable Moves
Beyond identifying breakouts, confirming their sustainability is essential. Look for confirming signals like a retest of the breakout level as support or resistance, or continued high volume. These confirmations boost the probability of a successful trade and reduce the risk of a false breakout. Using these confirmation techniques improves traders' ability to identify high-probability setups and overall trading outcomes.
Real-World Opening Range Breakout Performance Analysis
Analyzing real-world performance of opening range breakout (ORB) strategies is crucial for understanding their potential and limitations. This involves examining backtested data, understanding key performance metrics, and acknowledging the impact of various market conditions. Let's explore the numbers behind ORB strategies, focusing on practical application and informed decision-making.
Examining Backtesting Results
Backtesting allows us to apply ORB strategies to historical data, providing valuable insights into their behavior. Focusing on instruments like the S&P 500 futures offers a glimpse into real-world application. The ORB strategy has been quantitatively analyzed extensively, especially in the S&P 500 futures market.
Backtesting a 5-minute ORB strategy on the S&P 500 futures from past data has shown interesting results. Using the first 5 minutes to determine the opening range high and low, and then entering a trade upon breakout of this range, yielded notable results. Winning trades often showed an average gain exceeding 0.5% per trade, while the strategy exhibited a win rate around 55-60%.
For more detailed statistics, check out: Quantified Strategies
This analysis provides a statistical foundation for evaluating the strategy's potential.
Key Performance Metrics
Several key metrics help assess ORB performance:
-
Win rate: The percentage of winning trades. A high win rate is desirable but not the only important factor.
-
Average gain per trade: Reveals the typical profit generated by winning trades.
-
Average loss per trade: Quantifies the typical loss incurred by losing trades.
-
Maximum drawdown: Represents the largest peak-to-trough decline during a specific period and serves as a critical risk metric.
Together, these metrics offer a comprehensive performance overview.
Influence of Market Conditions
Market conditions greatly influence ORB performance.
-
Trending markets often favor ORB strategies, providing sustained momentum after breakouts.
-
Ranging or choppy markets can lead to false breakouts, hindering the strategy's effectiveness.
Volatility also plays a significant role. High volatility can magnify both gains and losses, while low volatility can result in smaller price movements and fewer opportunities.
Adapting your ORB strategy to different market conditions is essential. Wider stops might be necessary in volatile conditions, while tighter stops could be suitable in calmer markets.

Learning From Winning and Losing Trades
Analyzing both winning and losing trades provides valuable lessons. Winning trades illustrate favorable market conditions and successful breakout patterns. Losing trades highlight the risks of false breakouts, adverse market conditions, or ineffective entry/exit strategies.
By studying past trades, you can refine your approach, improve your ability to identify high-probability setups, and enhance your overall decision-making. This process of learning and adapting is key for long-term success with ORB trading. Understanding both the strengths and limitations through real-world analysis is essential for informed trading.
Managing Risk And Avoiding Opening Range Breakout Pitfalls
Even the best trading strategies come with risks, and the opening range breakout (ORB) is no exception. Achieving long-term success with this strategy requires disciplined risk management. This means understanding that false breakouts can happen, and having reliable techniques in place to protect your capital when trades don't work out. Let’s explore how to build a robust risk management plan for ORB trading.
Optimal Stop-Loss Placement
Stop-loss orders are essential for minimizing potential losses. A common practice is to place a stop-loss just beyond the opposite end of the opening range. For a bullish breakout, this means positioning the stop-loss slightly below the opening range low. This tactic can help limit losses if the breakout proves to be false. However, it’s important to consider the range width when setting your stop-loss. A wider opening range might necessitate a wider stop-loss to avoid being prematurely stopped out by typical price fluctuations.
Position Sizing Based on Range Width
Position sizing, or the amount of capital dedicated to each trade, plays a crucial role in managing risk. Basing your position size on the width of the opening range can help control your potential exposure. A wider range often suggests increased volatility, making a smaller position size more prudent. Conversely, a narrower range might justify a larger position size. This measured approach helps to avoid overexposure and ensures that no single trade can significantly impact your overall capital.
In wider ranges, traders should dedicate a smaller percentage of their capital to mitigate potential losses. Narrower ranges might allow for a slightly larger allocation, considering the potentially lower volatility. It's also important to evaluate your personal risk tolerance and adjust your position size accordingly.
Cutting Losses Versus Giving Trades Room to Breathe
A key aspect of successful trading is discerning when to cut losses quickly versus when to allow trades room to develop. A sudden price reversal following a breakout, particularly with diminishing volume, is often a sign of a false breakout. In these instances, promptly exiting the trade is crucial for damage control. Sometimes, however, the price may consolidate or slightly retrace before continuing in the breakout direction. This is when understanding market context, volume patterns, and other confirming signals becomes invaluable. Case studies from major markets like the E-mini S&P 500 futures offer real-world insights into ORB outcomes. Protective measures like stop losses placed within the opening range and breakout confirmations from volume spikes are crucial for reducing losses from false breakouts, estimated to occur 35-45% of the time in major futures markets. Explore this topic in more detail: Master the Opening Range Breakout Strategy.
Managing Drawdowns and Psychological Challenges
Periods of losses, or drawdowns, are an inevitable part of trading. Effective drawdown management is crucial for sustained success. Setting a predefined drawdown limit, a maximum acceptable percentage decrease in trading capital, helps safeguard against substantial losses. Like any strategy, ORB trading comes with specific psychological hurdles. The rapid pace of breakouts can lead to impulsive decisions fueled by fear or greed. Maintaining discipline and sticking to your trading plan, even during periods of loss, is paramount for achieving consistent profits.

Building Systematic Discipline for Consistent Profitability
Consistent profitability in ORB trading relies on systematic discipline. This involves a combination of strong risk management rules, clearly defined entry and exit criteria, and the mental fortitude to adhere to your plan even in challenging market conditions. Reviewing past trades, recognizing errors, and continuously improving your strategy are crucial steps in building the discipline necessary for long-term success. For instance, a detailed trading journal that documents your entries, exits, stop-losses, and the reasons behind each trade can help identify patterns and refine your decision-making process. By embracing these risk management principles and cultivating a disciplined approach, you can effectively navigate the intricacies of ORB trading and improve your likelihood of consistent profitability.
Advanced Opening Range Breakout Optimization Strategies
Want to take your opening range breakout (ORB) trading to the next level? It's time to explore advanced optimization strategies. These are the techniques that can give seasoned traders a real advantage. Think sophisticated filters, multi-timeframe analysis, and integrating ORB with other indicators. Let's dive in and bridge the gap between amateur and professional breakout trading.
Multi-Timeframe Analysis for Context
Using multi-timeframe analysis offers crucial context for your ORB trades. Looking at the larger timeframe reveals the overall trend, like the direction the market is heading in the long term. The smaller timeframe pinpoints precise entry and exit points, showing the best moments to act on the short term.
For example, imagine a bullish breakout on a 5-minute chart that also aligns with an uptrend on a 30-minute chart. This convergence increases the probability of a successful trade, confirming the upward momentum. On the other hand, a breakout against the larger timeframe trend could be a false alarm.
Combining ORB with Complementary Indicators
Adding complementary technical indicators to your ORB strategy can significantly improve accuracy. Indicators like the Relative Strength Index (RSI) and the Moving Average Convergence Divergence (MACD) can help confirm breakout momentum. They act as filters for weak signals.
A breakout with an RSI surge above 70 suggests strong bullish momentum. A bullish MACD crossover can further validate a bullish ORB breakout. Using these indicators together paints a clearer picture of the market.
Adapting to Different Market Regimes
Market conditions are constantly changing. A fixed ORB approach won’t always work. During trending markets, ORB strategies often excel, capturing big price movements. However, ranging or choppy markets can lead to false breakouts.
Adapting your ORB strategy means adjusting your timeframes, position sizing, and even the indicators you use. In volatile markets, wider stop-loss orders and longer timeframes can help. Calmer markets may call for tighter stops and shorter timeframes.
Volume Profile and Order Flow Analysis
Professional traders often use volume profile and order flow analysis to gain deeper market insights. Volume profile shows the trading activity at different price levels within the opening range. High volume near the breakout level suggests strong support or resistance.
Order flow analysis gives a detailed view of buying and selling pressure, highlighting potential breakout triggers and institutional activity. These advanced tools can significantly enhance your ability to find high-probability setups.
Incorporating Market Microstructure Insights
Understanding market microstructure, the study of how markets operate at a granular level, can give you an edge. Knowing how orders are processed, how liquidity affects price, and how different market participants interact can reveal subtle signals.
These insights, often missed by traditional technical analysis, can help you pinpoint the best breakout scenarios and refine your entries and exits.
To better understand the factors that contribute to successful opening range breakout trading, take a look at the following table:
Opening Range Breakout Success Factors
This table summarizes key factors influencing opening range breakout success, along with their impact, implementation method, and difficulty level.
| Success Factor | Impact on Win Rate | Implementation Method | Difficulty Level |
|---|---|---|---|
| Multi-Timeframe Confirmation | Significant | Analyze higher timeframes for trend confirmation | Intermediate |
| Complementary Indicators | Moderate | Use RSI, MACD, or other indicators to validate breakouts | Beginner |
| Market Regime Adaptation | Significant | Adjust parameters based on market volatility and trend | Advanced |
| Volume Profile Analysis | High | Identify high-volume nodes for strong breakouts | Advanced |
| Order Flow Interpretation | High | Analyze order book for institutional activity | Expert |
| Market Microstructure Insights | High | Understand order processing and liquidity dynamics | Expert |
As you can see, factors like multi-timeframe confirmation and market regime adaptation can significantly impact win rates. While incorporating complementary indicators is relatively easier to implement, mastering order flow interpretation and market microstructure insights requires more expertise.
Advanced Optimization Strategies in Action
By incorporating these advanced strategies, you can significantly optimize your opening range breakout trading. The goal is to transition from simply reacting to market moves to anticipating them with more accuracy. Remember, continuous learning and adaptation are key to mastering this approach.
Key Takeaways For Opening Range Breakout Success
This guide offers a practical approach to implementing opening range breakout (ORB) strategies. We'll cover essential checklists, risk management, performance analysis, and realistic expectations. The goal is to equip you with the knowledge and tools for trading ORBs with confidence and achieving consistent profitability.
Essential Setup Checklist
Before initiating any ORB trade, consider the following:
-
Defined Opening Range: Establish a consistent opening range period. Common durations are the first 15, 30, or 60 minutes of trading. Standardizing your range provides a consistent framework for identifying breakouts.
-
Liquid Instruments: Trade highly liquid instruments, such as major forex pairs or index futures. Liquidity ensures efficient trade execution with tighter spreads, minimizing slippage.
-
Capital Preservation: Select instruments appropriate for your capital base. Avoid risking a significant portion of your capital on any single trade.
-
Clear Entry Criteria: Define your entry trigger. Will you enter upon a candle closing outside the range, or as the price crosses the boundary? Closing candles provide confirmation, while boundary crosses offer quicker entry but increased false breakout risk.
Risk Management Reminders
Effective risk management is paramount for long-term ORB trading success.
-
Stop-Loss Placement: Set stop-loss orders just outside the opposite end of the opening range to limit potential losses. Adjust stop-loss placement based on the range width.
-
Position Sizing Strategy: Adapt your position size according to the opening range width and your risk tolerance. Wider ranges typically indicate increased volatility, making smaller positions more prudent.
-
Exit Strategy: Develop a clear exit strategy for both winning and losing trades. Consider trailing stops for winning trades to lock in profits. For losing trades, exit promptly when the breakout reverses.
Performance Tracking and Analysis
Regular performance reviews are crucial for continuous improvement.
-
Maintain a Trading Journal: Document each trade, including entry/exit prices, stop-loss/take-profit levels, and your rationale. This allows for pattern recognition and analysis of strengths and weaknesses.
-
Analyze Key Metrics: Monitor key performance indicators (KPIs) like win rate, average win/loss ratio, maximum drawdown, and profit factor. These metrics provide a quantitative assessment of your strategy’s effectiveness.
-
Adapt to Market Conditions: Recognize that market conditions impact ORB success. Trending markets often favor ORBs, while ranging markets increase the likelihood of false breakouts. Adapt your strategy accordingly.
Realistic Expectations and Common Mistakes
Understanding ORB limitations and common pitfalls is important for managing expectations.
-
Not All Breakouts Are Winners: Accept that false breakouts occur. Concentrate on identifying high-probability setups with confirming signals like increased volume.
-
Overtrading: Avoid entering every breakout. Focus on quality setups that align with your predefined criteria.
-
Ignoring Market Context: Consider the broader market sentiment, news events, and overall trend. Breakouts against the prevailing trend have a lower probability of success.
Maintaining Discipline During Losing Streaks
Losing streaks are inevitable in trading. Maintaining discipline during these periods is crucial.
-
Stick to Your Plan: Avoid impulsive decisions driven by emotions. Adhere to your predefined risk management and exit strategy.
-
Review and Adjust: After losses, review your trading journal to identify areas for improvement. Regularly review and adjust your strategy for long-term success.
Unlock powerful market analysis with ChartsWatcher. Their platform offers customizable dashboards, real-time data, and tools like backtesting and alert customization to empower traders.
