A Trader's Guide to Double Tops and Double Bottoms
If you’ve ever watched a tennis ball bounce, you’ve seen the core idea behind double tops and double bottoms. The ball hits a peak, falls, tries to rally again, but the second bounce just doesn't have the same energy. It loses momentum, and its direction changes.
That's exactly what these classic chart patterns show us. They are the market's way of signaling that a trend is running out of steam and might be about to reverse. Think of it as a tug-of-war between buyers and sellers where one side makes a second, final attempt to push the price past a key level—and fails.
How to Read the Market's Reversal Signals
When you spot one of these patterns, you're not just seeing lines on a screen; you're watching a story unfold. The 'M' shape of a double top tells a tale of enthusiastic buyers who are starting to lose their nerve. They push the price up to a resistance level once, get rejected, and on their second try, they just can't break through. That failure suggests the uptrend is exhausted.
Conversely, the 'W' shape of a double bottom shows determined sellers losing their grip. They try to smash the price through a support level, but buyers step in. They try again, and again they fail. This second failure is a huge sign that the selling pressure is fading and buyers are ready to take control.
Understanding the M and W Formations
At its heart, trading these patterns is about identifying a clear psychological shift in the market. This guide will take you beyond just spotting shapes. We're going to build a disciplined, strategic approach to trading them.
We'll cover how to:
- Pinpoint the key components that make a pattern valid.
- Wait for the right confirmation before you even think about entering a trade.
- Set a non-negotiable stop-loss to manage your risk.
- Establish realistic price targets so you know when to take your profits.
This turns simple pattern recognition into a repeatable trading plan. For a massive real-world example, look no further than the S&P 500 after the 2009 financial crisis. The market formed a giant double bottom, signaling the end of that brutal bear market and kicking off a bull run that lasted for more than a decade. Sellers tried—and failed—twice to push the market to new lows. Buyers absorbed all that pressure and ignited a historic, multi-year rally. For a closer look at this event, you can find a deeper analysis of historic double bottoms on xbtfx.io.
A double top or double bottom doesn't just show a price level; it reveals a battle for market control. The second peak or trough is the critical test of strength, and its failure is your signal.
By mastering the details of double tops and bottoms, you gain a powerful edge in anticipating major market turning points. First, let’s get familiar with the basic anatomy of each pattern.
Before we dive deep, here's a quick side-by-side look at the two patterns to help you get your bearings.
Double Top vs Double Bottom At a Glance
This table provides a quick comparison of the key characteristics defining the bearish Double Top and the bullish Double Bottom patterns.
| Characteristic | Double Top (Bearish 'M') | Double Bottom (Bullish 'W') |
|---|---|---|
| Market Context | Forms after a significant uptrend. | Forms after a significant downtrend. |
| Shape | Resembles the letter 'M'. | Resembles the letter 'W'. |
| Peaks / Troughs | Two consecutive peaks at a similar price level. | Two consecutive troughs at a similar price level. |
| Key Level | The neckline is the support level in the trough between the two peaks. | The neckline is the resistance level in the peak between the two troughs. |
| Volume | Volume is often lower on the second peak. | Volume may increase on the second trough, indicating buying pressure. |
| Signal | A bearish reversal signal. | A bullish reversal signal. |
| Confirmation | Confirmed when the price breaks below the neckline. | Confirmed when the price breaks above the neckline. |
Think of this table as your cheat sheet. The Double Top is the uptrend's potential funeral, while the Double Bottom is the downtrend's potential rebirth. Keep these core differences in mind as we break each one down piece by piece.
Understanding the Anatomy of Reversal Patterns
To really get a handle on trading double tops and double bottoms, you need to see them as more than just simple 'M' and 'W' shapes on a chart. Think of them as a story unfolding—a tug-of-war between buyers and sellers. Figuring out the key plot points is the first step to building a solid trading strategy around them. These aren't just squiggles; they're clear signals of shifting market sentiment.
At their heart, both patterns have three key acts: an initial, powerful push, a brief retreat, and a final, failed attempt to keep the trend alive. This structure is so important because it shows you the exact moment when the dominant force—buyers in an uptrend or sellers in a downtrend—starts to lose its grip.
This visual map shows how both patterns act as potential billboards for a market reversal.
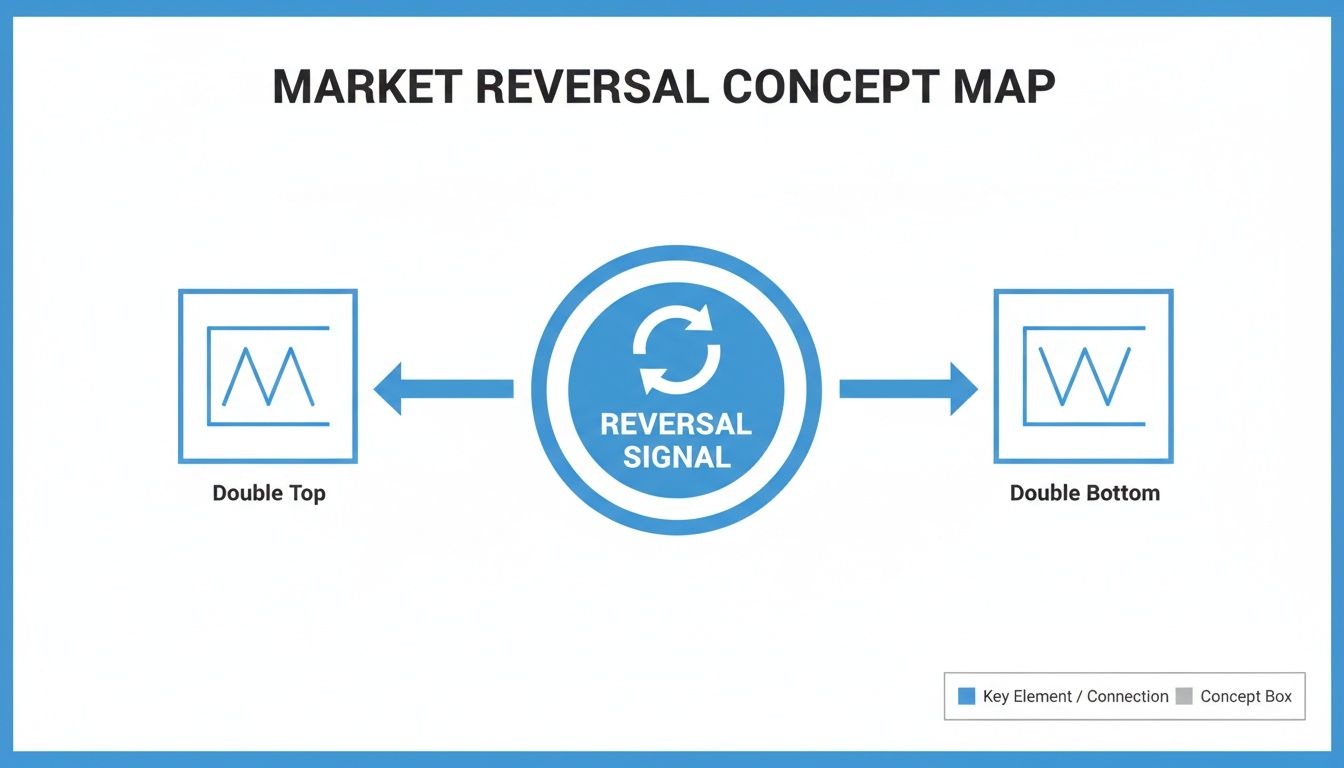
Whether the market is carving out an 'M' or a 'W', the message is the same: the old trend might be running out of steam.
Deconstructing the Double Top Pattern
The double top shows up at the tail end of a strong uptrend, acting as a clear warning that the bulls are getting tired. It’s like a mountain climber who almost reaches the summit, gets pushed back, and then fails to make it on the second try.
Here’s what it’s made of:
- The First Peak: This is the high-water mark of the current uptrend. Buying pressure hits a wall of resistance and starts to sputter.
- The Trough (Neckline Support): After that first peak, the price pulls back and finds temporary footing. This low point between the two peaks is what forms the neckline—a critical battleground for later.
- The Second Peak: The price rallies again, trying to push past the old high. But this second attempt fizzles out at or near the same resistance level, often on weaker volume, which is a dead giveaway that the buyers just don't have it in them anymore.
The story here is one of overconfidence followed by doubt. That failure to punch through to a new high on the second attempt is a huge red flag for anyone who's long. But the real confirmation—the moment of truth—is when the price breaks below the neckline. That’s when you know sellers have taken control.
Breaking Down the Double Bottom Pattern
On the flip side, the double bottom tells a story of sellers failing and bulls getting ready to charge. It forms after a sustained downtrend and suggests that the selling pressure is finally drying up. Imagine dropping a tennis ball: it hits the floor, bounces, and the second bounce fails to break through the floor, showing it's lost its downward momentum.
Here are its key parts:
- The First Trough: This is the lowest point of the downtrend, where sellers finally hit a strong support level and buyers start to show interest.
- The Peak (Neckline Resistance): After hitting that first low, a relief rally kicks in, forming a temporary resistance level. This peak between the two troughs is what establishes the neckline.
- The Second Trough: The price drops one more time to re-test the previous low. It finds support right around the same level, which tells you the sellers don't have the muscle to push prices any lower.
The crucial element in both patterns is the failure of the second attempt. For a double top, it's the failure to break resistance. For a double bottom, it's the failure to break support. This failure is what powers the reversal.
The numbers back this up. Research shows that for a valid pattern, the two peaks or troughs should be within 6% of each other's price level. A classic double bottom often sees a 10-20% bounce between the two lows. To confirm the reversal and avoid false signals, traders look for a decisive break at least 5% above the neckline. You can find a deep dive into these pattern stats on luxalgo.com. And for a complete playbook on how to use these and other chart formations, check out our guide to help you master reversal chart patterns for profitable trades.
A Framework for Confirming Chart Patterns
Just spotting a potential 'M' or 'W' shape on a chart is only the first step. Honestly, it's the easy part. An unconfirmed pattern is a trap waiting to spring, and jumping in too early is one of the fastest ways I've seen traders turn a promising setup into a painful loss. To really succeed, you need a disciplined, rules-based framework to tell the difference between a high-probability signal and simple market noise.
Think of yourself as a detective building a case. One single clue doesn’t cut it; you need several pieces of evidence that all point to the same conclusion. For double tops and double bottoms, your evidence comes from the pattern’s structure, the price action that follows, and maybe a little help from some supporting technical indicators.
The Litmus Test for Pattern Validity
Before you even think about placing a trade, the pattern itself has to meet a few objective criteria. These rules help make sure you’re looking at a real struggle between buyers and sellers, not just random price wiggles.
Here are the core components I always check for:
- Price Proximity: The two peaks of a double top or the two troughs of a double bottom need to be at roughly the same price level. A small difference is okay, but if that second peak is miles higher or the second trough is way lower, it’s not the pattern you’re looking for.
- Time Between Peaks/Troughs: The distance between the two highs or lows matters, too. If they’re squished together, it might just be minor consolidation. If they’re too far apart, the market psychology that drove the first move might not be relevant anymore. A healthy separation shows a clear, failed retest.
The most important rule in this framework is patience. A potential pattern is not a tradable signal. The real green light only flashes when the price decisively breaks the pattern’s neckline.
Waiting for this confirmation is completely non-negotiable. It’s the market’s way of shouting that the other side has officially won the battle and a reversal is getting underway.
The Neckline Break: The Ultimate Confirmation
The neckline is the simple horizontal line you draw at the low point between the two peaks (for a double top) or the high point between the two troughs (for a double bottom). A break of this level is the ultimate proof that the prior trend has run out of steam.
But what counts as a "decisive" break? A price that just kisses the line isn't enough. Many seasoned traders, myself included, look for a full candlestick to close beyond the neckline. This simple filter helps you sidestep "false breakouts," where the price briefly pokes through the level only to snap back violently, trapping anyone who jumped the gun.
Here’s a step-by-step process for confirmation:
- Identify a valid pattern with two clear peaks or troughs at similar price levels.
- Draw the neckline connecting the intervening low or high.
- Wait for the breakout candle to close firmly beyond the neckline. For a double top, this is a close below the neckline. For a double bottom, it's a close above it.
This approach forces you to trade what the market is doing, not what you think it will do—a cornerstone of disciplined trading.
Adding Another Layer of Conviction with Indicators
To stack the odds even more in your favor, you can use technical indicators to find clues that back up the reversal story. One of the most powerful confirming signals out there is divergence.
Divergence happens when the price makes a new high or low, but an oscillator like the Relative Strength Index (RSI) or MACD fails to follow along.
- Bearish Divergence (for Double Tops): Price forms a second peak that is equal to or higher than the first, but the RSI makes a lower high. This is a classic sign that upward momentum is fizzling out, even as the price is still high.
- Bullish Divergence (for Double Bottoms): Price forms a second trough that is equal to or lower than the first, but the RSI makes a higher low. This signals that selling pressure is drying up, and a bottom might be taking shape.
Spotting divergence alongside double tops and double bottoms is like getting an early warning that the underlying trend is on shaky ground. It provides a powerful layer of confirmation that helps you anticipate the reversal with much greater confidence.
Executing Your Trade from Entry to Exit

Spotting a confirmed pattern is one thing; trading it profitably is another. This is where the rubber meets the road, turning chart theory into a clear, actionable trading plan. Great execution isn’t just about seeing the pattern—it’s about having your entry, exit, and risk defined before you ever put a single dollar on the line.
A solid break of the neckline is your green light to act. But how you enter can make a huge difference in your results. Let's dig into the two classic ways traders approach double tops and double bottoms.
Choosing Your Entry Point
Deciding when to pull the trigger is always a balancing act between being aggressive and playing it safe. Neither way is "right" or "wrong." The best choice often comes down to your personal risk tolerance and what the market is telling you at that moment.
Here are the two primary entry techniques:
-
The Aggressive Entry (Immediate Breakout): This is for traders who don't want to miss the boat. You enter the trade as soon as a candle closes decisively past the neckline. For a double top, you’d short the market on a close below the neckline. For a double bottom, you’d go long on a close above it. The big advantage here is you're in the move if it takes off like a rocket.
-
The Conservative Entry (Retest of the Neckline): More patient traders often prefer this route. After the initial breakout, price will frequently pull back to "retest" the level it just broke. A broken support level (the neckline of a double top) tends to become new resistance, and a broken resistance level (the neckline of a double bottom) becomes new support. This retest gives you a second chance to enter, often at a better price with a tighter risk-to-reward ratio.
Of course, waiting for a retest means you risk the price never coming back, leaving you on the sidelines. But the trade-off is that this approach helps you sidestep many false breakouts, giving you an extra layer of confirmation.
A trade plan is your roadmap. It defines exactly where you get in, where you take profit, and, most importantly, where you admit you are wrong and get out. Never enter a trade without it.
Setting Your Price Target
So, you’re in the trade. Now what? The million-dollar question is always, "Where do I get out?" While it’s tempting to just let your winners run, double tops and double bottoms offer a structured way to set a logical price target. This helps you trade with a clear goal instead of pure emotion.
The standard technique is called the measured move:
- Step 1: Measure the vertical distance in price from the highest peak of the double top down to the neckline. For a double bottom, measure from the lowest trough up to the neckline. This distance is the "height" of the pattern.
- Step 2: Project that same distance from the breakout point of the neckline, in the direction of your trade.
- For a Double Top: Subtract the pattern's height from the neckline's price to find your downside target.
- For a Double Bottom: Add the pattern's height to the neckline's price to find your upside target.
This technique gives you a data-driven exit point. But remember, hitting these targets is far from guaranteed. One of the most detailed studies on this pattern analyzed 454 double tops and found the average successful trade led to a 20% decline. However, only 39% of them actually reached their full measured price target. This is a powerful reminder that taking partial profits on the way down can be a very smart move. You can discover more about these double top statistics at Quantified Strategies.
Implementing Your Stop-Loss and Managing Risk
No trading strategy is worth its salt without a solid risk management plan. Your stop-loss is your safety net—it's the price you decide on in advance where you’ll exit a losing trade to protect your capital.
For these reversal patterns, placing your stop is pretty intuitive:
- For a Double Top (Short Trade): Your stop-loss goes just above the highest of the two peaks. If the price breaks above that high, your entire bearish theory is proven wrong, and it's time to get out.
- For a Double Bottom (Long Trade): Place your stop-loss just below the lowest of the two troughs. A break below this support level invalidates the bullish reversal signal.
By setting your entry, profit target, and stop-loss before you trade, you can calculate your risk-to-reward ratio. A good rule of thumb is to only take trades where your potential reward is at least twice your potential risk (a 2:1 ratio). This simple rule ensures that even if you only win half your trades, you can still come out ahead over the long haul.
Common Trading Mistakes and How to Avoid Them
Knowing the textbook rules for trading double tops and double bottoms is one thing. But understanding the common traps that snag most traders is what really separates the consistently profitable from the perpetually frustrated.
It’s easy to get excited when you spot that classic 'M' or 'W' shape forming on your chart. The problem is, that excitement often leads to psychological blunders that can turn a picture-perfect setup into a painful loss. Let's walk through the most common mistakes I see traders make and, more importantly, how to sidestep them for good.
The Impulse to Enter Too Early
This one is, by far, the biggest account-killer. You see the second peak or trough start to roll over, and that little voice in your head screams, "Get in now or you'll miss the whole move!" This is pure, unadulterated fear of missing out (FOMO). You jump the gun, convincing yourself the pattern is a sure thing, only to watch the price whip right back around and continue the original trend, stopping you out in the process.
A pattern isn't a pattern until it’s confirmed. The break of the neckline is the market's way of telling you the reversal is officially on. Anything before that is just a guess.
The Solution: Make it a hard-and-fast rule: you do not enter until a candle closes beyond the neckline. That's it. No exceptions. This simple dose of patience will filter out an incredible number of fake-outs and failed patterns, saving you a ton of capital and mental anguish.
Ignoring Crucial Volume Clues
Price shows you what is happening, but volume reveals the conviction behind the move. So many traders get fixated on the 'M' or 'W' shape and completely tune out the volume bars at the bottom of their screen. This is a massive mistake. A double top forming on weak, anemic volume as it makes the second peak is a much more powerful signal than one with buyers still piling in.
The Fix: Always, always analyze volume alongside price. It gives you the full story. Here's your cheat sheet:
- Double Top: You want to see decreasing volume as the second peak forms. This tells you the buyers are exhausted. Then, look for a big spike in volume when the price breaks the neckline—that’s your confirmation that sellers have taken control.
- Double Bottom: The script flips here. Ideally, you’ll see higher volume on the second low, showing that buyers are stepping up with force. The breakout above the neckline should also happen on strong volume, confirming the bulls mean business.
Setting a Stop-Loss Too Close
Another classic blunder is choking your trade to death with a stop-loss that's way too tight. In an attempt to keep potential losses to an absolute minimum, traders will set their stop just a few ticks above the high or below the low. The problem? Markets are messy. They don't move in straight lines.
This approach leaves zero room for the natural ebb and flow—the "noise"—of the market. A tiny, meaningless wiggle is all it takes to knock you out of a perfectly good trade right before it takes off in your favor.
The Solution: Give your trade some breathing room. For a double top, your stop-loss belongs comfortably above the highest peak of the pattern. For a double bottom, place it well below the lowest trough. This way, you’re only stopped out if the entire premise of the pattern—the failure to make a new high or new low—is proven wrong. It's a small adjustment that can prevent a world of unnecessary losses.
Finding Patterns Automatically with Chart Scanners

Manually clicking through hundreds of charts to hunt down the perfect double tops and double bottoms is a terrible use of a trader's most valuable asset: time. While it's a great way to learn the ropes, that manual approach just doesn't scale.
Thankfully, technology gives us a much smarter way to work. You can scan the entire market for high-probability setups in minutes, not hours.
Automated chart scanners are built to do the heavy lifting. Instead of going cross-eyed looking for patterns one chart at a time, you just define the exact criteria you want. The software then brings the real opportunities straight to you. This frees you from the grunt work of searching so you can focus on what actually makes you money—analysis, execution, and risk management.
Building Your Custom Pattern Scanner
Setting up a scanner to find these patterns is actually pretty straightforward. Using a platform like ChartsWatcher, you can build a set of rules that tells the system precisely what to look for. The trick is to translate the visual pattern of a double top or double bottom into a series of logical, scannable conditions.
Let’s say you want to build a basic scan for a double bottom pattern. Your logic might look something like this:
- Condition 1: Market Context - First, you want a stock in a clear downtrend. A simple way to define this is to look for stocks trading below their 50-day moving average. This makes sure you're hunting for a genuine reversal pattern, not just noise.
- Condition 2: Trough Formation - Next, the price needs to make a new 20-day low, rally a bit, and then come back down to test that same low. You can define "test" as being within a small percentage, like 2-3%. This is how you digitally identify that classic 'W' shape.
- Condition 3: Confirmation Trigger - Finally, the price must now be trading above the high point between those two troughs (the neckline). This is your breakout signal, the trigger to pay attention.
This approach takes a subjective visual pattern and turns it into an objective, repeatable process. To get more ideas on setting up these kinds of powerful filters, check out a trader's guide to real-time stock scanning for some deeper insights.
Creating Real-Time Alerts for Immediate Action
A scanner is great, but pairing it with real-time alerts is the real game-changer. Once your scan is dialed in, you can set up notifications that ping you the second a stock meets all your criteria. This means you don't have to be glued to your screen all day waiting for something to happen.
A well-configured scanner acts as your personal market assistant, tirelessly watching every stock so you don't have to. It delivers qualified trading candidates directly to you, turning endless searching into focused analysis.
Here’s a peek at what a configured scanner interface might look like in ChartsWatcher, actively searching for emerging double bottom patterns across the market.
This simple setup shows the logic in action, filtering thousands of stocks down to a handful that match the precise conditions for a potential bullish reversal. With this kind of automation, you can be confident you'll never miss a great setup just because you were looking at the wrong chart at the wrong time.
Of course. Here is the rewritten section, designed to sound like an experienced human expert while adhering to all the specified requirements.
Common Questions I Hear from Traders
When you start digging into double tops and double bottoms, a few questions always pop up. Let's tackle them head-on, so you can trade these classic patterns with more confidence.
Just How Reliable Are These Patterns?
Look, no chart pattern is a crystal ball. Double tops and bottoms are powerful signals, but they aren't foolproof. Think of them as high-probability setups, not ironclad guarantees.
Their real strength shines when you find other clues backing them up. A big volume spike on the breakout? Bullish or bearish RSI divergence building between the two peaks? Now you're talking. That's when a good setup can become a great one.
Remember, false breakouts are part of the game. It’s why so many seasoned traders won't pull the trigger until a candle closes beyond the neckline. That simple rule filters out a ton of market noise and can save you from a lot of bad trades.
Do They Work on All Timeframes?
Absolutely. You'll spot these patterns everywhere, from a frantic 1-minute chart all the way up to a slow-moving weekly chart. A day trader and a long-term investor can both build strategies around them.
That said, a pattern on a higher timeframe—like a daily or weekly chart—carries a lot more weight. It represents a more significant, prolonged battle between buyers and sellers.
The core principles don't change, though. The key is to adjust your tactics. Your entries, stop-losses, and profit targets have to make sense for the timeframe you're trading and its typical volatility.
Can the Peaks and Troughs Be at Slightly Different Prices?
In a perfect world, the two peaks or troughs would be identical to the penny, showing a hard rejection line. But the market is rarely that clean. In reality, a little bit of wiggle room is not only acceptable but expected.
As a general rule of thumb, most traders will still consider a pattern valid if the two points are within a few percentage points of each other. If the difference is huge, you’re probably not looking at a true double top or bottom anymore.
Stop hunting for patterns manually. Let ChartsWatcher do the heavy lifting by scanning the entire market for high-probability setups and alerting you in real-time. Find your next trade now with ChartsWatcher.
