A Pro Trader's Guide to Stocks About to Break Out
If you want to find stocks that are about to pop, you need to learn how to spot technical patterns where buying pressure is quietly building up just before a massive price surge.
These setups happen when a stock goes quiet and consolidates, shaking off the sellers. It’s a tell-tale sign that big institutional money is stepping in and accumulating shares. The real trick is to spot these patterns before the fireworks begin.
Understanding the Anatomy of a Breakout
Before you can profit from a breakout, you have to know what one actually looks like on a chart and understand the psychology that drives it. A real breakout isn't just some random price spike; it's the final, explosive stage of a pretty predictable cycle.
The process usually starts with a period of consolidation. This is where buyers and sellers are in a standoff, reaching a temporary truce. But beneath the surface, demand starts to build until it finally overwhelms the supply.
Smart traders know how to spot the subtle clues that institutional investors leave behind. These "footprints" show up in specific price and volume action—the exact conditions a professional stock scanner is built to find.
The Three Phases of a Breakout
A stock almost never just shoots straight up without any warning. It typically moves through a few distinct phases that lay the groundwork for a sustainable rally. Learning to see these stages is your first step toward moving from just guessing to trading with a repeatable strategy.
-
Consolidation: This is the calm before the storm. After a move up or down, a stock will often trade sideways in a tight, defined range. Think of it as a battle between buyers and sellers where neither side can gain the upper hand.
-
Accumulation: While the stock looks boring and is trading sideways, institutional players might be quietly buying up shares without pushing the price up too much. The classic sign here is when volume starts to decrease or "dry up," suggesting that the sellers are running out of steam.
-
Buildup and Breakout: As the big players keep buying, the buying pressure starts to intensify. You'll often see the price action tighten up, with smaller and smaller daily ranges, like a spring coiling tighter and tighter. The breakout finally happens when the price decisively smashes through a key resistance level, almost always on a massive surge in volume.
A breakout on low volume is a huge red flag. It’s often a "fakeout" where the price quickly reverses and traps eager buyers. A genuine, institutionally-backed move is confirmed by volume that’s at least 50% to 150% above its recent average. This proves there's real conviction behind the move.
This powerful combination of price action and volume is the core anatomy of a high-probability trade. Once you learn to tell the difference between a weak, fake move and a confirmed institutional entry, you can start focusing your capital on the setups that have the best chance of actually working out. This foundation is absolutely essential for building effective scans and knowing which trades are worth taking.
Building Your Custom Breakout Scanner
So, you've got the theory down. Now it's time to turn that knowledge into a real-world, money-making process. Building a professional-grade breakout scanner is all about cutting through the noise to find the handful of stocks that actually matter on any given day.
We're not talking about generic advice here. We’re going to build a specific, actionable set of rules you can plug directly into your trading platform. This is how you transform a universe of thousands of stocks into a focused, high-probability list—a watchlist of names showing the classic technical signs of an imminent move.
The whole idea is to programmatically find stocks that fit the perfect anatomy of a breakout. This classic pattern is what we're hunting for.
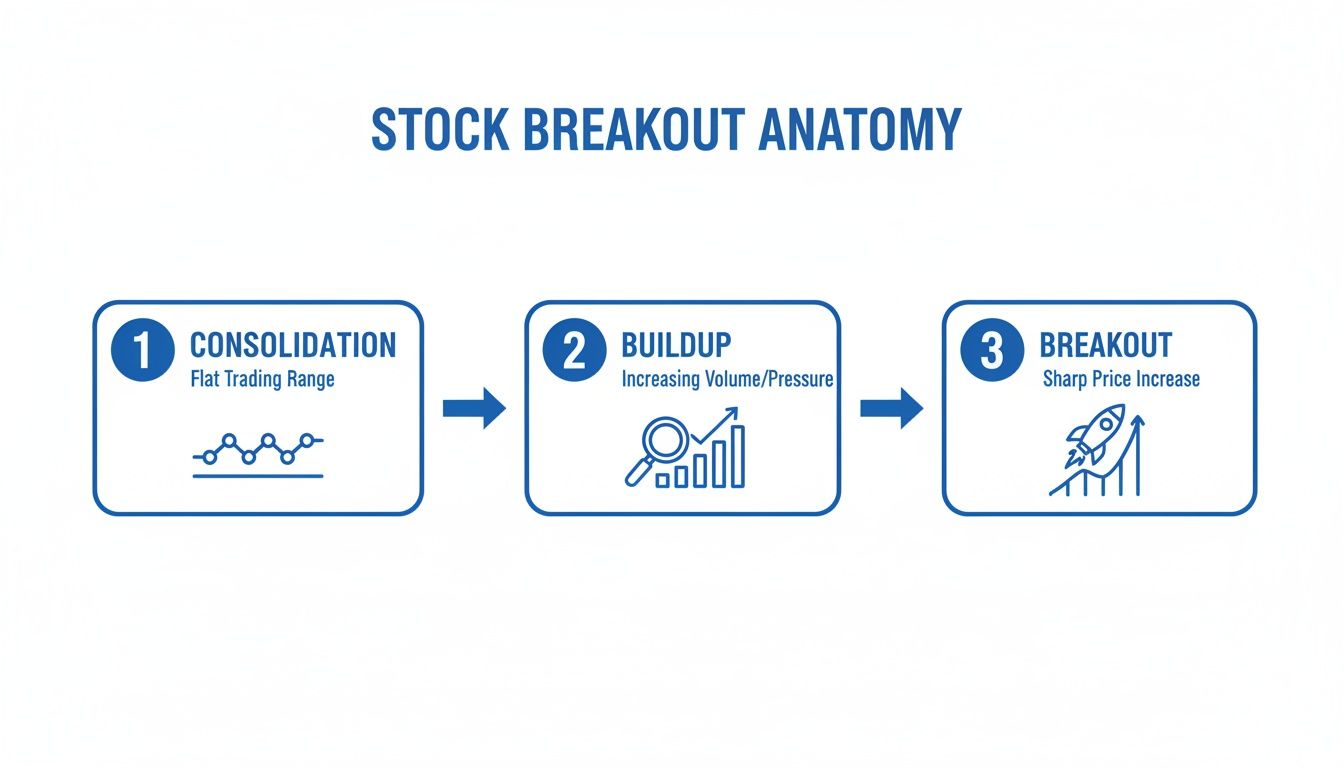
The flow is always the same: a quiet consolidation, a buildup of pressure, and then the explosive move. Our custom scanner is designed to catch stocks in that final buildup phase, right before they launch.
Defining Your Core Scan Criteria
To find stocks that are truly on the verge of breaking out, your scanner needs to hunt for a very specific confluence of factors. These aren't just suggestions; think of them as hard-and-fast rules that separate the A+ setups from all the market chatter.
Each rule acts as a filter, and with each layer, your final list of candidates gets more and more potent. I've found that a simple, non-negotiable set of parameters works best as a starting point.
Here are the specific, foundational rules I recommend programming into your scanner. This table lays out the what, how, and why for each core parameter.
Core Breakout Scan Parameters
| Parameter | Setting/Rule | Rationale |
|---|---|---|
| Price Action | Current price is within 5% of the 52-week high. | This isolates market leaders—stocks that are already showing clear relative strength and have momentum on their side. |
| Volume Surge | Current day's volume is at least 150% of the 20-day average volume. | This is non-negotiable. It’s the clearest footprint of institutional buying and confirms real conviction behind the potential move. |
| Liquidity | Minimum average daily dollar volume of $20 million. | This ensures you can get in and out of a position easily. It filters out illiquid, thinly traded stocks that are too risky and volatile. |
Just implementing these three simple rules will slash the universe of stocks down to a manageable list of relevant names. This is the foundation of a powerful breakout scan.
Adding Volatility and Consolidation Filters
Now we get a bit more nuanced. Beyond the basic strength and volume, the best scanners are tuned to find stocks that are coiling up with potential energy. What we're looking for is a volatility contraction—a stock that consolidates tightly after a recent run-up.
When a stock pauses and trades in a narrow range, it's often building the base for its next major leg higher. It’s shaking out weak hands and absorbing supply before the real move begins.
To capture this constructive price action, let's add two more filters to our scan:
- Tight Price Range: Look for stocks where the daily trading range over the past five days has been contracting. Ideally, you want the range to stay within 3% or less from high to low each day. This is the "coil" we're looking for.
- Moving Average Proximity: The stock must be trading above its key short-term moving averages, like the 10-day and 20-day exponential moving averages (EMAs). This confirms the immediate trend is still up and healthy.
This combination helps you find stocks that aren't just hovering near their highs, but are doing so with controlled, constructive price action. This is a classic sign of institutional accumulation.
Your scanner's job isn't to give you a final buy signal. Its purpose is to generate a high-quality watchlist. Manual chart review is still essential to validate the pattern, confirm the volume signature, and pinpoint the exact entry.
Once your scan is running, you should be left with a small, manageable list of candidates. These are the stocks you'll want to watch like a hawk, setting alerts at key resistance levels. When a name from your list finally punches through its pivot on a massive volume surge, you’ll be ready to act with confidence.
For a much deeper dive into screeners, including more advanced settings, be sure to check out our detailed guide on creating a proven breakout stock screener.
Validating Signals with Technical Analysis
Once your scanner flags potential stocks about to break out, the automated part of the job is done. Now, the real work begins. This manual validation is what separates professional traders from the hobbyists, ensuring you only put capital at risk on the highest-probability setups.
A scanner simply brings names to your attention; it's up to you to meticulously examine the chart for those subtle visual cues that scream a genuine, explosive move is imminent. It’s less about the numbers now and more about interpreting the story the price action is telling you.
Chart Patterns: The Precursors to Powerful Moves
Certain chart patterns consistently show up right before a stock makes a significant price advance. Think of these formations as visual representations of supply and demand reaching an equilibrium, just before demand completely takes over. Recognizing them isn't just a skill—it's non-negotiable.
Some of the most reliable breakout patterns I look for include:
- Ascending Triangles: This pattern takes shape with a flat, horizontal resistance line up top and a rising trendline of higher lows underneath. It shows that buyers are getting more aggressive, willing to pay more, while sellers are holding the line at a specific level—until they finally get run over.
- Flat Bases: After a strong run-up, a stock will often consolidate sideways in a tight, narrow range for several weeks. This is a healthy sign that the stock is absorbing its prior advance, with selling pressure drying up before the next leg higher.
- High, Tight Flags: This is a rare but incredibly powerful pattern. You'll see it after a stock doubles (or more) in just a few weeks and then consolidates sideways for one to three weeks in a very tight range. This signals immense institutional demand.
These patterns are the battlegrounds where bulls and bears fight for control. Your job is to spot when the bulls are clearly winning.
Using Moving Averages to Confirm Trend Strength
Moving averages are my go-to for quickly gauging the underlying health and momentum of a stock's trend. They act as dynamic support levels and give a quick visual confirmation of which way the winds are blowing. Any stock breaking out from a solid base should be trading above its key moving averages.
I never take a long-side breakout trade if the stock is trading below its 50-day moving average. It's a simple rule that keeps you on the right side of the intermediate-term trend and filters out countless setups that are likely to fail. The 10-day and 20-day EMAs should also be pointing upward, confirming that short-term strength is on your side.
The alignment of these averages tells a story. When the shorter-term averages are stacked neatly above the longer-term ones, it confirms that momentum is firing on all cylinders across multiple timeframes. This adds a critical layer of confidence to your breakout signal.
The Undeniable Importance of Volume
Volume is the ultimate truth-teller in trading. A price move without significant volume behind it is suspicious and often doomed to fail. A genuine breakout must be accompanied by a massive surge in trading activity, confirming that big institutions are piling in with conviction.
For a breakout to be considered valid, I want to see volume that is at least 150% of its 50-day average. A breakout on low, anemic volume is one of the biggest red flags in technical analysis—it’s often a "fakeout" designed to trap unsuspecting traders. Understanding this relationship is critical, and you can learn more about decoding unusual stock volume for smarter trades in our specialized guide.
By confirming the pattern, trend, and volume, you transform a simple scanner alert into a high-confidence trade setup.
Learning from Historical Market Breakouts
If you want a playbook for trading, look no further than the market's own history. While every cycle feels different when you’re in the thick of it, the major inflection points all share repeatable patterns of fear, consolidation, and eventually, an explosive recovery. Studying these moments is what gives you the conviction to pull the trigger on a solid breakout setup when everyone else is paralyzed by fear.
Think about the big market dislocations—the '87 crash, the 2008 Financial Crisis, the 2020 pandemic sell-off. These events are brutal, but they also create incredible opportunities. They completely wash out the weak hands, reset valuations across the board, and lay the foundation for new market leaders to charge ahead. The recoveries that follow are almost never slow and steady. Instead, they’re often defined by powerful, sector-specific trends that kick off uptrends lasting for months, even years.
Turning Crisis into Opportunity
Market crashes are the perfect hunting ground for finding stocks on the verge of a major breakout. After the initial wave of panic selling, you get a period of basing or consolidation. This is when the smart money—the institutions—starts quietly soaking up shares in the strongest companies. We're talking about businesses with resilient models and fortress-like balance sheets.
You can actually see this accumulation happening on a chart. The price action tightens up, and volume completely dries out, which tells you the sellers are exhausted. This is the calm before the storm. A new base of ownership is being built right before the next big move up. For a savvy trader, this isn't a time to panic; it’s time to start building a watchlist.
The takeaway here is simple: a market in turmoil isn't your cue to run and hide. It's your signal to start hunting. This is where knowing your history becomes a powerful edge.
Lessons from Past Market Recoveries
History is packed with examples of extreme fear paving the way for massive gains. In the high-stakes game of professional trading, spotting stocks ready to pop during these periods can be the difference between a huge score and a missed opportunity.
Take Black Monday, October 19, 1987. The Dow got hammered, dropping a staggering 22.6% in a single day. But what happened next was a textbook setup for a powerful rally. Just three years later, the S&P 500 had ripped over 50% higher from its lows. More recently, after the S&P 500 plunged 34% during the 2020 COVID crash, it rocketed to new all-time highs by that August, handsomely rewarding anyone who spotted the early breakout candidates. You can dig into the data on the biggest stock market crashes in U.S. history to see these patterns for yourself.
So, what's the lesson from all this? The moments of maximum pessimism are often the points of maximum opportunity. Your job isn't to perfectly time the bottom—that's a fool's errand. It’s to recognize when the market’s character shifts from panicked selling to constructive consolidation.
This historical perspective isn’t just some academic exercise; it’s a critical part of a professional trader’s mindset. It allows you to build and backtest your strategies against real-world chaos. When you understand that sharp sell-offs often lead to equally sharp recoveries, you develop the confidence to execute your plan. You can buy a stock breaking out from a solid base, even when the headlines are still screaming doom and gloom, because you’ve seen this movie before.
Executing and Managing Breakout Trades
Finding a killer setup is just the start. Your actual profitability comes down to how you execute and manage the trade once you're in it. A perfect scan and a textbook chart pattern mean absolutely nothing if you don't have a disciplined framework for getting in, managing your risk, and getting out.
This is where the pros really separate themselves from the crowd.

The ideal entry is that exact moment a stock punches through a clean resistance level or pivot point, especially when it's confirmed by a big surge in volume. This isn't about guessing; it's about reacting to the market giving you a clear signal that the buyers have wrestled control away from the sellers.
Setting Intelligent Stop Losses
The very first thing you do after entering a trade—always—is set your stop-loss. This is your non-negotiable line in the sand. It’s what protects your capital so you can live to trade another day.
A classic mistake is setting stops way too tight. You end up getting shaken out by normal market noise, only to watch the stock take off without you. It’s infuriating.
Instead, give the trade some room to breathe. Place your stop just below the breakout structure itself. If a stock is breaking out from a flat base, that might mean setting the stop slightly below the low of the breakout day's candle or just under the entire consolidation zone. This defines your maximum loss without choking the trade.
Position Sizing and Taking Profits
How much skin you have in the game is just as critical as your entry point. A professional approach means sizing your position based on the quality of the setup and your own risk tolerance. The cardinal rule is simple: never risk more than 1-2% of your entire trading account on a single idea.
Once a trade starts working, the game shifts to managing your profits. An effective strategy I’ve used for years involves:
- Scaling Out: Don't be afraid to take some money off the table as the stock hits key targets, like a 20-25% gain from where you got in. This locks in profit, reduces your overall risk, and lets you play with the house's money.
- Using Trailing Stops: After you've booked some initial gains, you can switch to a trailing stop. Tying it to a key moving average, like the 20-day EMA, lets the rest of your position run. It’s the best way to avoid cutting a massive winner short.
Discipline in trade management is what builds a career. Finding stocks about to break out is a skill, but managing risk and letting winners run is the art that generates consistent returns over time.
Looking at historical market cycles really drives this point home. Over the last 65 years, the S&P 500 has churned through six bull and six bear markets. The recoveries that followed those huge declines produced absolutely monster gains in the leading stocks.
Think about what happened after the 2008 financial crisis. As Apple broke out from its post-crash base, the stock rocketed over 400%. Understanding the history of stock market recoveries is crucial for grasping just how powerful these breakout cycles can be.
Common Questions About Breakout Trading
Even with a solid strategy locked in, every trader runs into the same handful of questions when hunting for stocks ready to pop. Figuring out how to handle fakeouts, nail your timing, and find the right entry is what really separates the consistently profitable traders from everyone else. Getting these answers straight is how you build the confidence and discipline to execute your plan.
The fear of getting smoked by a "fakeout" is probably the biggest one. We've all been there: a stock pokes its head above a key resistance level, suckers in a few buyers, and then immediately slams back down, trapping everyone who jumped in. It's a frustrating and expensive lesson.
How Do You Avoid Fakeouts Where a Stock Fails After Breaking Out?
Your best defense against a fakeout is simple: volume confirmation. A real, legitimate breakout needs to happen on a surge of volume—I'm talking at least 150% of its recent average, minimum. A breakout on light, flimsy volume is a massive red flag. It tells you the big institutions aren't behind the move.
Beyond that, you have to wait for a strong closing price above the resistance level. It’s not a real breakout if a stock pushes through a level during the day only to close back below it by 4 PM. That's a failed attempt, plain and simple. Set alerts for both price and volume thresholds so you can tune out the noise and only focus on moves with real conviction.
A great little trick is to watch the daily closing range. If a stock closes in the upper 25% of its daily high-low range on the breakout day, it shows buyers were in complete control right up to the closing bell. That's a powerful sign of strength.
What Is the Best Timeframe for Finding Breakout Stocks?
This really boils down to your personal trading style. If you're a day trader, you'll live on the 5-minute and 15-minute charts, looking for intraday consolidation patterns to resolve. The principles are identical, just on a much faster timeline.
For swing traders, though, the daily chart is king. A powerful setup on a daily chart often forms over weeks or even months of consolidation, which can fuel a much more explosive multi-day or multi-week run. The best approach is to blend timeframes. Find a killer setup on the daily, then drill down to an hourly chart to really dial in your entry and manage your risk with precision.
Is It Better to Buy Before or After It Breaks Out?
It's tempting to try and front-run a breakout, but buying in anticipation is pure guesswork. The professional approach is to wait for confirmation. This means you buy the stock as it's actually pushing through that established resistance level, and on heavy volume, not a second before.
Sure, you might miss the first few cents of the move, but waiting for the market to prove you right dramatically increases the odds that the trend will follow through. Your entry should always be a reaction to what the market is doing, not a prediction of what you think it might do.
Ready to stop guessing and start finding high-probability setups with precision? ChartsWatcher provides the powerful, real-time scanning and analysis tools you need to identify stocks about to break out before the crowd does. Build your custom breakout scan today.
