A Guide to Sector Rotation Strategy
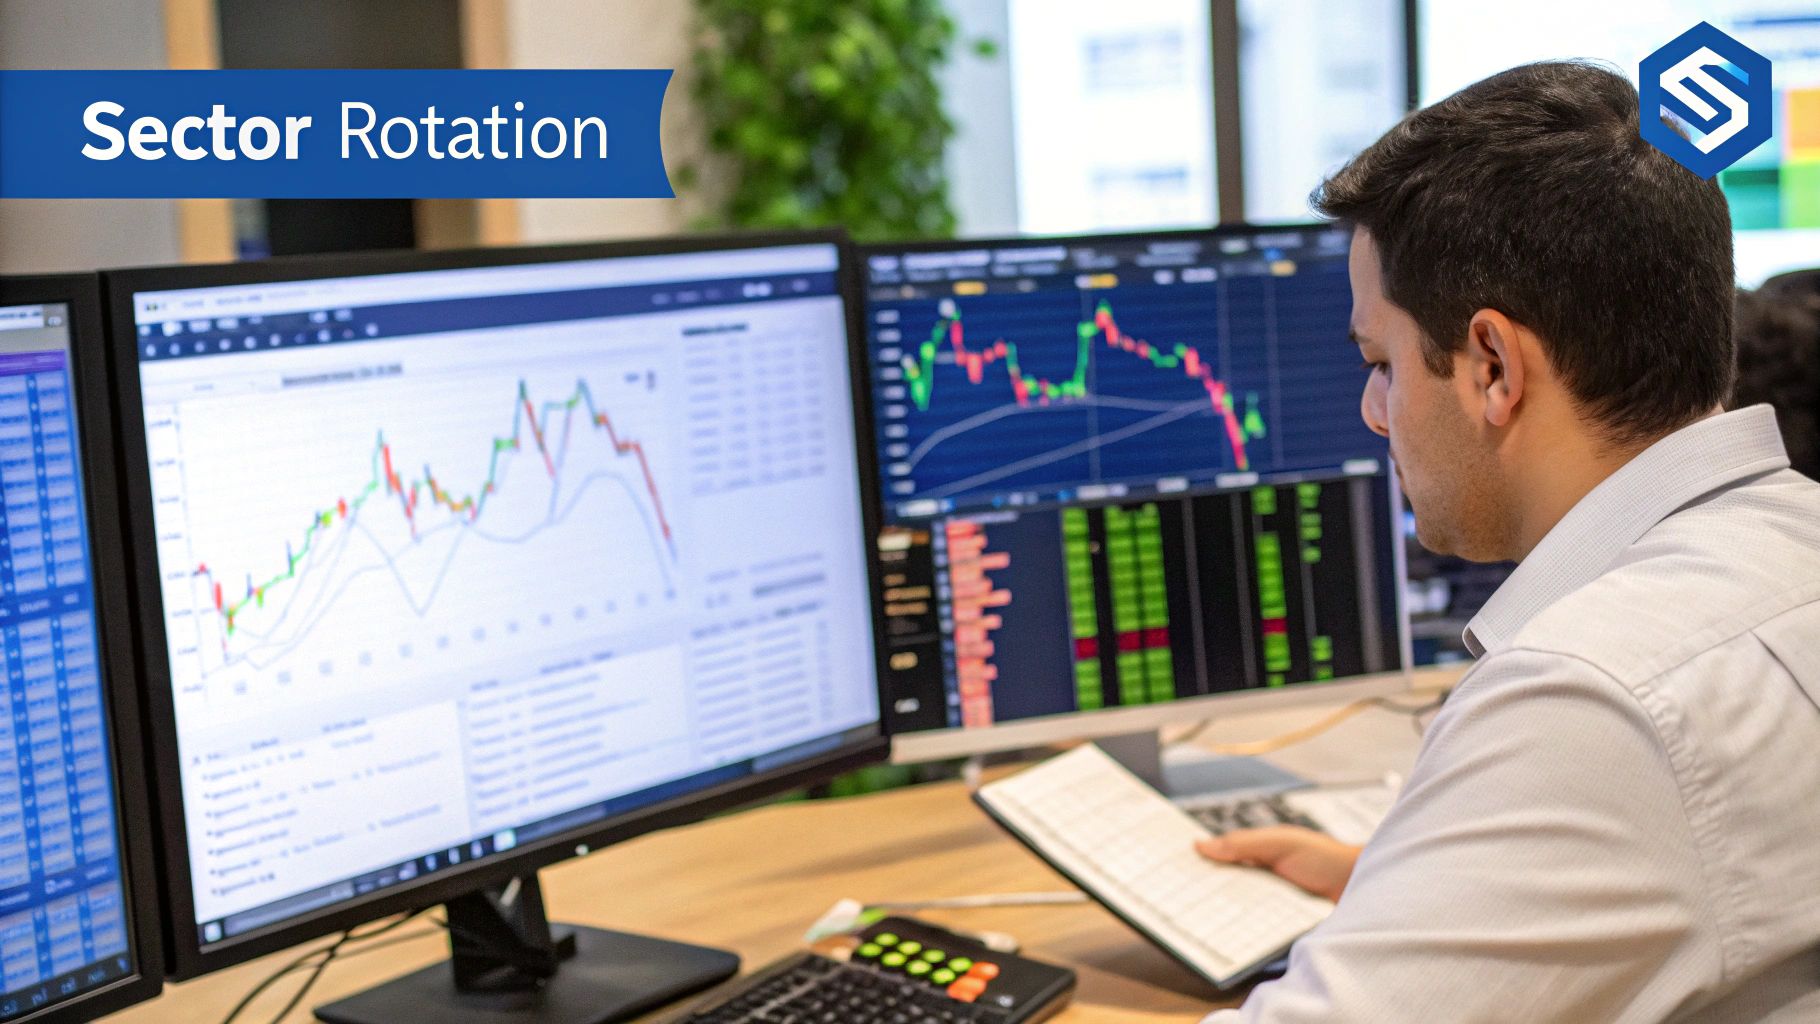
A sector rotation strategy is an active, top-down approach to investing. Instead of getting bogged down in picking individual stocks, you're adjusting your portfolio to catch the shifting economic winds.
It's based on a simple, yet powerful, idea: different parts of the economy perform better at different times. A sector rotation strategy is all about moving your capital between these sectors to capitalize on their predictable performance throughout the business cycle.
Understanding the Core Concept of Sector Rotation
At its heart, sector rotation is a proactive, big-picture way to invest. You aren't just betting on a single company to succeed; you're making calculated moves based on the overall health and direction of the economy. The stock market is broadly divided into distinct sectors, each representing a specific slice of the economic pie.
These sectors include well-known areas like:
- Technology: Companies creating software, hardware, and the next big innovation.
- Healthcare: Businesses in medical services, pharmaceuticals, and devices.
- Consumer Staples: Firms that produce essential goods we buy no matter what, like food and cleaning supplies.
- Consumer Discretionary: Companies offering the "wants" in life, like new cars and luxury items.
- Financials: Banks, insurance companies, and investment firms that keep money moving.
- Energy: Businesses involved in oil, gas, and renewable energy.
The core principle is that these groups don't move in lockstep. Their fortunes rise and fall with the natural ebb and flow of the business cycle, which generally moves through four phases: recovery, expansion, peak, and recession. Each phase creates a unique economic environment, favoring some sectors while holding others back.
The Logic Behind Shifting Winds
So, why does this happen? It all comes down to economic sensitivity.
Think about it. During a recovery, consumers and businesses start spending again, which lights a fire under growth-oriented sectors like Technology and Consumer Discretionary. But when a recession hits, demand for non-essentials can plummet. People still need to turn on the lights and buy groceries, though, which is why defensive sectors like Utilities and Consumer Staples tend to be more resilient.
This observation is what the whole strategy is built on. Stocks within the same sector often move together because they share similar business models and are affected by the same economic factors. The logic of a sector rotation strategy is tied directly to these predictable cycles. You can learn more about how these cycles impact sector performance from research by financial experts like Fidelity.
To make this crystal clear, here’s a quick summary of how sectors typically perform during each economic phase.
Sector Performance at a Glance
| Economic Phase | Characteristics | Outperforming Sectors |
|---|---|---|
| Recovery | Economic activity picks up after a downturn. Confidence returns, and spending increases. | Technology, Consumer Discretionary, Industrials |
| Expansion | The economy experiences strong, sustained growth. Employment and wages rise. | Energy, Materials, Financials |
| Peak | Growth begins to slow down. Inflation often becomes a concern. | Healthcare, Consumer Staples, Utilities |
| Recession | Economic activity contracts. Unemployment rises, and spending falls. | Utilities, Consumer Staples, Telecommunications |
This table provides a great starting point, but remember that real-world markets are messy. These are strong historical tendencies, not unbreakable laws.
A sector rotation strategy is fundamentally about aligning your portfolio with the most powerful economic trends at any given moment. It’s about anticipating where the economy is headed next and positioning your investments to benefit from that shift.
This top-down philosophy allows you to systematically move out of sectors that are losing steam and into those that are gaining strength. By understanding the distinct feel of each economic phase and the sectors that thrive within them, you can build a more adaptive and responsive investment plan. The goal isn't to outsmart the entire market, but to skillfully navigate its predictable currents.
Navigating the Four Phases of the Market Cycle
To really get a handle on sector rotation, you first have to understand the engine that drives it: the economic market cycle. The economy doesn't move in a straight line. It's more like a series of predictable waves, each with a distinct peak and a trough.
These waves are typically broken down into four distinct phases. Learning to spot which phase we're in is the absolute key to figuring out which sectors are about to take the lead. It helps you shift from reacting to market noise to proactively positioning your portfolio for what's likely coming next. Let's break down each phase.
Phase 1: The Early Cycle or Recovery
Think of the early cycle, or recovery phase, as the first light of dawn after a long night. It kicks off at the bottom of a recession when economic activity, after being in decline, finally starts to show signs of life. Confidence is still shaky, but it's growing. At this point, central banks have usually slashed interest rates to make borrowing cheaper, setting the stage for a comeback.
Businesses that had been pinching pennies start to invest in new equipment and tech to get ahead of the curve. At the same time, consumers who feel a bit more secure in their jobs begin to make those big-ticket purchases they'd been putting off. This creates a powerful tailwind for a few key sectors.
- Technology (XLK): Companies get a boost as businesses upgrade their systems and consumers snap up new gadgets.
- Consumer Discretionary (XLY): With more cash to spare, spending on non-essentials like cars, vacations, and other luxuries picks up.
- Industrials (XLI): As factories fire up and construction projects get underway, industrial firms see a fresh wave of demand.
Phase 2: The Mid-Cycle or Expansion
After the initial recovery, the economy moves into the mid-cycle, or expansion phase. This is usually the longest and steadiest period of growth. The economy is humming along, corporate profits are climbing, and unemployment is low. The fragile optimism from the early cycle has blossomed into widespread confidence.
Credit is still easy to get, and both businesses and consumers are spending freely. This sustained growth is fantastic for the sectors that supply the raw materials and financial grease for the economic machine. Historically, these mid-cycle rotations can last for two to three years on average.
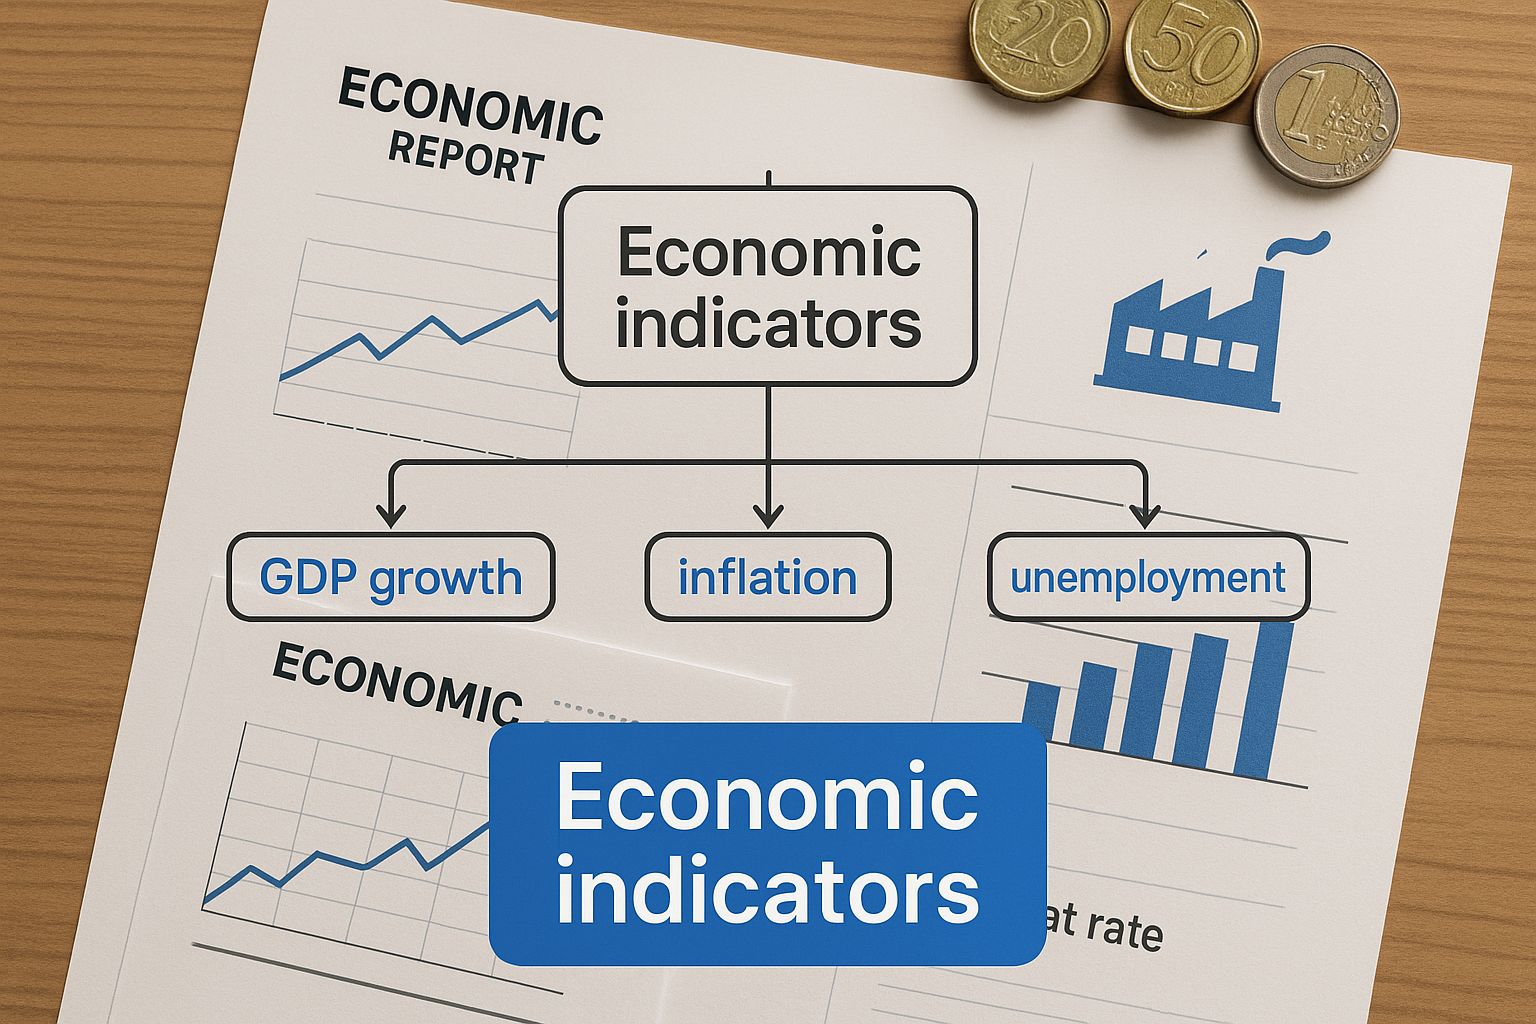
As the infographic shows, keeping an eye on indicators like GDP, interest rates, and employment is critical for spotting when the market is starting to shift from one phase to the next.
Phase 3: The Late Cycle or Peak
Eventually, even the strongest growth starts to run out of steam. This is the late cycle, or peak. The economy is running at full tilt, which often leads to overheating. Demand outstrips supply, and inflation becomes the main villain of the story, pushing prices higher across the board.
In response, central banks typically start raising interest rates to cool things down and get inflation under control. While the economy is still growing, the pace slows, and the first warning signs appear. This is when smart money starts rotating out of high-flying growth stocks and into more defensive plays that can weather a slowdown.
- Healthcare (XLV): People need healthcare services and products no matter what the economy is doing.
- Consumer Staples (XLP): Everyone still needs to buy groceries, toothpaste, and soap, making this sector incredibly resilient.
- Utilities (XLU): The demand for electricity, gas, and water is constant, providing these companies with stable, predictable revenue.
Phase 4: The Recession or Contraction
The final phase is the recession, also known as the contraction. Economic activity shrinks, corporate profits take a nosedive, and unemployment starts to climb. Confidence evaporates, causing both businesses and consumers to pull back on spending and investment. During this tough stretch, preserving capital becomes the name of the game.
In this environment, the defensive sectors that started looking good in the late cycle become the stars of the show. Their non-cyclical business models make them a relative safe haven in a stormy market. Their steady demand and reliable dividends offer a much-needed cushion against broader market declines.
For a more granular look at these dynamics, check out our guide on mastering market cycle analysis for smarter trades.
Using Key Indicators to Predict Sector Shifts

Trying to nail a sector rotation strategy without data is just guesswork. It's about reading the right signals at the right time. Think of it like a pilot flying through thick clouds—they aren't guessing, they're trusting their instruments. For investors, economic indicators are those instruments.
These data points act as your dashboard, giving you clues about the economy's underlying health. They help you see around the corner and anticipate when the market is about to shift from one phase to the next.
We can split these indicators into two main groups: leading and coincident. Leading indicators are the forward-looking ones, dropping hints about what’s coming. Coincident indicators give you a real-time snapshot of where we are right now. To make truly proactive moves, you need to get a feel for both.
Leading Indicators: The Future Tellers
For a sector rotation strategy, leading indicators are your most valuable asset. Why? Because they signal a change before it becomes obvious to everyone else. They are the first whispers of an approaching economic storm or a coming boom.
One of the most powerful and watched leading indicators is the yield curve. This chart simply plots the interest rates (yields) of bonds that have the same credit quality but mature at different times. A normal, steepening yield curve—where long-term bonds pay a lot more than short-term ones—screams investor confidence and often precedes economic growth. This is your classic early-cycle signal, suggesting it might be time to rotate into cyclical sectors like Technology or Industrials.
On the flip side, an inverted yield curve—where short-term bonds actually yield more than long-term ones—has been an incredibly reliable predictor of recessions. It’s a massive flashing red light telling investors to get defensive.
Other critical leading indicators to keep on your radar include:
- Manufacturing Orders: A jump in new orders for manufactured goods is a great sign. It points to factories ramping up production, which means more economic activity in the months ahead.
- Building Permits: When more permits for new construction are issued, it signals confidence in the housing market and future economic expansion.
- Stock Market Performance: It might sound a bit circular, but the stock market itself is a leading indicator. After all, it reflects where millions of investors are collectively placing their bets on future corporate earnings.
By keeping a close eye on these forward-looking signals, you can get your portfolio ready for the next phase of the market cycle before the herd catches on. It’s the difference between reacting to old news and acting on fresh intelligence.
Coincident Indicators: The Here and Now
While leading indicators help you peer into the future, coincident indicators tell you exactly where your feet are planted today. They move right alongside the broader economy, confirming which phase of the business cycle we're in. Think of them as your GPS, giving you your precise location on the economic map.
The big one here is Gross Domestic Product (GDP). It’s the broadest scorecard of economic health, measuring the total value of all goods and services a country produces. A rising GDP confirms you're in an expansion, while a falling GDP means you're in a contraction. Simple as that.
Other important coincident indicators to watch are:
- Personal Income: This tracks what people are earning, which has a direct line to consumer spending. When incomes are rising, it’s a clear sign of a healthy expansion.
- Industrial Production: This measures the output of factories, mines, and utilities, giving you a real-time pulse on the industrial heartbeat of the economy.
- Employment Rates: While initial jobless claims are a leading indicator, the overall unemployment rate is a coincident one. It confirms the strength (or weakness) of the job market right now.
A solid sector rotation strategy relies on a balanced view. You use leading indicators to form a theory about where the economy is headed, and then you use coincident indicators to confirm if you’re right. By combining these tools, you move from just speculating to making informed, strategic decisions.
How to Build Your Sector Rotation Strategy
Okay, you’ve got the theory down and know which indicators to watch. Now it's time to roll up your sleeves and build a practical roadmap.
Let's be clear: an effective sector rotation strategy isn't about perfectly timing the market—that's a fool's errand. It's about creating a disciplined, repeatable process that guides you from analysis to execution, helping you make sharp decisions based on the natural flow of the economic cycle.
A winning strategy depends entirely on a clear, step-by-step plan. Follow it consistently, and you'll keep emotion out of the driver's seat. This framework provides the structure for analyzing the market, picking the right sectors, and managing your portfolio over time.
Step 1: Analyze the Macroeconomic Landscape
First things first, you need to get the lay of the land. What’s the big picture of the economy right now? This is where you put your knowledge of leading and coincident indicators to the test. The goal is to figure out where we are in the market cycle so you can anticipate which sectors are getting ready to shine.
Start by asking some critical questions and hunting for data-driven answers:
- What is the yield curve telling us? Is it getting steeper? That often signals an early-cycle recovery. Or is it flattening or even inverted? That’s a classic warning sign of a potential slowdown.
- How are manufacturing and construction looking? A rise in new orders and building permits is a textbook sign of economic health and provides a strong tailwind for cyclical sectors.
- What’s the current state of GDP and employment? These are your coincident indicators. They confirm what's happening right now, helping to validate what the leading indicators are hinting at.
By pulling all this information together, you can form a solid thesis about where the economy is headed. For instance, if you see a steepening yield curve and a jump in building permits, you can confidently hypothesize that we’re in the early innings of a recovery.
Step 2: Identify Promising Sectors
With a clear economic outlook in hand, your next move is to pinpoint the sectors that historically do well in that specific environment. If your analysis points to an early-cycle recovery, you'd naturally start looking at cyclical sectors like Technology (XLK) and Consumer Discretionary (XLY).
On the flip side, if indicators like a flattening yield curve and stubborn inflation suggest we're nearing a late-cycle peak, you'd shift your focus. In that scenario, defensive plays like Utilities (XLU), Consumer Staples (XLP), and Healthcare (XLV) become your primary targets because their demand holds up even when the economy gets rocky.
The whole idea is to tie your sector picks directly to your macroeconomic analysis. You aren't choosing sectors based on a gut feeling or what’s hot in the news this week. It’s all based on a systematic, data-first evaluation. This approach is the bedrock of any solid sector rotation strategy.
This principle of rotating into strength isn't just for stocks. A fascinating study on the S&P 500 Bond Index revealed that a strategy rotating into the top-performing sectors based on three-month returns generated a cumulative outperformance of 26.4% over two decades. You can dig into the details by reading the full research on sector bond rotation strategies.
Step 3: Select and Execute Your Investments
Once you’ve identified your target sectors, you need an efficient way to get exposure. For most investors, sector-specific Exchange-Traded Funds (ETFs) are the perfect tool for the job. They give you instant diversification across an entire sector, they're cheap, and they're incredibly easy to trade.
Think about it. Instead of spending hours researching hundreds of individual stocks, you can just buy a single ETF like XLK to get a piece of the entire technology sector. It simplifies everything and dramatically reduces the risk of one company’s bad news sinking your investment.
After you've picked your ETFs, it's go-time. This means selling your positions in sectors you believe are losing steam and buying into the ones you've identified as the next leaders. Make a clear plan for how and when you'll make these trades—and stick to it. Discipline is what separates strategic investing from emotional gambling.
Sector Rotation Implementation Checklist
To help bring it all together, here’s a simple checklist you can use to implement and maintain your sector rotation strategy. Following these steps will help you stay disciplined and focused on the data.
| Step | Action | Key Consideration |
|---|---|---|
| 1. Analyze | Review key macroeconomic indicators (yield curve, ISM PMI, employment). | Form a thesis on the current and next phase of the economic cycle. |
| 2. Identify | Pinpoint sectors that historically outperform in your identified cycle phase. | Match cyclical sectors to recovery/expansion and defensive sectors to slowdown/recession. |
| 3. Select | Choose liquid, low-cost sector ETFs for your target sectors. | ETFs like XLK, XLY, XLU, etc., offer efficient and diversified exposure. |
| 4. Execute | Rebalance your portfolio by selling lagging sectors and buying leading ones. | Act decisively based on your plan, not on short-term market noise. |
| 5. Monitor | Regularly review economic data and sector performance (e.g., monthly or quarterly). | Be ready to adjust your strategy as the economic cycle evolves. Don't "set and forget." |
| 6. Refine | Log your trades and rationale. Periodically assess what worked and what didn’t. | Use your own experience to fine-tune your approach over time. |
This checklist provides a repeatable framework. The real power of sector rotation comes not from a single brilliant call, but from the consistent application of a sound process over many market cycles.
Of course. Here is the rewritten section, crafted to sound like it was written by an experienced human expert, with a natural flow and varied sentence structure, following all the provided guidelines.
Common Mistakes in Sector Rotation to Avoid
Even the most powerful investment framework has its pitfalls, and a sector rotation strategy is no exception. Successfully navigating the market's cycles takes more than just knowing which sectors to buy; it demands serious discipline and a keen awareness of the common traps that can derail even the best-laid plans.
Understanding these potential missteps is the first step toward avoiding them. I've seen countless investors get tripped up by reacting to market noise, misreading economic signals, or simply underestimating the hidden costs of frequent trading. By facing these challenges head-on, you can build a more resilient and effective strategy.
Over-Trading on Market Noise
One of the most frequent—and costly—errors is confusing short-term market volatility with a genuine shift in the economic cycle. The daily news is a firehose of dramatic headlines and so-called expert predictions, all designed to create a sense of urgency. It's incredibly tempting to make constant, reactive adjustments based on this chatter.
This kind of over-trading is the enemy of a sound sector rotation strategy. It almost always leads to buying high and selling low as you chase fleeting trends instead of focusing on the slow-moving, foundational economic shifts that truly matter. Remember, economic cycles unfold over months and years, not days or weeks.
A successful sector rotation strategy is built on patience and a commitment to long-term macroeconomic signals. The goal is to be a strategic navigator adjusting to the tides, not a frantic sailor reacting to every small wave.
To combat this, you need a system. Establish a firm rebalancing schedule, perhaps reviewing your portfolio quarterly. This disciplined approach forces you to step back, filter out the daily noise, and make decisions based on confirmed data trends rather than gut feelings.
Chasing Yesterday's Winners
It’s human nature to be drawn to what’s currently hot. This "fear of missing out" (FOMO) often leads investors to pile into sectors that have just had a spectacular run, a classic mistake known as performance chasing.
The problem? By the time a sector's outperformance is obvious to everyone, the biggest gains are likely already in the rearview mirror. A sector rotation strategy is predictive, not reactive. Your goal is to anticipate the next leading sector, not jump on the bandwagon of the last one.
For example, pouring money into technology stocks at the very peak of an expansion, just before a downturn, is a textbook late-cycle error. The real opportunity was identifying tech's potential back in the early recovery phase, long before it became the market darling.
Ignoring Transaction Costs and Taxes
Every single trade you make comes with a cost. While commissions aren't the big deal they used to be, other factors like bid-ask spreads, slippage, and especially taxes can quietly eat away at your returns.
Constantly rotating your portfolio can trigger a landslide of short-term capital gains, which are typically taxed at a much higher rate than long-term gains. If you're not careful, these tax implications can turn a seemingly profitable rotation into a net loss.
To keep more of your money, consider these points:
- Use Tax-Advantaged Accounts: Implementing a sector rotation strategy inside an IRA or 401(k) can be incredibly effective. Trades within these accounts don't create immediate tax bills.
- Favor Long-Term Holds: When possible, try to hold positions for over a year. This allows you to qualify for the more favorable long-term capital gains tax rates.
- Consolidate Trades: Instead of making dozens of tiny adjustments, execute your rotation in fewer, more decisive moves according to your rebalancing schedule.
Ultimately, a winning strategy requires a holistic view of risk. To learn more about how to protect your portfolio from these unforeseen drains, you can master risk management in trading with these essential strategies. At the end of the day, effective management is the backbone of any successful long-term investment plan.
Common Questions on Sector Rotation
Once you start digging into a new strategy like sector rotation, the practical questions always start to bubble up. It's one thing to understand the theory, but another to feel confident putting your money to work. Let's clear up a few of the most common questions that pop up.
How Often Should I Rebalance My Portfolio?
This is a classic "it depends" question, but the real answer comes down to finding a balance between being responsive and not over-trading. If you rebalance too often, say every week, you risk getting whipsawed by short-term market noise. You'll end up chasing your tail and racking up transaction costs and potential tax headaches for no good reason.
On the other hand, if you wait too long—like once a year—you could completely miss a major shift in the economic cycle. For most people, a disciplined quarterly review hits the sweet spot. It’s frequent enough to let you adapt to significant macroeconomic changes but keeps you from making knee-jerk decisions based on a scary headline or a random Tuesday dip. The goal is to act on confirmed, durable trends, not daily chatter.
Can I Apply This Strategy in an IRA?
Yes, and honestly, it’s one of the best places to do it. Running a sector rotation strategy inside a tax-advantaged account like an IRA or 401(k) is incredibly effective because it shields your moves from the tax man.
Since you can buy and sell positions within the account without triggering immediate capital gains taxes, you're free to rotate between sectors as the strategy dictates. This lets you focus purely on making the right strategic move, rather than having to calculate how much of your potential return will get eaten up by taxes. That tax deferral is a massive advantage for any active strategy.
Is Sector Rotation the Same as Stock Picking?
Not at all—and this is a really important distinction to grasp. Stock picking is what we call a bottom-up approach. You’re like a detective, digging into individual companies to find a hidden gem, regardless of what the overall economy is doing. You’re focused on that one company's management, its balance sheet, and its competitive edge.
Sector rotation is the complete opposite; it's a top-down strategy. You start with the 30,000-foot view of the macroeconomic landscape to figure out which broad areas of the economy are set to thrive. The primary decision isn't which company to buy, but which industry to be in. Most of the time, you'll use broad-based ETFs to get that exposure, which reinforces the core idea: you're betting on an economic trend, not the fate of a single stock.
Ready to stop guessing and start making data-driven decisions? ChartsWatcher provides the powerful scanning and analysis tools you need to identify market trends and execute your sector rotation strategy with precision. Customize your dashboards, track sector performance in real-time, and get the edge you need to stay ahead of the curve. Start your free trial of ChartsWatcher today.
