7 Stocks That Are Breaking Out: A 2025 Technical Guide
The term 'breakout' electrifies traders, signaling a stock's explosive escape from a period of consolidation to new price territory. These are the moments where significant wealth can be created. But identifying true stocks that are breaking out from the fakes requires more than just watching a price cross a line. It demands a sharp eye for the underlying technical patterns, volume signatures, and fundamental catalysts that separate a brief surge from a sustained uptrend. While technical analysis reveals price movements, a truly powerful stock breakout is often underpinned by robust financial health. For a comprehensive look into a company's liquidity and solvency, a complete guide to understanding cash flow statements can provide invaluable insights.
This guide dissects seven iconic breakout stocks, offering a masterclass in pattern recognition. We'll explore the DNA of each breakout-from classic Cup and Handles to modern AI-driven surges-providing a practical playbook you can use to spot the market's next big winners. By analyzing these historical examples, you'll learn not just what happened, but why, and how to apply those lessons to today's market with precision. This article moves beyond theory, focusing on the specific triggers and market conditions that created these powerful moves.
1. NVIDIA (NVDA) - The AI Chip Breakout
NVIDIA's monumental ascent serves as a textbook case of a fundamentally driven technical breakout. The stock's dramatic surge from under $150 in late 2022 to over $500 by early 2024 wasn't just a fleeting price spike; it was a paradigm shift fueled by the explosive, real-world demand for its graphics processing units (GPUs) in the burgeoning artificial intelligence sector. As generative AI and large language models (LLMs) moved from niche concepts to mainstream technology, NVIDIA's hardware became the essential infrastructure, creating a powerful catalyst for its breakout.
This move is a prime example of how stocks that are breaking out often combine a compelling narrative with overwhelming technical strength. NVIDIA shattered multiple long-term resistance levels on unprecedented trading volume, signaling intense institutional buying pressure and confirming the move's validity.
The Anatomy of the Breakout
The breakout unfolded in several key stages. A critical trigger occurred in October 2022, when the stock cleared the $120-$140 resistance zone, a move that initiated a powerful uptrend. This was followed by an explosive earnings-driven gap up in May 2023, which catapulted the stock from around $300 to nearly $400, establishing new all-time highs and cementing its leadership role in the AI revolution. During pullbacks, the stock consistently found support at its 50-day moving average, a classic sign of a healthy, robust uptrend respected by institutional traders.
This infographic highlights the sheer force behind NVIDIA's breakout, visualizing the dramatic price appreciation and the surge in trading volume that confirmed institutional interest.
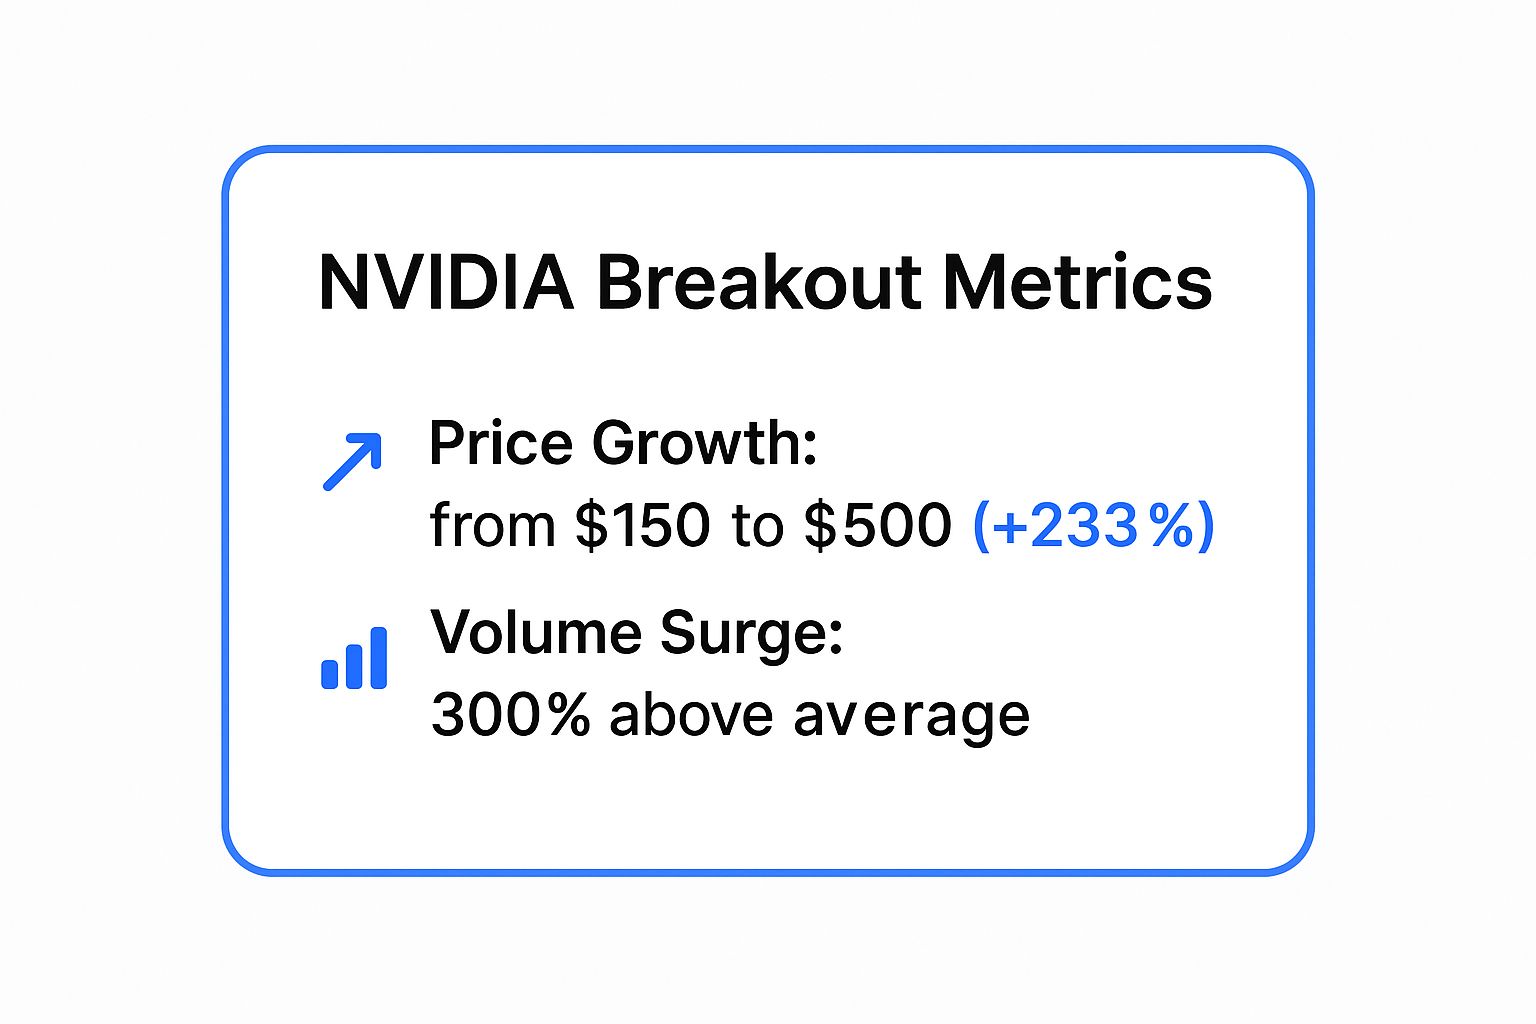
The combination of a 233% price increase and a 300% volume surge underscores the conviction behind the breakout, demonstrating that this was far more than speculative excitement.
Actionable Trading Strategies
For traders looking to capitalize on similar breakouts, NVIDIA's run offers several key lessons:
- Confirm with Volume: A price breakout is only reliable if confirmed by a significant increase in trading volume. This indicates strong conviction from buyers.
- Resistance Becomes Support: Once a key resistance level is broken, watch for it to act as a new support floor on subsequent pullbacks. This offers a lower-risk entry point.
- Scale Out Profits: In a powerful trend, consider taking partial profits at key psychological levels (like $200, $300, $400) to lock in gains while letting the remainder of your position run.
- Use Moving Averages for Risk Management: A simple but effective strategy is to place a stop loss below a key moving average, such as the 50-day, to protect against a trend reversal. To find more setups like this, you can learn more about how to use a breakout stock screener with proven strategies from pro traders.
This video provides further analysis of the market dynamics that contributed to NVIDIA’s historic run.
2. Tesla (TSLA) - The Cup and Handle Classic
Tesla's explosive breakout from 2019 to 2020 offers a masterclass in one of the most revered chart patterns: the cup and handle. After years of range-bound trading, the stock carved out a massive multi-year base before launching into a historic rally. This move was a perfect fusion of a classic technical pattern with a powerful fundamental shift, as Tesla began reporting consistent profits and solidified its future with its inclusion in the S&P 500.
This rally is a quintessential example of how stocks that are breaking out can emerge from long consolidation periods. The cup and handle pattern, popularized by William O'Neil, signaled a buildup of immense buying pressure. The subsequent breakout above the handle's resistance triggered a move that ultimately delivered a greater than 10x return, cementing Tesla's place in market history.

The Anatomy of the Breakout
The pattern formed over several years. The "cup" was a long, rounded bottom that developed between 2017 and 2019. The "handle" formed in late 2019 as a brief, shallow pullback with decreasing volume, which is a key characteristic indicating healthy consolidation before a major move. A surprise profit in Q3 2019 provided the initial catalyst, driving momentum into the pattern.
The critical breakout occurred in December 2019 when the stock definitively cleared the handle's resistance near the split-adjusted $360 level. This move was confirmed by a massive surge in trading volume, signaling that large institutions were accumulating shares. The rally accelerated dramatically, pushing past $900 by early 2020 and attracting a wave of new retail investors, particularly after its August 2020 stock split.
Actionable Trading Strategies
Tesla's classic setup provides a clear roadmap for trading similar patterns:
- Identify the Pattern Correctly: Look for a U-shaped "cup" followed by a shorter, downward-drifting "handle." Volume should diminish during the handle's formation, indicating a lack of selling pressure.
- Wait for Volume Confirmation: A true breakout must occur on volume significantly above its 50-day average. This confirms institutional conviction and reduces the odds of a false move.
- Set a Clear Stop Loss: Following William O'Neil's method, a protective stop loss can be placed 7-8% below the breakout entry point, typically just under the handle's low.
- Scale Into the Position: Rather than committing all your capital at once, consider buying an initial position on the breakout and adding more as the stock proves its strength by holding above the breakout level. To truly master trading this powerful pattern, you can learn more about cup and handle stocks.
3. Shopify (SHOP) - The COVID E-commerce Surge
Shopify's explosive breakout during the 2020 global pandemic highlights how an external catalyst can transform a company's fundamental story and ignite a historic stock run. As lockdowns forced businesses online, Shopify's platform became an essential lifeline, leading to a massive acceleration in subscriber growth and merchant adoption. This fundamental shift powered the stock's surge from a consolidation base near $400 in March 2020 to over $1,700 by late 2020, offering a clear lesson in how macro events can create powerful breakouts.
This move demonstrates how the best stocks that are breaking out often ride a powerful, undeniable secular trend. The stock didn't just drift higher; it gapped up and broke through key resistance levels with immense force, signaling that institutional investors were aggressively building positions to capitalize on the new e-commerce paradigm.

The Anatomy of the Breakout
The breakout's initial trigger was the pandemic-driven market sell-off in March 2020, where Shopify quickly found its footing and ripped through the $400-$500 resistance zone. This initial move was followed by a series of tight consolidations, or "flags," such as the one in July 2020, which provided low-risk entry points for traders to join the established uptrend. Throughout its ascent, the stock formed multiple "3-week tight" patterns, a bullish signal often watched by growth stock traders like Mark Minervini, indicating accumulation and a pause before the next leg up. The trend was so powerful that pullbacks were shallow and brief, often finding support well above the 50-day moving average.
Actionable Trading Strategies
Shopify's run provides a masterclass in managing a fast-moving growth stock. Traders can learn from these key strategies:
- Identify Tight Consolidations: After a strong initial move, look for periods of tight, low-volatility price action. A breakout from these patterns often signals a continuation of the primary trend.
- Take Partial Profits: In a powerful trend, it's prudent to take partial profits after a 20-25% gain from your entry point. This locks in gains and reduces risk while allowing you to participate in further upside.
- Monitor for Distribution: Watch for "distribution days," which are instances where the stock closes down on higher-than-average volume. A cluster of these days can be an early warning sign that institutional selling is beginning and the trend may be ending.
- Use Trailing Stops: To ride a strong trend, use a key moving average, like the 10-week or 50-day, as a trailing stop loss. This helps you stay in the trade as long as the uptrend remains intact without giving back too much profit.
4. Meta Platforms (META) - The Efficiency Breakout
Meta's incredible resurgence is a masterclass in the turnaround breakout, where a deeply beaten-down stock reverses course on a powerful fundamental catalyst. After a brutal 75% decline in 2022, the stock's surge from near $90 to over $350 in 2023 was driven by Mark Zuckerberg’s "Year of Efficiency" narrative. This strategic pivot, focusing on cost-cutting and operational discipline, restored investor confidence and provided the fuel for a massive technical reversal.
This move perfectly illustrates how stocks that are breaking out can emerge from periods of extreme pessimism. Meta’s breakout wasn't just a relief rally; it was a fundamental re-rating of the company's value, combining a leaner operating model with its immense AI and advertising monetization potential.
The Anatomy of the Breakout
The turnaround began to take shape with a classic double bottom pattern in late 2022 near the $90 level, signaling a potential exhaustion of selling pressure. The true catalyst, however, arrived with the February 2023 earnings report. The combination of better-than-expected results and the new efficiency mandate triggered a massive 25% gap-up, decisively breaking the stock out of its downtrend.
This initial surge was followed by periods of consolidation, with the stock proving its newfound strength. Key levels, like the post-earnings gap and former resistance zones, began acting as solid support. Another strong earnings report in July 2023 confirmed the efficiency gains were taking hold, propelling the stock to new recovery highs and validating the turnaround thesis for institutional investors.
Actionable Trading Strategies
For traders identifying similar turnaround opportunities, Meta’s recovery offers critical lessons:
- Look for Severe Declines: Turnaround breakouts often occur after a stock has fallen 50% or more, clearing out weak hands and creating a low valuation base.
- Wait for a Fundamental Catalyst: A technical bottom pattern is not enough. Wait for a concrete event, like an earnings beat or strategic shift, to confirm the narrative has changed.
- Use Weekly Charts: For beaten-down stocks, weekly charts provide a clearer picture of long-term support and resistance levels, helping to filter out daily noise.
- Scale In Your Position: Instead of going all-in at once, build a position in stages. Enter a partial position on the initial breakout and add more on successful retests of support to manage risk as confidence in the new trend builds.
5. AMD (Advanced Micro Devices) - The Market Share Breakout
AMD's incredible journey from under $2 in 2016 to over $100 by 2020 showcases a classic fundamental turnaround driving a multi-year technical breakout. The stock's powerful ascent was not based on short-term hype but on a sustained, successful strategy to capture significant market share from its chief rival, Intel. This was fueled by the revolutionary Zen architecture, which re-established AMD as a competitive force in both the consumer and high-margin server processor markets.
This long-term move is a perfect illustration of how stocks that are breaking out can emerge from prolonged periods of underperformance when a deep-seated business transformation takes hold. AMD shattered a decade-long base, signaling to the market that a fundamental shift was underway. The breakout was validated by continuously improving earnings and market share reports, attracting long-term institutional capital.
The Anatomy of the Breakout
The breakout occurred over several years, offering multiple entry points for savvy traders. The initial, critical move happened in 2016 when the stock decisively broke above the $8 resistance level, a ceiling that had held for years. This was followed by periods of consolidation, like the one in 2019, where the stock built a base before breaking out again above $35. Each breakout was propelled by positive product cycle news and market share gains.
The 2020 acceleration, pushing the stock toward $100, was intensified by the pandemic-driven demand for computing power. Throughout this multi-year trend, AMD formed several continuation patterns, such as flags and pennants, which are classic signs of a healthy and sustainable uptrend.
Actionable Trading Strategies
AMD's multi-year run provides a blueprint for trading long-term turnaround stories:
- Analyze the Longer Timeframe: For multi-year breakouts, use weekly and monthly charts to identify major support and resistance levels. This helps filter out the daily noise and focus on the primary trend.
- Buy the Consolidations: It's often risky to chase the initial explosive move. Instead, look for entry points during periods of consolidation within the established uptrend. A breakout from a flag or pennant pattern on the weekly chart can be a powerful signal.
- Monitor Fundamental Catalysts: Pay close attention to product announcements, earnings reports, and market share data. In AMD's case, news about its Zen processors and EPYC server chips were key catalysts.
- Use Longer-Term Moving Averages: For managing risk in a long-term trend, the 50-week moving average is often more effective than daily averages. A weekly close below this level could signal a major trend change.
6. Netflix (NFLX) - The Streaming Dominance Breakout
Netflix's powerful breakout from 2017 to 2018 is a classic example of a dominant market leader asserting its fundamental strength through technical price action. The stock's climb from around $150 to over $400 was driven by undeniable evidence of its growing moat: blowout subscriber growth, successful international expansion, and a content library that was becoming a cultural phenomenon. As Netflix consistently crushed Wall Street estimates, it proved its business model was scalable and highly profitable.
This surge demonstrates how stocks that are breaking out often represent companies that are not just growing, but fundamentally reshaping an entire industry. Netflix shattered a key multi-month consolidation base around $200 in October 2017 on massive volume, signaling that institutional investors were aggressively buying into its global growth narrative and leaving no doubt about the trend's validity.
The Anatomy of the Breakout
The breakout's primary catalyst was a series of explosive earnings reports. A critical moment occurred in October 2017 when the stock gapped up and cleared the psychological $200 level after reporting a significant subscriber beat. This was followed by another massive earnings-driven gap-up in January 2018, which propelled the stock past $250 and initiated a parabolic ascent toward $400.
During this powerful uptrend, pullbacks were notably shallow and brief, often forming "high tight flag" patterns. These patterns are classic signs of immense underlying strength, as the stock digests gains for only a few days before buyers rush back in, making it challenging for hesitant traders to find a low-risk entry.
Actionable Trading Strategies
The Netflix breakout offers crucial lessons for trading high-momentum, market-leading stocks:
- Focus on Key Metrics: For subscription-based businesses, pay close attention to user growth metrics (like subscriber numbers or MAUs) in earnings reports, as these are often the primary catalyst for major moves.
- Buy High Tight Flags: In the strongest uptrends, stocks don't pull back to major moving averages. Learn to identify and buy small pullbacks or consolidations, known as flags, for entry points.
- Use Tighter Stops: Parabolic moves are volatile. Instead of a wide stop, consider using a tighter stop-loss (e.g., 3-5% or below the low of the prior day) to protect capital from sharp, sudden reversals.
- Manage Position Size: The high volatility and price of leading growth stocks warrant smaller position sizes. This allows you to participate in the upside while managing the increased risk of sharp drawdowns.
7. Moderna (MRNA) - The Biotech Catalyst Breakout
Moderna’s meteoric rise during the COVID-19 pandemic is a classic example of a biotech catalyst-driven breakout. The stock's explosive move from around $20 in early 2020 to a peak near $450 in 2021 was not based on gradual earnings growth but on a series of high-stakes, binary events tied to its vaccine development. This surge was fueled by news of successful clinical trials, regulatory approvals, and government contracts, turning potential into a tangible, world-changing product.
This type of move demonstrates how stocks that are breaking out in the biotech sector are often tied to specific, scheduled events rather than broad market trends. Moderna's breakout was a direct reaction to fundamental catalysts, where each positive data release acted as rocket fuel, pushing the stock through previous resistance levels on massive volume and confirming intense investor conviction.
The Anatomy of the Breakout
The breakout occurred in distinct, news-driven phases. The initial surge in March 2020 followed the announcement of its vaccine candidate, which immediately put the company on the global stage. This was followed by a significant gap-up in July 2020 after the company published positive Phase 3 trial results. The most powerful leg of the rally came in November 2020, when high-efficacy data was released, virtually guaranteeing regulatory approval and sending the stock into a parabolic uptrend.
Throughout this period, pullbacks were often shallow and bought up quickly ahead of the next anticipated catalyst. Each piece of positive news created a new support level, as investors recalibrated the company's valuation based on the increasing probability of success.
Actionable Trading Strategies
Trading catalyst-driven biotech breakouts requires a unique approach focused on event risk management. Moderna's run offers several key takeaways:
- Use Smaller Position Sizes: Due to the binary nature of trial results or FDA decisions, these plays carry higher risk. Limit position sizes to a small percentage of your portfolio to mitigate potential losses.
- Set Profit Targets in Advance: The emotional volatility surrounding major biotech news can make it difficult to sell. Predetermine your profit-taking levels before entering a trade to ensure disciplined execution.
- Track Key Dates: Use an FDA calendar or company news releases to stay ahead of known catalyst dates. The anticipation leading up to these events often creates tradable volatility.
- Have a Strict Exit Plan: Hope is not a strategy. Define your exit point for both a successful outcome (profit target) and a negative one (stop loss) before the news is released. Don't chase a huge gap-up; wait for a period of consolidation to find a lower-risk entry.
Breakout Stocks Comparison Overview
| Stock / Pattern | Implementation Complexity 🔄 | Resource Requirements ⚡ | Expected Outcomes 📊 | Ideal Use Cases 💡 | Key Advantages ⭐ |
|---|---|---|---|---|---|
| NVIDIA (NVDA) AI Chip Breakout Ascending Triangle / Bull Flag | Medium - requires volume & MA confirmation | High - needs strong market liquidity and monitoring | High - rapid price rise (+233%), sustained momentum | AI-driven growth stocks, momentum trading | Strong fundamental AI catalyst, institutional support |
| Tesla (TSLA) Cup and Handle Classic | Medium - pattern formation over 12 months | Moderate - attention to handle volume & stops | Very High - 10x increase over breakout period | Long-term growth with clear risk control | Well-defined pattern, strong retail/institutional conviction |
| Shopify (SHOP) COVID E-commerce Surge Flat Base / Trend Following | Low to Medium - trend following with clean setups | Moderate - active re-entry and stop management | High - strong multi-month surge with momentum | Secular growth in e-commerce, momentum plays | Secular tailwinds, few false signals |
| Meta Platforms (META) Efficiency Breakout Double Bottom / Turnaround | Medium - turnaround signals needed | Moderate - fundamental catalyst confirmation crucial | Medium to High - rapid breakout after decline | Contrarian plays, turnaround investing | Clear cost-cutting narrative, undervalued entry points |
| AMD Market Share Breakout Multi-year Base / Stair-step | High - requires patience for multi-year bases | Moderate to High - long-term trend tracking | High - multi-year 50x+ return potential | Competitive turnaround, industry leadership plays | Multiple entry points, strong fundamental growth |
| Netflix (NFLX) Streaming Dominance Breakout High Tight Flag | Low to Medium - momentum stock with quick pullbacks | Moderate - tight stop losses for volatility control | High - steady advance with consistent all-time highs | Momentum with leading market position | Recurring revenue, high brand loyalty |
| Moderna (MRNA) Biotech Catalyst Breakout Parabolic / Catalyst-Driven | High - binary event-driven, unpredictable | High - requires event tracking and risk management | Very High - explosive gains but volatile | Catalyst-driven biotech events | Massive upside potential, clear event catalysts |
From Past Patterns to Future Profits
The seven breakout case studies we have dissected, from NVIDIA's AI-fueled ascent to Moderna's catalyst-driven explosion, offer more than just a retrospective on market history. They serve as tangible blueprints, illustrating the powerful convergence of technical patterns, fundamental strength, and institutional volume that ignites monumental stock moves. Each example, whether it's Tesla's classic cup-and-handle formation or Meta's efficiency-driven recovery, reinforces a central, actionable truth: significant uptrends rarely happen in a vacuum. They leave a trail of clues for the prepared trader to follow.
The ultimate takeaway is that identifying high-probability setups is a learnable skill, not an act of guesswork. Mastering this skill involves recognizing the distinct signatures of a breakout before the majority of the market catches on. It requires a systematic approach to analyzing price action, volume spikes, and the underlying narrative driving the stock. The stocks we've analyzed underscore the importance of this multi-faceted approach. A breakout on a chart without a supporting fundamental story or a surge in volume is often a trap, not an opportunity.
Turning Theory into Actionable Trades
So, how do you translate these historical lessons into a real-time trading strategy? The key is moving from manual, time-consuming chart review to an automated, efficient discovery process. In today's fast-paced market, the window of opportunity for a breakout can be fleeting. You need a system that can scan thousands of tickers simultaneously to pinpoint the select few that meet your specific criteria for stocks that are breaking out.
This is where technology becomes your greatest ally. To effectively apply the lessons from NVDA, TSLA, and the others, consider these next steps:
- Define Your Breakout Criteria: Based on the examples in this article, what constitutes a breakout for your strategy? Is it a cross above the 50-day moving average on 200% of normal volume? A specific candlestick pattern forming near a key resistance level? Write down your non-negotiable rules.
- Systematize Your Scanning: Use a robust stock screener to build scans based on your defined criteria. This transforms your strategy from a reactive hunt into a proactive, systematic process, ensuring you never miss a potential setup that fits your plan.
- Layer in Fundamental Analysis: Once your scanner flags a technical setup, perform a quick fundamental check. Does the company have an upcoming earnings report, a new product launch, or positive sector momentum? This adds a layer of confirmation to the technical signal.
The Path Forward: Consistency and Technology
The journey from a novice trader to a consistently profitable one is paved with discipline and the right tools. The legendary breakouts of the past are your guide, teaching you the patterns to look for. Your disciplined execution of a well-defined plan is what will turn that knowledge into profit. By embracing modern scanning technology, you can bridge the gap between historical analysis and future success, systematically identifying the next wave of stocks that are breaking out with precision and confidence.
Ready to stop chasing breakouts and start anticipating them? Build your own custom scans and get real-time alerts on the market's most promising setups with ChartsWatcher. Visit ChartsWatcher to discover how our powerful, intuitive platform can help you find the next big market movers before they happen.
