Unlock Success with Our Powerful Stock Market Scanner
A stock market scanner is, at its heart, a high-powered search engine built specifically for traders. It sifts through thousands of stocks in real-time, pulling out only the ones that match your exact trading criteria. This automation saves you countless hours of digging through charts manually.
How a Stock Scanner Finds Trading Opportunities
Think about trying to find a single grain of gold in a massive, fast-moving river. Doing it by hand would be impossible. You'd need a sophisticated filtering system to sift through the rushing water and isolate what you're looking for. A stock market scanner works on the very same principle.
The stock market is a river of data, with millions of data points—prices, volume, news, and technical indicators—flowing every single second. A scanner is your automated filtering system. Instead of getting overwhelmed by the noise, you tell the scanner exactly what your "gold" looks like.
Setting The Filters
The real magic of any stock scanner is its ability to apply filters. These are simply the rules you create to define what a potential trading opportunity means to you. You can layer multiple criteria to create a highly specific, targeted search.
For instance, a day trader might set up a scan looking for:
- Price: Stocks trading between $10 and $50.
- Volume: Stocks with trading volume over 500,000 shares in the first hour.
- Performance: Stocks that are up more than 5% from yesterday's close.
- Technical Indicator: Stocks where the 20-day moving average just crossed above the 50-day moving average.
The scanner then watches the entire market. The moment a stock meets all these conditions at the same time, it pops up on your results list. It turns an impossible task into a manageable one.
A major challenge for any trader is monitoring every ticker on the market. Modern data feeds can stream real-time prices for over 9,000 U.S. equities, making manual tracking completely impractical without a powerful scanning tool.
From Raw Data To Actionable Insights
Once you've set your filters, the scanner gets to work, processing a constant stream of data from the stock exchanges. This includes every bid, ask, and trade execution. The scanner’s software constantly compares this flood of incoming data against your rules.
For a swing trader, the criteria might look a bit different, focusing more on daily or weekly chart patterns. Their scan might search for stocks that have pulled back to a key support level or are showing signs of breaking out from a consolidation period. Understanding these formations is crucial, and you can learn more in our guide to 8 day trading chart patterns every trader should know.
Stock scanners have become essential tools for investors everywhere, enabling them to analyze thousands of stocks from major exchanges like the NYSE, Nasdaq, London Stock Exchange (LSE), and many others. To get a sense of how these platforms cover global markets, you can explore resources from providers like MarketInOut.com.
Ultimately, a good scanner transforms market noise into a clear signal. It automates the discovery process, freeing you up to spend your time analyzing high-potential setups and making strategic decisions instead of just searching for them.
Must-Have Features of a Powerful Stock Scanner
Choosing a stock scanner is a lot like picking out a car. A basic sedan will get you from point A to point B, no problem. But if you want to compete, you’ll need a high-performance race car—something with the speed, precision, and data to give you a real edge. Not all scanners are created equal, and the features they offer will directly define your ability to find and act on trading opportunities.
It's about more than just a checklist. We need to dig into why certain features are non-negotiable for any serious trader. These are the components that elevate a simple filtering tool into a professional-grade command center for navigating the markets. The right combination of features makes sure you not only get timely information but can also analyze it effectively.
Real-Time Data Feeds
For anyone actively trading, delayed data is worthless. The single most critical feature of any competitive stock market scanner is a real-time data feed. This means the scanner is pulling price and volume information straight from the exchanges with almost no delay, often measured in milliseconds.
Using a scanner with 15-minute delayed quotes is like trying to drive while only looking in the rearview mirror. You see where the market was, not where it is now. For day traders and scalpers who live and die by their entry and exit points, real-time data is everything. Without it, you're operating at a massive disadvantage.
The chart below shows just how much a quality scanner can boost a trader’s performance and efficiency.
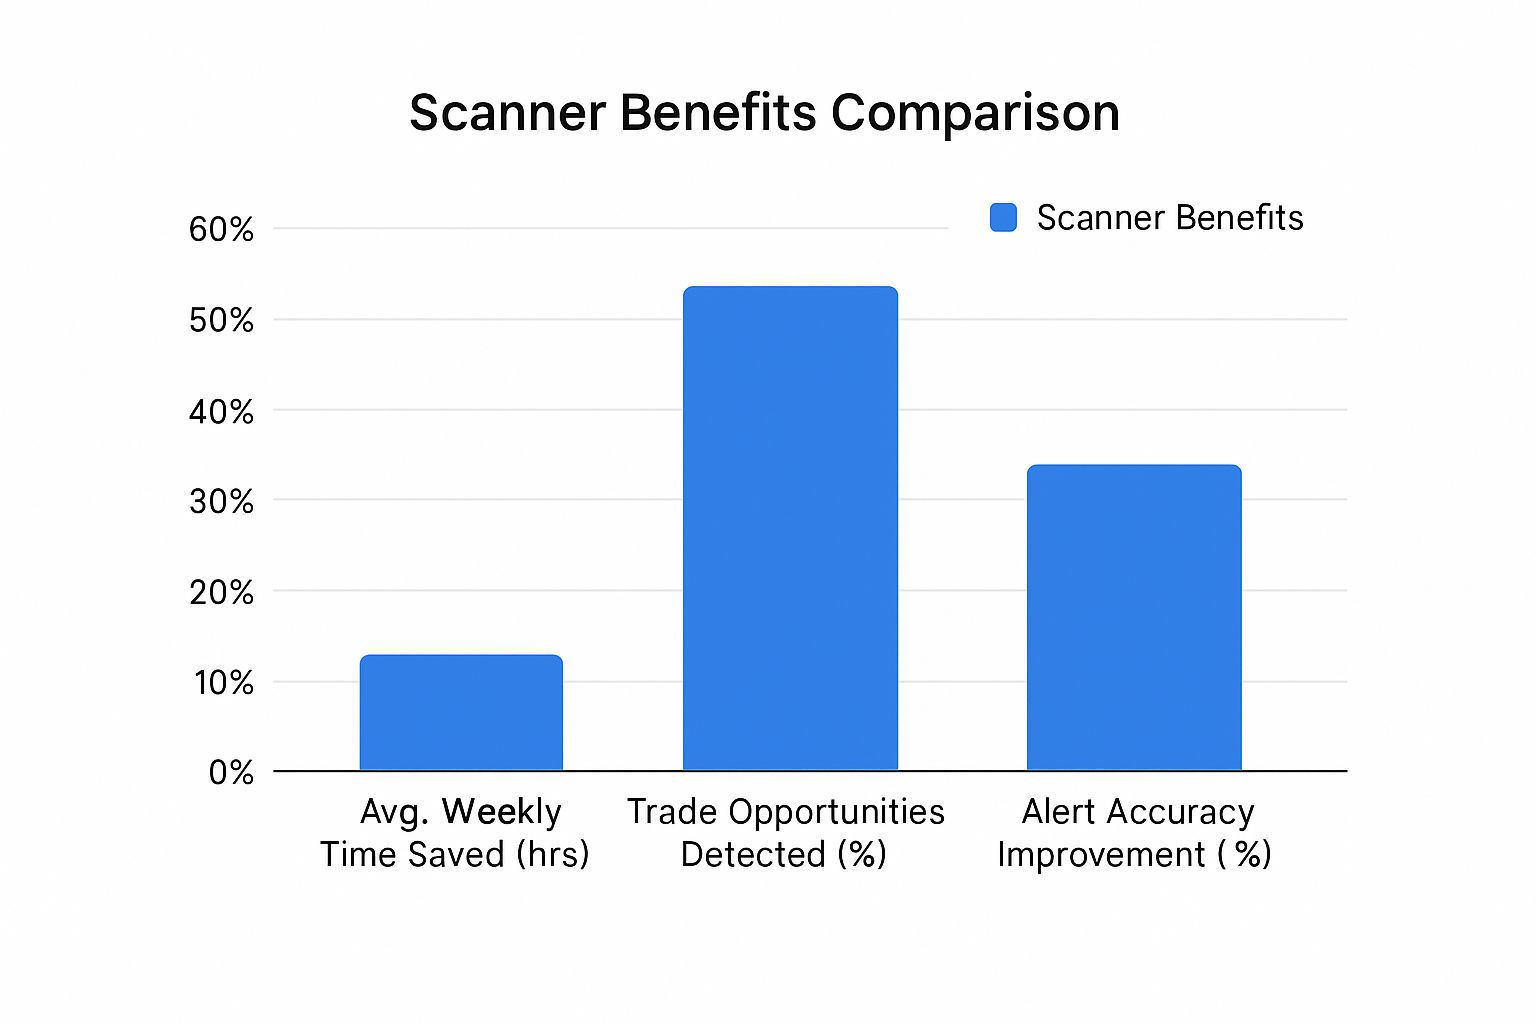
As you can see, the benefits go way beyond just saving time. They translate directly into more identified opportunities and higher-quality trade signals.
Comparing Stock Scanner Capabilities
Not all scanners are built alike. The gap between a basic, free tool and a professional-grade platform can be huge. The following table breaks down what you can typically expect from each, highlighting why serious traders almost always opt for advanced solutions.
| Feature | Basic Scanner | Advanced Scanner |
|---|---|---|
| Data Speed | Delayed (15+ minutes) | Real-time, streaming data (milliseconds) |
| Filtering Options | Simple metrics like price, volume, and market cap | Granular filters using technical indicators, fundamental data, and custom formulas |
| Market Coverage | U.S. stocks only, standard trading hours | U.S. and international stocks, pre-market & after-hours scanning |
| Alerts | None or basic email alerts | Instant audio, visual, and SMS/email alerts |
| Customization | Limited to pre-set scans | Fully customizable scans and the ability to build and save complex strategies |
| Charting Integration | None or opens a separate, basic chart window | Seamless integration where scan results link directly to detailed, interactive charts |
| Backtesting & Simulation | Not available | Often includes features to test scan strategies against historical data before risking real capital |
| AI & Automation | Not available | May include AI-driven trade ideas, automated pattern recognition, or multi-factor alerts |
Ultimately, while a basic scanner can be useful for getting a general feel for the market, an advanced scanner is what gives you the power to execute a specific, nuanced strategy with precision.
Advanced Filtering and Customization
A truly powerful scanner lets you build incredibly specific, complex scans that are tailored to your strategy. This goes so far beyond basic filters like price and volume. You need a tool that gives you granular control.
Here are some of the advanced filtering capabilities you should be looking for:
- Technical Indicators: The ability to scan for specific technical events. Think stocks where the 20-day moving average is crossing above the 50-day moving average, or where the RSI (Relative Strength Index) has just dropped below 30. Other must-haves include MACD and Bollinger Bands.
- Fundamental Data: If you're a swing or position trader, filtering by fundamentals is key. You'll want to scan for metrics like market capitalization, P/E ratio, earnings per share (EPS), and dividend yield.
- Pre-Market and After-Hours Scanning: The market doesn't just stop. Big moves often start in the extended hours, so your scanner needs to be able to track activity before the opening bell and after the close.
- Custom Formulas: This is the pinnacle of control. The best platforms, like Trade Ideas or TC2000, allow you to combine multiple indicators and metrics to create your own unique scanning formulas that define your perfect setup.
A classic rookie mistake is creating scans that are either way too broad (giving you thousands of useless results) or far too narrow (finding nothing at all). The real art is building a focused filter that consistently delivers a manageable list of high-probability setups.
This level of customization is what allows you to perfectly align the tool with your trading style, whether you’re hunting for momentum breakouts, reversal patterns, or deeply undervalued companies.
Alerting Systems and Charting Integration
Finding the opportunity is only half the battle. You have to be notified in time to actually do something about it. A robust alerting system is a non-negotiable feature. It allows you to set up notifications—visual pop-ups, sounds, or even emails and text messages—that fire the second a stock meets your criteria. This frees you from having to stare at your screen all day long.
On top of that, the best scanner platforms seamlessly integrate scanning with charting. When a stock pops up on your results list, you should be able to click it and instantly see a detailed chart. This lets you quickly analyze the price action, volume, and specific indicators that triggered the alert, helping you make a much more informed decision on the spot.
Matching Your Scanner to Your Trading Strategy
A stock scanner isn't a one-size-fits-all gadget; it's a precision instrument. Using the same generic scan for every trade is like a mechanic trying to fix an entire engine with just one wrench. It just doesn't work.
You only unlock a scanner's real power when you tailor its filters to your specific trading style. When you do this, it stops being a simple list generator and becomes a strategic partner, feeding you opportunities that fit the exact setups you've trained yourself to find.
Let's break down how different traders can build the right scanner blueprint for their needs.
Blueprint for the Day Trader
Day traders live and breathe speed and volatility. Their entire game is about jumping on small, fast price moves all day long. For them, a scanner has to be a real-time weapon, pinpointing momentum and liquidity the second it appears.
The focus is almost exclusively on what's happening today. A day trader’s scanner is tuned to find stocks that are already making noise and showing unusual activity that could signal a predictable pattern is about to unfold.
Here’s a typical setup for a day trader hunting for "gappers" or stocks with big pre-market volume:
- Timeframe: Pre-market (before 9:30 AM ET) and the first hour of trading.
- Price: Above $5 to filter out the riskiest penny stocks, but below $100 where stocks often have more room to run.
- Volume: At least 250,000 shares traded in the pre-market.
- Relative Volume (RVol): At least 3x the stock's normal volume for that time of day. This is a critical sign of unusual interest.
- Price Change: Gapping up or down by 3% or more from yesterday's close.
This scan is built to find stocks making a splash before the market even opens. It gives the trader a curated watchlist of tickers to watch for follow-through or reversal patterns right at the opening bell.
Blueprint for the Swing Trader
Swing traders play a different game. They hold positions for a few days to a few weeks, aiming to catch a much larger "swing" in price. They're not worried about the minute-to-minute chatter; their approach is more patient and focused on end-of-day data and clear chart patterns.
A swing trader’s scanner is designed to find stocks that are coiling up for a potential move over the next several days. They're looking for structure, not just a momentary spark.
A swing trader uses a scanner to find stocks approaching a critical inflection point, like a coiled spring ready to release. The scan finds the setup; the trader’s analysis confirms the timing.
A common swing trading scan might look for criteria like these:
- Trend: The stock is trading above its 50-day and 200-day simple moving averages (SMAs), confirming it's in a healthy uptrend.
- Pattern: The stock is pulling back, having dropped for 2-4 days in a row, but is still holding above a key support level like the 50-day SMA.
- Volume: Daily volume is above its 50-day average, which shows there's enough liquidity.
- Volatility: The Average True Range (ATR) is within a reasonable limit to help manage risk.
This scan deliberately ignores the intraday chaos. Instead, it flags stocks showing a temporary pause within a bigger uptrend—a textbook "buy the dip" opportunity.
Blueprint for the Long-Term Investor
Long-term investors, or position traders, are focused on a company's fundamental health and value. They might hold a stock for months or even years. For them, a stock scanner (often called a "screener") is used to sift through the market for financially strong companies that might be undervalued.
Their criteria are almost entirely based on financial metrics, not short-term price charts. This is where advanced screeners shine. For instance, you can use them to find companies with strong fundamentals, such as Home Depot (market cap $357.29B, P/E ratio 24.3x) or SAP ADR (market cap $351.60B, P/E 52.8x), or even high-growth but speculative plays like Palantir Technologies (market cap $351.13B, P/E 593.2x). You can explore how these metrics work yourself on platforms like Investing.com's stock screener.
A fundamental scan for a long-term investor might include these filters:
- Market Capitalization: Greater than $10 billion to focus on stable, large-cap companies.
- Price-to-Earnings (P/E) Ratio: Below 20 to find potentially undervalued stocks.
- Debt-to-Equity Ratio: Less than 0.5 to ensure the company isn't buried in debt.
- Dividend Yield: Greater than 2% for companies that pay shareholders.
- EPS Growth: Positive earnings per share growth over the last five years.
This disciplined approach filters out the noise and hype, leaving you with a list of financially solid companies that are worth a deeper look for your long-term portfolio.
How to Choose the Right Stock Scanner
Finding the perfect stock market scanner isn’t about chasing the “best” tool on the market. It’s about finding the one that fits your trading DNA like a glove. The most powerful, feature-packed scanner is completely useless if it doesn't align with your personal strategy, budget, and how comfortable you are with technology.
Think of it this way: a Formula 1 car is an incredible piece of engineering, but it's the wrong tool for a daily commute. Your goal is to find the right vehicle for your trading journey, one that enhances your performance instead of just adding a bunch of confusing bells and whistles.
The first step is a bit of honest self-assessment. Before you even glance at a product page, you need to get crystal clear on who you are as a trader. This clarity will become your personal checklist, helping you cut through the marketing hype and zero in on what actually matters.
Define Your Trading Identity
Your trading style is the single most important factor, period. Are you a day trader glued to your screen, needing lightning-fast, real-time data to scalp tiny price moves? Or are you a swing trader who’s more interested in spotting patterns that unfold over several days or weeks? Maybe you're a long-term investor who only needs to screen for fundamental data once a quarter.
Ask yourself these core questions:
- How often do I trade? If you're making multiple trades a day, real-time data is non-negotiable. Less active styles can often get by with end-of-day information.
- What markets do I trade? A scanner built for US stocks won't do you any good if you’re focused on forex, crypto, or international equities. Make sure your tool covers your playground.
- Am I a tech geek or a minimalist? Be honest. Do you enjoy building complex custom formulas, or would you rather have a simple interface with pre-built scans ready to go? Paying for advanced features you’ll never touch is just throwing money away.
Your answers will immediately start to narrow down the massive field of options and point you in the right direction.
The goal isn't to find a scanner with the most features; it's to find one with the right features. A day trader paying for deep fundamental data is wasting money, just as an investor doesn't need to pay a premium for millisecond data feeds.
Free Versus Paid Platforms
One of the first forks in the road is deciding between a free tool and a paid subscription. The old saying "you get what you pay for" is especially true here. While some excellent free options exist, it's critical to understand their built-in limitations.
Free Scanners:
- Pros: They cost nothing! Great for absolute beginners or for getting a feel for scanning, and they're often integrated right into your brokerage account.
- Cons: They almost always use delayed data (think 15+ minutes old), offer very basic filtering options, and lack real-time alerts.
Paid Scanners:
- Pros: This is where you get real-time, streaming data. You also get deep customization with tons of technical and fundamental filters, plus robust alert systems that watch the market for you.
- Cons: The cost can range from $30 to over $200 per month, and the advanced features can sometimes come with a bit of a learning curve.
For any serious, active trader, a paid scanner is simply a cost of doing business. That investment is what buys you the speed and precision needed to compete effectively. For a closer look at specific platforms, check out our detailed breakdown of the best stock scanners for 2025. This guide compares the top players to help you find a perfect match for your strategy.
Web-Based Versus Desktop Software
Finally, think about where and how you trade. Scanners generally come in two flavors: web-based apps you access in your browser, and desktop software you install directly on your computer.
Web-based scanners offer incredible flexibility. You can log in from any device, anywhere you have an internet connection. The trade-off is that they can sometimes be a bit slower or less powerful than their desktop cousins.
Desktop software, like our own ChartsWatcher platform, often delivers superior performance. Because it runs using your machine's own resources, you get more stable data feeds and deeper customization. This is a crucial edge for traders who run multiple, complex scans at once and can't afford even a hint of lag. By weighing these factors, you can confidently pick a scanner that becomes a true asset in your trading toolkit.
Common Mistakes Traders Make with Scanners
A great stock scanner is a powerful ally, but in the wrong hands, it can also become a weapon of mass portfolio destruction. Too many traders, especially when they're just starting out, stumble into the same old traps that turn this incredible tool from an edge into a liability.
The best way to think of your scanner is as an expert co-pilot, not an autopilot. It can spot potential opportunities on the horizon, but you're still the one flying the plane. Relying on it to make your decisions for you is a one-way ticket to trouble. Let's get real about these common—and costly—errors.
Blindly Trusting Every Alert
This is the big one. The most frequent mistake is treating every single alert from a scanner as a direct command to buy or sell. It’s not. A scanner alert is just a flare gun, signaling that a stock has met the criteria you set. It’s the start of your analysis, not the end of it.
Imagine your scanner flashes an alert: a stock just popped 5% on unusually high volume. The novice trader gets a jolt of FOMO and immediately jumps in, terrified of missing the move.
The disciplined trader, on the other hand, sees that same alert and starts asking questions:
- Why is it moving? Is there a real catalyst like an earnings beat or fresh news? Or is it just a random, unexplained spike?
- What’s the bigger picture? Is the S&P 500 green or red? Fighting the market's overall trend is a low-percentage game.
- Where are the roadblocks? Is the stock running straight into a major resistance level where sellers have shown up before?
Without that second layer of due diligence, you’re not trading; you’re just gambling on a flashing light. The scanner finds the smoke. It's your job to figure out if there's a real fire.
A scanner automates the "what," flagging stocks that fit your rules. Your job is to investigate the "why" and the "what's next" before risking a single cent. Blindly following alerts means you're giving up your greatest edge: your own brain.
Creating Overly Restrictive Scans
On the flip side, we have the perfectionist trader. This person tries to build a "holy grail" scan so specific and restrictive that it never actually finds anything. They pile on dozens of filters, hoping to create a magic formula that only spits out guaranteed winners.
This quest for the perfect scan usually leads to one thing: paralysis and missed opportunities. The market is messy and imperfect. No single set of rules will work forever. If your scanner is dead silent for days on end, it’s a big red flag that your criteria are probably too tight.
For example, a trader might build a scan for stocks up exactly 5%, with a P/E ratio between 15 and 15.5, and volume precisely 2.5x its average. They’d completely miss a fantastic setup on a stock that's up 6%, has a P/E of 16, and is trading on 3x the average volume—all because it fell just outside their rigid little box.
The goal is to build scans that are focused, not suffocating. You want to narrow the massive universe of stocks down to a manageable list of potentials, not get an empty screen.
Ignoring The Overall Market Trend
A rising tide lifts all boats, and a falling tide can sink even the strongest ship. This might be the most common and costly mistake of all: using a scanner in a total vacuum, completely ignoring what the S&P 500 or Nasdaq are doing.
If the entire market is in a steep nosedive, with fear gripping every investor, even the most picture-perfect bullish setup is fighting an uphill battle. Forcing long trades when the market is weak is like trying to swim up a waterfall. It’s exhausting and you’re probably not going to make it.
Before you even glance at your scan results, check the market’s pulse. Smart traders adapt their approach based on the environment:
- Strong Market: They're confidently running scans for bullish breakouts and high-momentum plays.
- Weak Market: They either switch to bearish scans (for shorting), tighten their stop-losses on any trade they take, or simply sit on their hands and preserve their capital.
Let the market tell you what kinds of plays have the wind at their back. Aligning your scans with the primary market trend is one of the fastest ways to instantly stack the odds in your favor.
Frequently Asked Questions
Even after getting a good grip on what a stock scanner does, it's totally normal to have a few more questions rattling around. When you're adding a powerful new tool to your trading arsenal, you want to dig into the details and make sure there are no blind spots.
To help you get there, we've rounded up some of the most common questions traders have about stock scanners. Let's clear up any lingering confusion so you can start using these tools with confidence.
Can a Stock Market Scanner Guarantee Profits?
No, absolutely not. This is a critical point to understand: a stock scanner is an analytical tool, not a crystal ball that prints money. Its entire job is to surface potential trading opportunities based on the specific rules you set, saving you from the soul-crushing task of manual research.
Think of it like an expert research assistant. It can sift through a mountain of market data in seconds and hand you a short, curated list of interesting stocks. But what happens next—the actual outcome of any trade—is completely on you. It depends on your own analysis, your trading strategy, how you manage risk, and what the market decides to do that day.
A stock scanner doesn't find winning trades; it finds potential setups. Your skill as a trader—your ability to analyze those setups, manage your risk, and execute your plan—is what ultimately determines profit or loss.
The scanner is just the starting line. It automates the "finding" so you can pour your energy into the "thinking" and "doing."
What Is the Difference Between a Scanner and a Screener?
While people often use "scanner" and "screener" interchangeably, there's a crucial difference that really matters to active traders: the speed and frequency of the data.
-
Scanner: A true stock market scanner is built for speed, operating on real-time, streaming market data. It’s designed to spot opportunities as they unfold, second by second. This is non-negotiable for day traders and scalpers who need to react instantly to sudden spikes in price and volume.
-
Screener: A stock screener, on the other hand, typically works with data that's updated much less often—maybe every few minutes, at the end of the day, or even quarterly. This makes screeners a perfect fit for swing traders and long-term investors whose decisions hinge on daily chart patterns or fundamental data like P/E ratios and earnings growth.
The bottom line is that scanners are for dynamic, in-the-moment trading. Screeners are for more periodic, strategic analysis. The right tool for you comes down to your trading style.
How Much Does a Good Stock Scanner Cost?
The price tag on a stock scanner can swing wildly, from completely free to over $200 per month. The amount you should expect to pay is tied directly to the firepower you need for your particular trading strategy.
Here’s a rough breakdown of what you get at different price points:
- Free Scanners: These are typically offered by online brokers or financial websites. They're a fantastic way for beginners or long-term investors to get started. The catch? They almost always have delayed data (15+ minutes) and very basic filters, making them a no-go for active trading.
- Mid-Tier Scanners ($30-$100 per month): This is the sweet spot for most serious, active traders. In this price range, you get the essentials: real-time data, a robust set of technical filters, solid charting integration, and customizable alerts. These tools provide the power needed for day trading and swing trading.
- Professional-Grade Scanners ($150+ per month): These platforms are geared toward professional and institutional traders. They include everything from the mid-tier plus highly advanced features like backtesting engines, algorithmic strategy builders, API access, and sometimes even AI-driven trade ideas.
It all boils down to your trading frequency. A long-term investor can thrive with a free screener, but a dedicated day trader needs to see a paid, real-time scanner as a non-negotiable cost of doing business.
Ready to stop searching and start analyzing? ChartsWatcher provides the real-time data, advanced filtering, and seamless charting integration you need to build and execute your trading strategy with precision.
