Risk Management Dashboard Examples: Top Insights
Navigating Risk in the Modern Landscape
Effective risk management is crucial for success in today's markets. This article provides a concise overview of eight leading risk management dashboard tools to help you identify, assess, and mitigate potential threats. These tools consolidate key risk indicators (KRIs) for proactive risk management. Learn the features, pros, and cons of each platform, including Microsoft Power BI, Tableau, IBM OpenPages, LogicManager, MetricStream, SAP, Resolver, and Qlik, to select the best solution for your needs.
1. Microsoft Power BI Risk Management Dashboard
Microsoft Power BI offers a robust and versatile solution for building customized risk management dashboards. Its strength lies in transforming raw data from various sources into actionable insights through interactive visualizations. This makes it particularly appealing to professional traders, stock market analysts, financial institutions, independent investors, stock trading educators, and anyone utilizing stock scanners or screeners, especially in the fast-paced world of day trading. Power BI empowers these users to monitor key risk indicators (KRIs) in real-time and make informed decisions to protect their capital.
Imagine a day trader needing to keep a close eye on multiple positions across different asset classes. With Power BI, they can create a dashboard displaying real-time profit/loss, volatility metrics, margin levels, and exposure limits. Customizable alerts can be set to trigger when specific thresholds are breached, enabling swift action to mitigate potential losses. Similarly, a financial institution can utilize Power BI to monitor credit risk, market risk, and operational risk across their portfolio, drilling down into specific areas of concern with interactive visualizations.
Power BI’s flexibility extends to various risk categories, including operational, financial, strategic, and compliance risks. For instance, a stock market analyst can visualize market sentiment, identify emerging trends, and assess the potential impact on specific investments. Stock trading educators can leverage Power BI to demonstrate risk management principles to their students using real-world data and interactive simulations.
Key Features & Benefits:
- Real-time Risk Metric Tracking: Monitor critical metrics like price fluctuations, volatility, and market sentiment as they happen, with customizable thresholds and alerts to notify you of potential issues.
- Interactive Data Visualization: Drill down into specific data points, explore trends, and identify patterns with interactive charts, graphs, and tables. This is invaluable for understanding the complex interplay of market forces.
- Risk Heat Maps: Visualize risk probability and impact assessments with heat maps, offering an at-a-glance overview of your risk profile. This allows for quick identification of high-risk areas requiring immediate attention.
- Natural Language Query: Analyze risk data using natural language queries, simplifying the process of extracting insights without needing complex coding skills. Ask questions like "What is my current portfolio risk exposure?" or "Which sectors are showing the highest volatility?" and get immediate answers.
- Integration with Microsoft Ecosystem: Seamless integration with Excel, SQL databases, SharePoint, and other Microsoft products simplifies data import and management. This is particularly beneficial for users already working within the Microsoft environment.
Pros:
- Strong integration with the Microsoft ecosystem and various data sources.
- User-friendly interface with drag-and-drop dashboard creation.
- Powerful data modeling capabilities.
- Cost-effective compared to specialized risk management solutions.
Cons:
- Steep learning curve for advanced features.
- Less specialized than dedicated risk management tools.
- Performance can degrade with very large datasets.
- Some advanced features require Power BI Premium.
Pricing and Technical Requirements:
Power BI offers different licensing options, including a free desktop version and various Pro and Premium subscriptions with varying features and capacities. Technical requirements depend on the chosen licensing and deployment options.
Implementation/Setup Tips:
Start by identifying your key risk indicators and data sources. Utilize Power BI's data connectors to integrate your data and begin creating visualizations. Leverage the extensive online resources and community forums for support and guidance.
Comparison with Similar Tools:
While specialized risk management tools offer more advanced features tailored to specific industries or risk types, Power BI's flexibility and affordability make it a strong contender, particularly for organizations already invested in the Microsoft ecosystem. Its ability to connect to various data sources and create customized visualizations empowers users to build risk dashboards tailored to their specific needs.
Power BI deserves its place in this list due to its versatility, affordability, and powerful visualization capabilities, making it a valuable tool for anyone looking to gain a deeper understanding of their risk exposure and improve their decision-making process. Specifically for the target audience, the ability to track real-time data and set custom alerts is critical for managing risk in the volatile world of trading. The integration with existing Microsoft products streamlines workflows, while the interactive visualizations empower users to quickly identify and address potential threats to their capital. Visit the official website for more details: https://powerbi.microsoft.com/en-us/
2. Tableau Risk Management Dashboard
Tableau stands out as a leading choice for building sophisticated risk management dashboards, particularly for organizations dealing with complex data sets and requiring advanced visualization capabilities. Its strength lies in transforming raw data into interactive and insightful visuals, empowering stakeholders across all levels to understand and address potential risks effectively. This makes it a particularly valuable tool for professional traders, stock market analysts, financial institutions, and independent investors who need to quickly grasp complex market risks and opportunities. From monitoring enterprise risk exposure to tracking mitigation efforts and visualizing trends over time, Tableau equips risk professionals with the tools they need to make informed decisions.
For example, a financial institution can use Tableau to create a dashboard visualizing market risk exposure across different asset classes, geographic regions, and time horizons. Stock market analysts can leverage the platform to model various risk scenarios and conduct what-if analyses, testing the potential impact of different market events on their portfolios. Day traders can leverage real-time data connections to monitor risk metrics throughout the trading day, allowing for agile responses to changing market conditions. Learn more about Tableau Risk Management Dashboard This granular level of insight is crucial for effective risk management in today's dynamic markets.
Tableau's key features for risk management include advanced data visualization capabilities for complex risk metrics, risk scenario modeling and what-if analysis tools, geographical risk mapping and visualization, mobile-optimized dashboards for on-the-go risk monitoring, and robust data connectivity to various risk data sources. This last feature is especially beneficial for integrating disparate data sets from various market feeds, internal systems, and third-party providers. Tableau's capacity for handling large datasets efficiently makes it especially suitable for financial institutions and stock market analysts working with high-volume, high-frequency data.
While Tableau offers powerful capabilities, it's essential to consider its pros and cons. On the plus side, it offers superior visualization capabilities for complex risk data, excellent data exploration and drill-down functionality, a strong community and readily available template resources, and the ability to handle large datasets efficiently. However, it comes at a higher price point than some competitors, requiring specialized skills for building complex dashboards. While it offers a mobile experience, it's not as robust as the desktop version, and setup and maintenance can be resource-intensive. While specific pricing details are available upon request from Tableau directly, it's generally understood that the platform represents a more significant investment than some other business intelligence tools. Technical requirements vary depending on the chosen deployment model (cloud or on-premise) and the complexity of the dashboards, typically necessitating sufficient server resources and skilled personnel for implementation and ongoing management.
Despite these considerations, Tableau's strengths in visualization, data exploration, and handling large datasets make it a compelling choice for financial professionals. Its capacity to provide both high-level overviews and detailed analytics allows for comprehensive risk assessment and informed decision-making. You can explore Tableau's offerings further on their official website: https://www.tableau.com/.
3. IBM OpenPages with Watson
IBM OpenPages with Watson is a comprehensive, AI-powered governance, risk, and compliance (GRC) platform designed for large enterprises seeking a holistic view of their risk landscape. It integrates various risk domains, including operational, policy, financial, IT, and compliance, providing a centralized hub for managing all aspects of enterprise risk. This makes it particularly relevant for financial institutions, professional traders, and stock market analysts dealing with complex regulatory requirements and market volatilities. OpenPages with Watson goes beyond simple risk tracking and reporting by leveraging AI to offer predictive risk intelligence, allowing organizations to anticipate and proactively mitigate emerging risks. This predictive capability can be incredibly valuable for investors, allowing them to anticipate market shifts and adjust their portfolios accordingly.
This solution is particularly valuable in the financial sector due to its focus on regulatory compliance monitoring and reporting. For financial institutions, adhering to regulations like KYC, AML, and GDPR is paramount. OpenPages with Watson assists in streamlining compliance processes, automating workflows, and generating reports, thereby reducing the risk of penalties and reputational damage. For professional traders and analysts, the platform offers powerful risk analytics that can be used to assess portfolio risk, model market scenarios, and stress-test investment strategies. This granular level of control allows for more informed decision-making and potentially better risk-adjusted returns.
Key Features & Benefits:
- AI-powered Risk Analytics & Predictive Risk Intelligence: Watson's AI capabilities analyze vast amounts of data to identify patterns and predict potential risks, providing valuable foresight for investment decisions and market analysis.
- Unified GRC Platform: Consolidates all GRC activities onto a single platform, streamlining workflows and improving overall risk management efficiency. This is especially beneficial for large financial institutions with diverse operations.
- Customizable Risk Dashboards: Allows different stakeholders (e.g., executives, risk managers, traders) to access tailored risk information relevant to their roles. Stock market analysts can customize dashboards to track specific market indicators and risk factors relevant to their analysis.
- Automated Risk Assessment Workflows: Automates repetitive tasks, freeing up resources and reducing the likelihood of human error.
- Regulatory Compliance Monitoring and Reporting: Simplifies compliance processes and ensures adherence to relevant regulations.
Pros:
- Comprehensive enterprise risk management capabilities.
- Powerful AI and machine learning integration.
- Robust regulatory compliance functionality.
- Scalable for large enterprises with complex risk landscapes.
Cons:
- Significant investment required (cost and implementation). Pricing is not publicly available and requires contacting IBM directly. This can be a barrier for smaller trading firms or individual investors.
- Complex system requiring dedicated resources to manage.
- Better suited for large enterprises than small businesses.
- Steeper learning curve than visualization-only solutions.
Implementation/Setup Tips:
Implementing IBM OpenPages with Watson is a complex undertaking and requires careful planning. Engaging IBM's professional services or certified partners for implementation is highly recommended. Prior to implementation, clearly define your risk management objectives and tailor the solution to your specific needs. Thorough training for users is crucial for maximizing the platform's potential.
Comparison with Similar Tools:
While other GRC platforms exist (e.g., MetricStream, ServiceNow GRC), IBM OpenPages with Watson distinguishes itself through its advanced AI capabilities and its focus on predictive risk intelligence. However, these advanced features come at a premium cost. For smaller organizations with simpler needs, less complex and more affordable solutions might be more suitable.
IBM OpenPages with Watson earns its place on this list because of its comprehensive approach to enterprise risk management, leveraging the power of AI for predictive insights. While it represents a significant investment, its robust features and scalability make it a valuable tool for large financial institutions, professional traders, and analysts navigating complex risk landscapes. However, smaller investors or those with limited technical resources may find its complexity and cost prohibitive.
4. LogicManager Risk Management Dashboard
LogicManager offers a purpose-built enterprise risk management (ERM) platform designed to streamline and enhance risk management processes. It stands out for its taxonomy-based approach, allowing organizations to establish a standardized language and methodology for identifying, assessing, and mitigating risks across different departments and business units. This consistency is crucial for accurate risk reporting and informed decision-making, particularly for larger organizations or those operating in highly regulated industries. LogicManager is a strong contender for organizations seeking a dedicated ERM solution rather than adapting general-purpose business intelligence tools.
This platform caters to the needs of risk professionals by providing real-time visibility into key risk indicators. It empowers organizations to move from reactive to proactive risk management by enabling them to identify emerging threats, monitor control effectiveness, and track risk appetite and tolerance levels. This proactive approach can help organizations anticipate potential problems, optimize resource allocation, and improve overall business resilience. For financial institutions, traders, and analysts, this translates to better-informed investment decisions, more effective compliance programs, and enhanced protection against market volatility and operational disruptions.
LogicManager offers features specifically tailored for advanced risk analysis. The risk taxonomy builder allows for customized risk categorization, enabling organizations to align their risk management framework with their specific industry, regulatory requirements, and internal structures. Root cause analysis tools and visualizations help pinpoint the underlying drivers of risk events, facilitating more effective mitigation strategies. Automated workflows for risk assessment and control testing further streamline the risk management process, freeing up valuable time and resources. Executive-level reporting with drill-down capabilities provides stakeholders with clear and concise insights into the organization's risk profile, fostering better communication and transparency.
Features:
- Risk taxonomy builder for standardized risk categorization
- Root cause analysis tools and visualizations
- Automated risk assessment and control testing workflows
- Risk appetite and tolerance monitoring
- Executive-level risk reporting with drill-down capabilities
Pros:
- Purpose-built for enterprise risk management needs
- Intuitive interface requiring minimal training
- Strong advisory support and implementation services
- Pre-built templates for common risk management frameworks (e.g., COSO, ISO 31000)
Cons:
- Less flexible than general-purpose BI tools for custom visualizations
- Integration with legacy systems can be challenging
- Higher price point than general data visualization tools
- Some advanced features require premium tiers
Implementation Tips:
- Leverage LogicManager's advisory services during implementation for optimal configuration.
- Utilize pre-built templates as a starting point and customize them to your organization's specific needs.
- Clearly define roles and responsibilities within the platform to ensure accountability and data accuracy.
- Prioritize integrations with key data sources to maximize the value of real-time risk monitoring.
Pricing and Technical Requirements:
While specific pricing information isn't publicly available, LogicManager typically utilizes a subscription-based model, with pricing tiered based on the number of users, features, and required support levels. Contact LogicManager directly for a personalized quote. Technical requirements are also best obtained directly from the vendor as they can vary based on deployment options (cloud vs. on-premise).
Comparison with Similar Tools:
Compared to general-purpose BI tools like Tableau or Power BI, LogicManager sacrifices some visualization flexibility but offers a more structured and comprehensive approach specifically designed for ERM. Tools like MetricStream and RSA Archer also offer robust ERM capabilities, but LogicManager differentiates itself with its strong focus on taxonomy-based risk management and its intuitive user interface.
Website: https://www.logicmanager.com/
LogicManager deserves its place on this list due to its comprehensive features, dedicated ERM focus, and ability to facilitate proactive risk management. It is a valuable tool for organizations seeking to mature their risk management practices and gain a deeper understanding of their risk landscape, making it particularly relevant for financial professionals navigating complex and volatile markets.
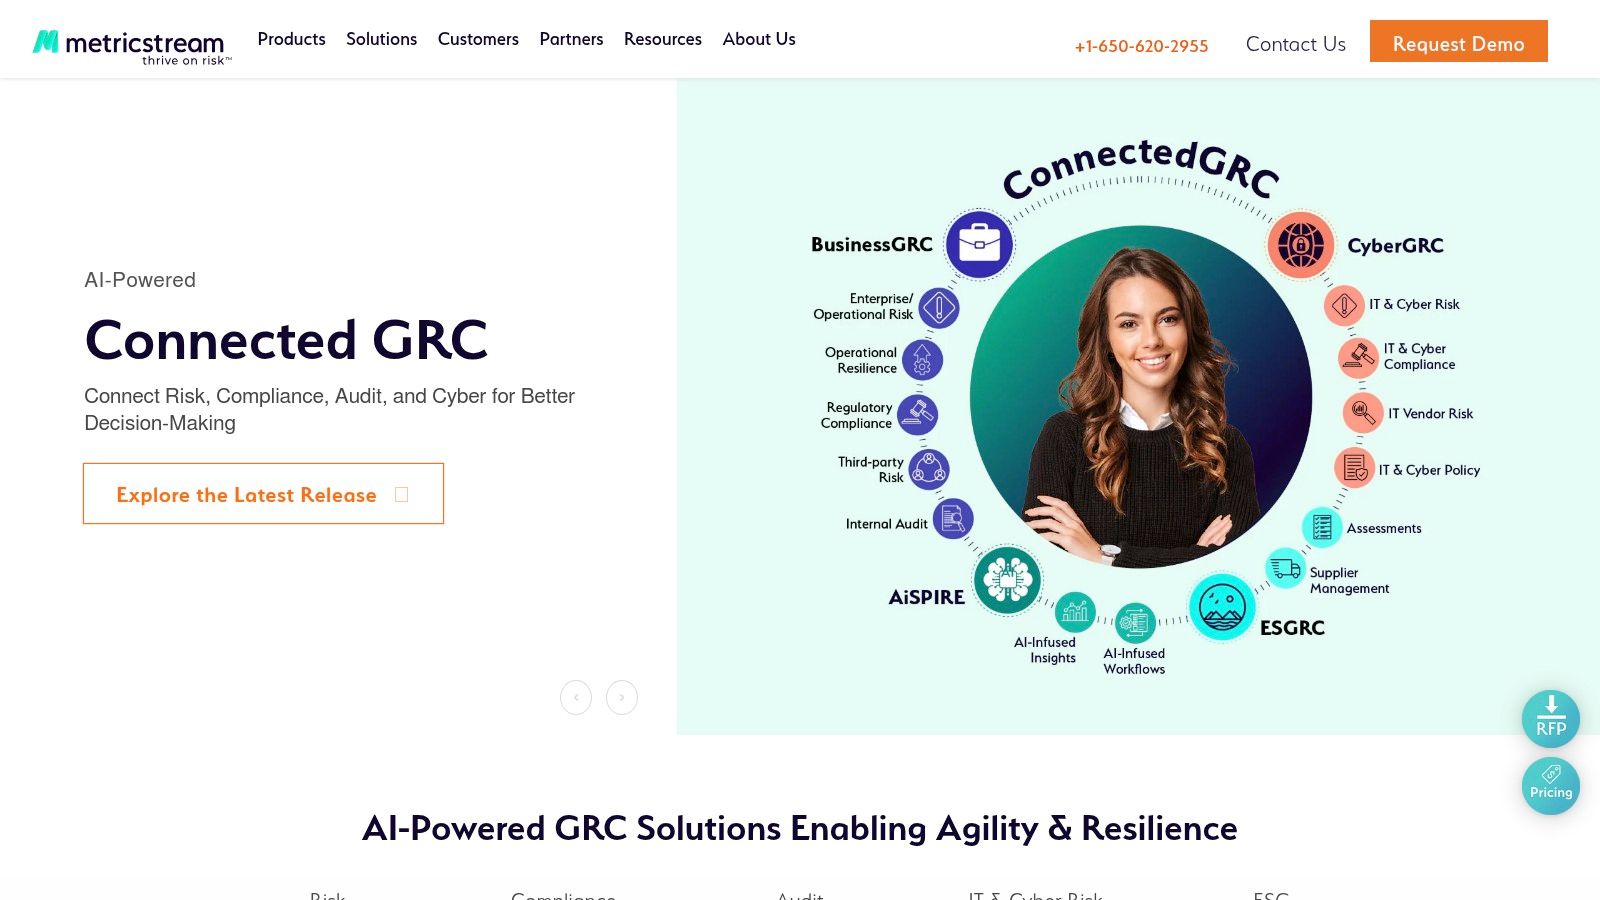
5. MetricStream GRC Dashboards
MetricStream offers a comprehensive Governance, Risk, and Compliance (GRC) platform with specialized dashboards designed to provide a unified view of risk across an enterprise. This makes it a powerful tool for organizations, particularly those in heavily regulated industries, looking to streamline their risk management processes and gain a more holistic understanding of their risk profile. While not specifically geared towards day traders or stock market analysis in the same way a real-time market data platform would be, MetricStream can be invaluable for financial institutions managing operational, regulatory, and strategic risks. For example, it can be used to monitor regulatory compliance related to trading activities, manage risks associated with specific investment portfolios, or track and mitigate operational risks within a trading desk.
This platform enables organizations to monitor key risk indicators (KRIs), track their compliance status against various regulations, and effectively manage risk mitigation activities – all through interactive and customizable dashboards. This centralized approach to risk management allows for better decision-making and improved responsiveness to emerging threats and opportunities. MetricStream’s strength lies in its robust regulatory compliance management capabilities and its ability to integrate risk data from various sources across the organization, delivering comprehensive risk intelligence.
MetricStream provides role-based dashboards tailored to different stakeholders. This means a Chief Risk Officer will see a different view than a Compliance Manager or an Internal Auditor. These dashboards offer real-time risk and compliance monitoring, enabling swift responses to critical issues. The platform also facilitates issue management and remediation tracking, ensuring that identified risks are addressed promptly and efficiently. Furthermore, it integrates regulatory change management, allowing organizations to stay ahead of evolving compliance requirements. Configurable risk scoring and heat maps provide a visual representation of risk levels, facilitating prioritization and resource allocation.
Features:
- Role-based dashboards
- Real-time risk and compliance monitoring
- Issue management and remediation tracking
- Regulatory change management integration
- Configurable risk scoring and heat maps
Pros:
- Comprehensive GRC functionality in a single platform
- Strong regulatory compliance capabilities
- Extensive industry-specific content and frameworks
- Scalable for complex enterprise environments
Cons:
- Implementation can require significant resources and expertise
- More complex than point solutions, requiring dedicated training and administration
- Higher total cost of ownership compared to more niche tools
- User interface can be less intuitive than some newer, more modern platforms
Pricing and Technical Requirements:
Pricing for MetricStream is typically quote-based and depends on the specific modules, features, and scale of deployment. Technical requirements vary depending on the chosen deployment model (cloud-based or on-premise). Contact MetricStream directly for detailed pricing and technical specifications.
Comparison with Similar Tools:
MetricStream competes with other GRC platforms like RSA Archer, ServiceNow GRC, and LogicManager. While each platform has its strengths, MetricStream stands out with its robust regulatory compliance capabilities and comprehensive GRC functionality. However, organizations should carefully evaluate their specific needs and budget when selecting a platform.
Implementation Tips:
- Clearly define your GRC requirements and objectives before implementation.
- Ensure adequate resources and expertise are allocated to the project.
- Leverage MetricStream's industry-specific content and frameworks to accelerate implementation.
- Provide comprehensive training to users to maximize platform adoption and effectiveness.
Website: https://www.metricstream.com/
MetricStream deserves a place on this list due to its comprehensive and robust approach to GRC management. Its specialized dashboards provide a powerful tool for organizations seeking to gain a holistic view of their risk landscape, streamline compliance processes, and make more informed, risk-aware decisions. While the investment can be significant, the potential benefits in terms of improved risk management, enhanced compliance, and reduced operational losses make it a worthwhile consideration for organizations facing complex regulatory environments and demanding risk management challenges.
6. SAP Risk Management Dashboard
For organizations deeply embedded within the SAP ecosystem, the SAP Risk Management Dashboard offers a robust and integrated solution for managing enterprise risks. This platform allows for comprehensive risk identification, assessment, and response, all while ensuring compliance with relevant industry regulations and standards. Its tight integration with existing SAP financial, operational, and IT processes makes it particularly attractive for large enterprises already leveraging SAP solutions.
Practical Applications and Use Cases:
- Financial Risk Management: Analyze and mitigate financial risks related to market volatility, credit exposure, liquidity, and foreign exchange fluctuations. The integration with SAP ERP and financial systems allows for real-time risk assessment based on live transactional data.
- Operational Risk Management: Identify and manage risks related to supply chain disruptions, production failures, cybersecurity breaches, and fraud. Workflow automation enables efficient risk response and mitigation efforts.
- Compliance Management: Monitor and maintain compliance with regulatory requirements such as SOX, GDPR, and industry-specific standards. The platform provides audit management and compliance tracking capabilities to streamline compliance processes.
- Risk-Adjusted Planning and Forecasting: Integrate risk considerations into financial planning and forecasting processes for more realistic and informed decision-making.
Features and Benefits:
- Seamless Integration: Direct integration with SAP ERP and other financial systems provides a unified view of risk across the organization, eliminating data silos.
- Real-Time Visibility: Dashboards offer real-time insights into key risk indicators (KRIs), allowing for proactive risk management.
- Continuous Monitoring: Automated monitoring of risk exposures and control effectiveness helps organizations stay ahead of emerging threats.
- Workflow Automation: Streamlined workflows for risk assessment, mitigation, and reporting improve efficiency and reduce manual effort.
- Audit Trail and Documentation: Comprehensive audit trails and documentation support regulatory compliance and internal control requirements.
Pros:
- Deep SAP Integration: Leverages existing SAP investments and data for a holistic view of enterprise risk.
- Enterprise-Grade Scalability: Designed to handle large volumes of data and complex risk scenarios.
- Strong Security and Access Controls: Ensures data integrity and confidentiality.
Cons:
- SAP Dependency: Requires significant SAP expertise for implementation and maintenance, making it less suitable for organizations outside the SAP ecosystem.
- Implementation Investment: Implementation can be complex and costly, requiring significant upfront investment.
- User Interface: While functional, the interface may not be as intuitive as some modern business intelligence (BI) tools.
Pricing and Technical Requirements:
Pricing for SAP Risk Management is typically based on the number of users and the specific modules implemented. Detailed pricing information requires contacting SAP directly. Technical requirements are dependent on the specific SAP landscape and require consultation with SAP specialists.
Comparison with Similar Tools:
While other Governance, Risk, and Compliance (GRC) platforms exist (e.g., MetricStream, RSA Archer), SAP Risk Management's strength lies in its native integration within the SAP environment. Organizations already heavily invested in SAP will likely find the seamless data flow and process integration to be a significant advantage.
Implementation/Setup Tips:
- Engage SAP Experts: Leverage experienced SAP consultants for implementation and configuration to ensure a successful rollout.
- Define Clear Objectives: Establish clear goals and objectives for risk management before implementing the platform.
- Prioritize Key Risks: Focus initial implementation efforts on the most critical risks to the organization.
- Train Users Thoroughly: Provide comprehensive training to users on the platform's functionalities and reporting capabilities.
Why it Deserves its Place on the List:
The SAP Risk Management Dashboard earns its place on this list due to its comprehensive risk management capabilities specifically tailored for SAP-centric organizations. For businesses deeply integrated with SAP systems, this platform provides a powerful and integrated solution for managing enterprise risks, driving compliance, and enabling informed decision-making. While the investment and SAP dependency may be a barrier for some, the benefits of deep integration and real-time visibility make it a compelling choice for large enterprises operating within the SAP ecosystem.
7. Resolver Risk Management Dashboard
Resolver offers a comprehensive risk management platform equipped with intuitive dashboards designed for corporate security, risk management, and compliance needs. It's particularly beneficial for organizations looking to connect risks across different departments, allowing them to see the relationships between incidents, overall risk profiles, and compliance issues. This interconnected approach provides a more holistic view of risk, facilitating more informed decision-making. Resolver aims to empower risk professionals with the insights needed to proactively mitigate potential threats and maintain organizational resilience.
This platform excels at providing a clear visual representation of risk status, emerging trends, and the effectiveness of existing mitigation strategies. This allows for data-driven decisions, rather than relying on gut feelings or outdated information. By centralizing risk-related data and presenting it in an accessible format, Resolver streamlines the risk management process and enhances communication across teams.

Resolver's key features include incident management and investigation capabilities, a risk assessment wizard with standardized methodologies, compliance management with regulatory mapping, vulnerability and threat monitoring, and enterprise risk intelligence with trend analysis. For example, the incident management functionality allows organizations to log, investigate, and track incidents, identifying root causes and implementing corrective actions. The risk assessment wizard simplifies the often complex process of assessing risks by guiding users through standardized methodologies.
While Resolver's focus leans more towards operational risk (e.g., cybersecurity incidents, regulatory compliance) than financial risk (e.g., market volatility, credit risk), its robust incident management and compliance features can be beneficial for financial institutions in managing operational risks related to cybersecurity threats, fraud, and regulatory breaches. For example, a financial institution can use Resolver to track and manage incidents of phishing attacks, ensuring appropriate responses are initiated and preventative measures are put in place.
Pros:
- User-friendly interface: Minimal training is required to navigate the platform and utilize its features.
- Strong incident management capabilities: Comprehensive tools for logging, investigating, and tracking incidents.
- Balanced functionality and ease of use: Provides a robust set of features without overwhelming users with complexity.
- Effective implementation methodology: Resolver offers a structured approach to implementation, ensuring a smooth transition and quick time-to-value.
Cons:
- Less customization: Offers fewer customization options compared to some competitors, potentially limiting flexibility for organizations with highly specific needs.
- Operational risk focus: More geared towards operational risk management than financial risk, making it less suitable for organizations primarily concerned with market or credit risk.
- Limited advanced analytics: Lacks the sophisticated AI-powered analytics capabilities found in some competing solutions.
- Smaller integration ecosystem: Compared to larger vendors, Resolver has a less extensive integration ecosystem, which might limit its seamless integration with existing systems.
Pricing and Technical Requirements: Resolver's pricing is typically subscription-based and varies depending on the modules selected and the size of the organization. Contact Resolver directly for detailed pricing information. Technical requirements are not publicly listed and are best obtained through direct consultation with Resolver.
Comparison with Similar Tools: While similar to tools like LogicManager and MetricStream in offering integrated risk management, Resolver differentiates itself with a strong focus on incident management and a more user-friendly interface. LogicManager is often preferred for its advanced reporting and analytics capabilities, while MetricStream is known for its comprehensive GRC (Governance, Risk, and Compliance) functionalities.
Implementation Tips: For a successful implementation, it's recommended to clearly define your organization's risk management objectives and identify key stakeholders. Leverage Resolver's implementation methodology and consider engaging their professional services team for assistance. Start with a pilot project focused on a specific risk area before rolling out the platform enterprise-wide.
Website: https://www.resolver.com/
Resolver deserves its place on this list because it provides a practical and accessible solution for organizations seeking to strengthen their risk management posture. Its user-friendly interface and focus on connecting risks across departments make it a valuable tool for improving visibility and enabling more proactive risk management. While it may not be the ideal solution for organizations requiring highly specialized financial risk management or advanced analytics, its robust incident management and compliance features make it a strong contender for organizations prioritizing operational risk and seeking a balanced approach between functionality and ease of use.
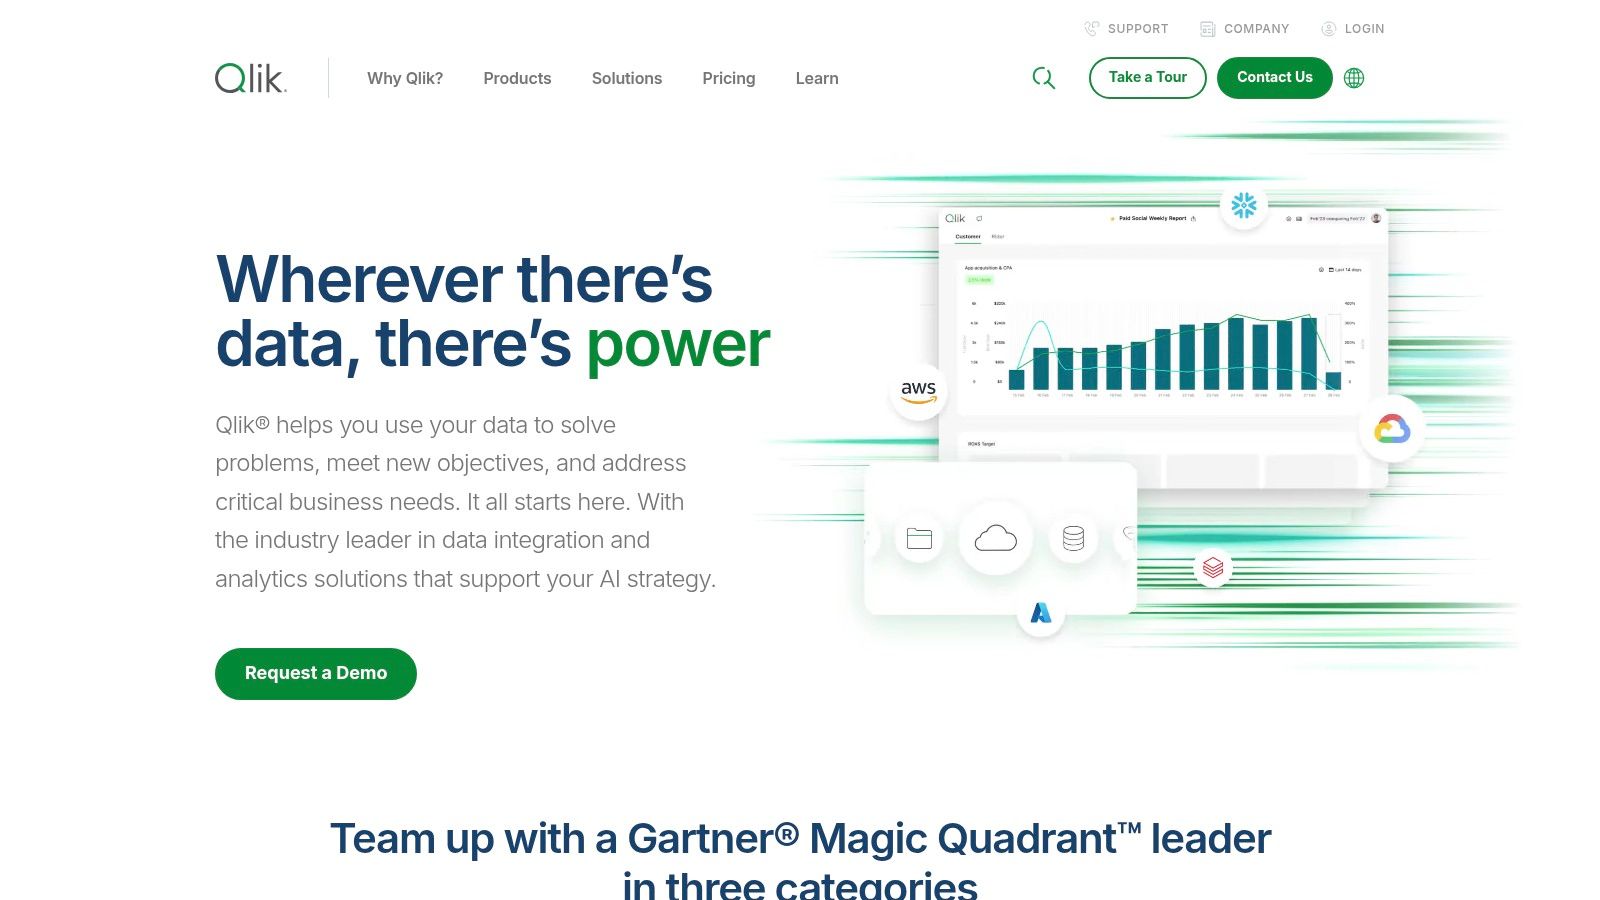
8. Qlik Risk Management Dashboard
Qlik offers a robust platform for building customized risk management dashboards, leveraging its powerful associative analytics engine to uncover hidden relationships within your data. This makes it particularly well-suited for financial professionals who need to delve deep into market trends, portfolio risks, and potential investment pitfalls. Instead of relying on pre-defined relationships, Qlik allows you to explore all possible connections in your data, revealing insights that traditional analysis might miss. This can be invaluable for identifying emerging risks and opportunities in complex financial markets. For example, you could analyze market volatility against specific asset performance to identify hidden correlations and anticipate potential market downturns. Or, you could assess the impact of macroeconomic factors on your portfolio, allowing for proactive adjustments to mitigate potential losses.
Qlik's strength lies in its associative engine, which enables a dynamic exploration of risk data. Imagine being able to instantly see how a change in interest rates correlates with currency fluctuations and its subsequent impact on your international investments. This interactive analysis empowers users, from individual investors to large financial institutions, to identify patterns, outliers, and trends across diverse risk categories. Furthermore, Qlik's real-time data processing capabilities, powered by in-memory technology, provide up-to-the-minute insights, crucial for navigating today's fast-paced markets. This allows day traders and stock scanners to react quickly to market fluctuations, optimizing their trading strategies in real-time.
Qlik’s self-service dashboard creation features, combined with guided analytics, enable users to build tailored dashboards without extensive coding knowledge. While aimed at empowering business users, the platform's true potential often requires leveraging its advanced scripting capabilities. This can be a double-edged sword. While it allows for highly customized risk assessments, it also contributes to a steeper learning curve compared to more user-friendly tools like Tableau. The visualizations, while functional, may not be as aesthetically pleasing as those offered by some competitors.
Features & Benefits:
- Associative Analytics: Uncovers hidden relationships and dependencies in your data, offering a more comprehensive view of risk.
- Self-Service Dashboard Creation: Empowers users to build custom dashboards tailored to their specific needs.
- Real-Time Data Processing: Facilitates immediate insights, critical for timely decision-making in dynamic markets.
- Data Integration: Connects to a variety of data sources, providing a holistic view of risk across the organization.
Pros:
- Powerful associative analytics for in-depth risk analysis.
- High performance even with large datasets, essential for financial modeling and analysis.
- Flexible deployment options (cloud, on-premises, hybrid).
- Strong data integration capabilities.
Cons:
- Steeper learning curve compared to some competitors.
- Visualizations may not be as polished as some alternatives.
- Customization for specific risk management needs may require significant effort.
- Higher price point than basic visualization tools. While Qlik doesn't publicly list pricing, it typically involves a subscription model based on user licenses and data volume, which can be substantial for larger organizations.
Implementation Tips:
- Start with a clear definition of your risk management objectives and key performance indicators (KPIs).
- Leverage Qlik's guided analytics features initially, then gradually explore more advanced customization options.
- Invest in training to fully utilize the platform's powerful capabilities.
- Consider engaging Qlik consultants for complex implementations or integrating with existing systems.
Comparison:
Compared to tools like Tableau, Qlik offers deeper analytical capabilities but sacrifices some ease of use and visual appeal. Power BI sits somewhere in between, offering a balance of user-friendliness and analytical depth. Choosing the right tool depends on your specific needs and technical expertise.
Website: https://www.qlik.com/
Qlik earns its place on this list due to its powerful associative analytics engine, which provides a unique approach to risk management by uncovering hidden relationships and enabling a deeper understanding of complex financial data. While it requires a greater investment in terms of both cost and learning curve, its capabilities make it a valuable tool for financial professionals who need to navigate complex risks and make informed decisions.
Core Risk Dashboard Comparison: Top 8 Tools
| Product Name | Core Features ✨ | User Experience ★ | Value Proposition 💰 | Target Audience 👥 |
|---|---|---|---|---|
| Microsoft Power BI Risk Management Dashboard | Real-time alerts, drill-downs, heat maps, natural language queries, MS ecosystem integration | Drag-and-drop ease; advanced features have a steep learning curve | Cost-effective & robust data modeling | Risk managers & organizations |
| Tableau Risk Management Dashboard | Advanced visualization, what‑if analysis, geo mapping, mobile‑optimized dashboards | Superior data exploration; requires specialized skills | Excellent for complex risk data analysis | Enterprises with complex data needs |
| IBM OpenPages with Watson | AI-powered risk analytics, unified GRC, customizable dashboards, predictive insights, automation | Powerful capabilities; complex interface demanding dedicated resources | Comprehensive, scalable with strong regulatory focus | Large enterprises & compliance teams |
| LogicManager Risk Management Dashboard | Risk taxonomy builder, root cause analysis, automated assessments, control testing, appetite monitoring | Intuitive interface; minimal training required | Purpose‑built ERM with strong advisory support | Enterprise risk professionals |
| MetricStream GRC Dashboards | Role‑based dashboards, real‑time risk & compliance monitoring, issue remediation, configurable scoring | Comprehensive functionality; interface can be complex | All‑in‑one GRC platform with extensive frameworks | Regulated industries & large enterprises |
| SAP Risk Management Dashboard | ERP integration, risk‑adjusted forecasting, continuous KRI monitoring, audit management, automation | Deep integration with business processes; less intuitive | Enterprise‑grade security & process integration | SAP‑centric enterprises |
| Resolver Risk Management Dashboard | Incident management, risk wizard, compliance mapping, vulnerability monitoring, trend analysis | User‑friendly with minimal training; straightforward interface | Balanced functionality with effective implementation | Corporate security & risk teams |
| Qlik Risk Management Dashboard | Associative analytics, self‑service creation, real‑time processing, flexible cloud/on‑premises options | Fast performance; steep learning curve; needs customization | Powerful analytics to uncover hidden risk relationships | Data‑driven risk analysts & IT professionals |
Empowering Risk Management Decisions
From the versatile Microsoft Power BI and Tableau to specialized solutions like IBM OpenPages with Watson and LogicManager, the eight risk management dashboards explored in this article offer powerful tools for navigating today's complex market landscape. Key takeaways include the importance of scalability, integration capabilities, and advanced analytics in choosing the right solution. Remember that the ideal dashboard should align seamlessly with your organization's specific risk appetite, industry regulations, and reporting requirements. For professional traders, real-time data integration and advanced analytical features are paramount; financial institutions might prioritize robust compliance tracking and audit trails; while individual investors may find user-friendly interfaces and customizable reporting more beneficial.
Selecting and implementing these tools requires careful consideration. Evaluate your current risk management processes, identify key performance indicators (KPIs), and determine the level of automation and reporting you need. Creating comprehensive dashboards is only one part of effective risk management. To further streamline your process and ensure consistent reporting, consider using risk management reporting templates for documenting identified risks, mitigation strategies, and key metrics. These templates, like the Ultimate Risk Management Reporting Template from SimpleCerts, can complement your chosen dashboard solution to create a cohesive risk management framework.
Ultimately, effective risk management empowers proactive decision-making, safeguards your investments, and enhances long-term success. By leveraging the insights and functionalities provided by these dashboard solutions, you can transform risk from a potential threat into a strategic advantage.
Want to stay ahead of market volatility and manage risk effectively? ChartsWatcher offers advanced charting and analysis tools to help you identify potential risks and opportunities in real-time. Visit ChartsWatcher today and empower your trading decisions with cutting-edge market intelligence.
