A Trader's Guide to Bearish Divergence RSI
A bearish RSI divergence is one of those classic chart patterns that can give you a serious edge. It’s a subtle warning sign that a strong uptrend might be running out of gas.
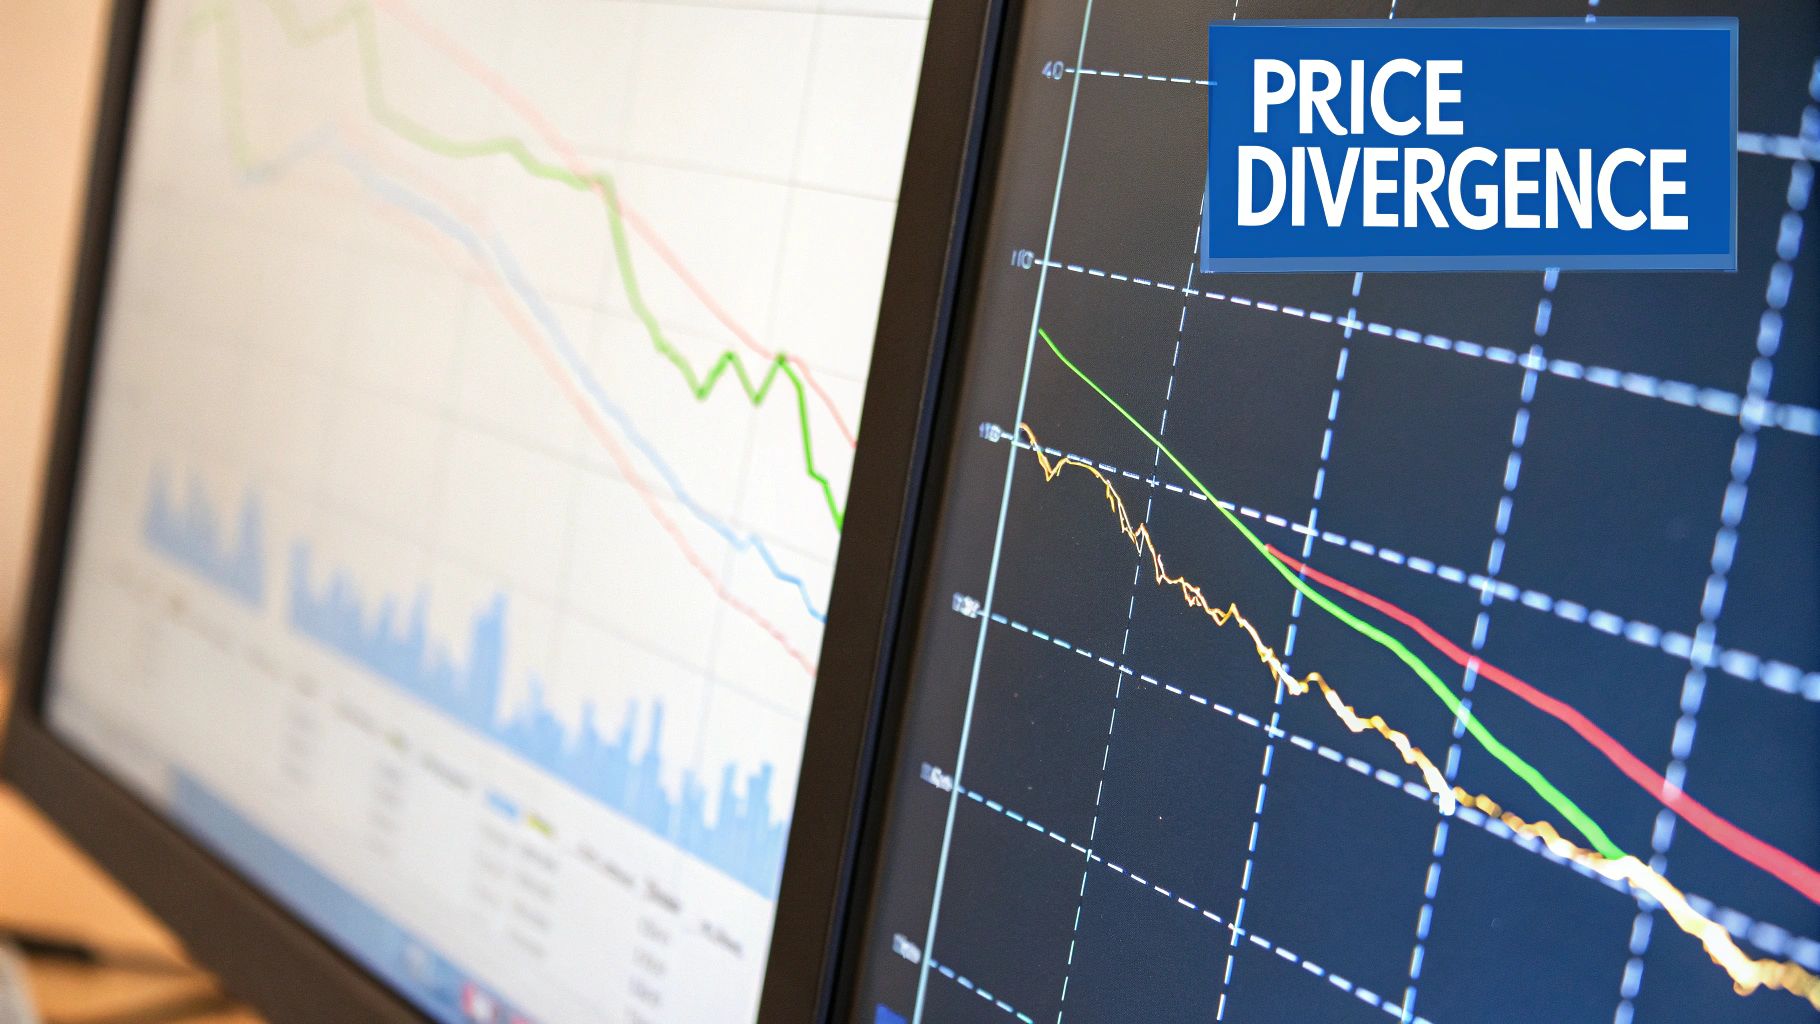
Think of it like this: You see a stock’s price pushing to new, exciting highs. On the surface, everything looks great. But underneath, the engine driving that price—the momentum—is starting to sputter. The price keeps coasting uphill for a bit, but the power just isn't there anymore. That's the divergence in a nutshell. It’s an early signal that the buying pressure is fading and a price reversal could be just around the corner.
Decoding the Bearish Divergence RSI Signal
So, what does this signal actually look like on a chart? Imagine watching a crowd cheer for a sports team. The team scores, and the roar is deafening. They score again, hitting a new peak in the game, but this time, the cheers are a little less enthusiastic. The scoreboard shows progress, but the energy in the stadium is clearly dropping.
That’s exactly what a bearish divergence shows: the price is climbing to new highs, but the underlying momentum is weakening.
This pattern tells a critical story about what's happening behind the scenes. The higher prices aren't being supported by the same level of buying conviction that fueled the initial climb. Often, this is a sign that the "smart money" or experienced traders are quietly starting to cash out their positions, while newer traders are still buying in, chasing the recent peaks. The divergence is the visual proof of this shifting power dynamic.
The Core Components of the Signal
To really get this concept down, you have to look at its two distinct parts: what the price is doing and what the RSI indicator is doing.
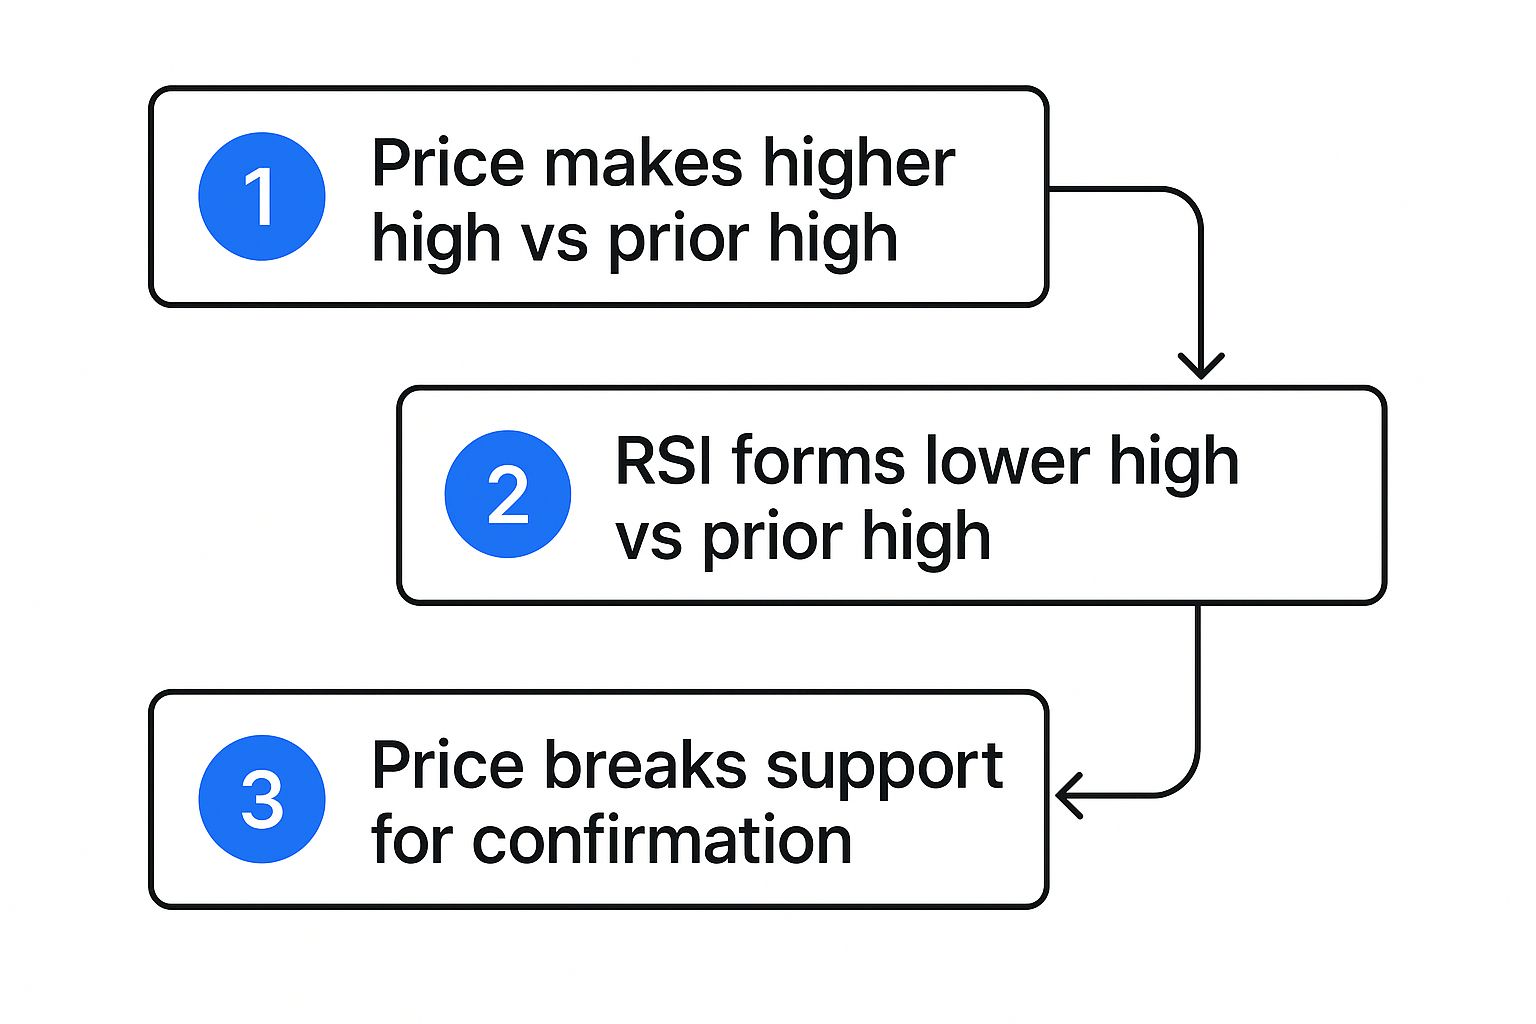
- Higher Highs in Price: This part is simple. The asset’s price needs to make a new high that is visibly higher than a previous one. This is the bullish part of the pattern that can easily fool traders who only watch the price action.
- Lower Highs on the RSI: At the same time, the Relative Strength Index (RSI)—usually on a 14-period setting—must form a peak that is lower than the peak it made during the previous price high. This disagreement is the "divergence" we're looking for.
Why This Signal Matters to Traders
This isn't just a couple of lines on a chart; it’s actionable intel. For options traders, spotting a bearish divergence can be a heads-up to a potential market downturn. This might lead them to sell call contracts or start buying put options in anticipation of a drop.
The pattern often serves as an early warning, helping to identify potential price tops days or even weeks in advance. This gives you time to plan your next move and manage your risk much more effectively. For a deeper look into putting this into practice, you can explore more insights on RSI divergence strategies on Optionstrading.org.
The Market Psychology Behind a Fading Trend
 A bearish RSI divergence is more than just a couple of lines heading in opposite directions on your chart. It’s a story unfolding in real-time about the subtle power shift between buyers and sellers. To really get a handle on this signal, you have to look past the pattern and tap into the market psychology driving it. It’s a battle of wills where the buyers, once firmly in control, are starting to run out of steam.
Think of an uptrend like a huge wave building as it rolls toward the shore. At its peak, the wave is massive, hitting its highest point. But just before it crashes, the water underneath starts to recede, pulling back from the beach. The top of the wave is still high, but the underlying force that got it there is gone. A bearish divergence RSI pattern is exactly that—the price pushes to a new high, but the momentum is already retreating.
This disconnect is the market’s way of telling you the rally is running on fumes. The initial excitement that sent prices soaring is fading, and the conviction behind the trend is getting weaker by the minute.
The Story of Buyer Exhaustion
At the beginning of a healthy uptrend, buying is aggressive. Every little dip gets snapped up, and prices are pushed higher with real force. But as the price climbs into what many perceive as overvalued territory, that dynamic begins to change. Fewer buyers are willing to jump in at these sky-high levels, worried they’re late to the party.
This hesitation is the first sign of buyer exhaustion. The price might still creep up a bit, often pushed by late-arriving retail traders driven by FOMO (Fear Of Missing Out), but that broad, powerful buying pressure is gone. This is precisely what the RSI indicator is designed to detect.
A bearish divergence is the market whispering that the party is winding down. The music is still playing (higher prices), but the most important guests (smart money) are quietly slipping out the back door.
The signal gives you a window into how different market participants are thinking. It reveals a clear split between the "smart money"—seasoned traders and institutions—and the less-experienced crowd.
Smart Money vs. The Crowd
As an uptrend matures, the experienced traders who got in early start looking for their exit. They see the momentum weakening on the RSI and begin to take profits. They don't just dump all their shares at once; they sell strategically, feeding their shares into the remaining buying demand from the crowd.
This gradual selling pressure is absorbed by the last wave of optimistic buyers—the "crowd"—who are often lured in by hyped-up headlines and the appeal of a rally that looks unstoppable. They’re the ones buying the new price highs, completely unaware that the very traders who started the trend are now selling to them.
This transfer of shares from strong, early hands to weaker, late hands is a classic topping formation. The bearish divergence is the technical footprint left behind by this process, exposing three key psychological shifts:
- Waning Enthusiasm: The force of new buy orders is drying up.
- Profit-Taking: Early investors are systematically cashing out.
- Latecomer Trap: The final price spike is often a trap, fueled by less-informed traders buying at the absolute peak.
Getting a feel for these overbought market conditions is a massive advantage for timing your trades. For a closer look, our guide on using oversold and overbought indicators offers more context and strategies.
Ultimately, learning to read the psychology behind a bearish RSI divergence elevates you from a simple pattern-follower to a true market analyst who understands the why behind the price action. That deeper level of understanding is what separates the consistently profitable traders from everyone else.
How to Identify Bearish Divergence on a Chart
Spotting a bearish RSI divergence isn't about staring at a chart and hoping for a sign. It's more like being a detective. You're looking for a specific set of clues that tell you the story happening underneath the price action.
It’s a systematic process of comparing what the price is doing with what the momentum is telling you. Once you get the hang of it, these potential reversals will start to jump out at you. It’s a simple, repeatable checklist that trains your eyes to see the subtle disagreement between price and momentum that defines this powerful signal.
Step 1: Confirm a Clear Uptrend
First things first: you can't spot a trend that's running out of gas if there's no trend to begin with. The initial step is to make sure the asset is in a solid, established uptrend.
Look for a clear series of higher highs and higher lows on the price chart. A bearish divergence is a signal of exhaustion, so it only makes sense in the context of a rally. Trying to find one in a choppy, sideways market is a recipe for false signals and frustration. The stronger the uptrend, the more meaningful a divergence becomes.
Step 2: Pinpoint Two Consecutive Highs in Price
With the uptrend confirmed, zoom in on the price action. Your job is to find two distinct and consecutive peaks. The rule is simple: the second peak must be visibly higher than the first one.
This is the "higher high" part of the pattern. On its own, this looks completely bullish. It’s what fools many traders into thinking the rally has more room to run. This is the deceptive part of the setup, where the surface-level story suggests strength while the real story is hidden in the indicator below.
Step 3: Locate the Corresponding RSI Peaks
Now, your eyes move from the price chart down to your RSI indicator. You need to find the exact peaks on the RSI that line up with the two price peaks you just identified.
This is crucial—you have to match the points correctly. Most charting platforms have a crosshair or vertical line tool that makes it easy to align the price high with the indicator's reading at that exact moment. The standard setting for the RSI is 14-periods, which works well for most timeframes. If you want to dive deeper into tweaking these settings, our guide on how to master RSI in stocks with top strategies revealed is a great resource.
Step 4: Verify the RSI Is Making a Lower High
This is the moment of truth. While the price just printed a confident higher high, you need to check if the RSI did the opposite. The second peak on the RSI must be noticeably lower than the first one.
This disagreement is the heart and soul of a bearish divergence. It’s the market whispering that even though price managed to inch higher, the conviction and buying pressure behind that move were fading fast.
If the RSI also makes a higher high, there's no divergence. Price and momentum are in sync, and the uptrend is likely still healthy. It's only when the RSI makes a lower high that the warning signal flashes.
Step 5: Draw Trendlines to Visualize the Divergence
The final step makes the pattern impossible to miss. Grab your drawing tool and connect the dots. This simple visual trick removes any doubt.
- On the Price Chart: Draw an upward-sloping line connecting the two higher highs.
- On the RSI Indicator: Draw a downward-sloping line connecting the two corresponding lower highs.
When you’re done, you should see two lines pointing in opposite directions. That’s your undeniable confirmation that a bearish RSI divergence is in play and the uptrend might be in serious trouble.
To help you systematize this process, I've put together a simple checklist. Run through these points every time you think you've spotted a divergence to make sure you haven't missed a crucial detail.
Checklist for Confirming Bearish Divergence
Use this systematic checklist to validate every potential bearish RSI divergence signal before taking any action.
| Checklist Item | Confirmation Status (Yes/No) | Notes and Observations |
|---|---|---|
| Is there a clear, established uptrend? | Note the series of higher highs/lows. | |
| Has the price made a distinct higher high? | Mark the two price peaks (Peak 1 & Peak 2). | |
| Has the RSI made a corresponding lower high? | Mark the two RSI peaks that align with price peaks. | |
| Is the RSI peak occurring below the 70 level? | Divergences are often stronger when RSI is overbought. | |
| Are the trendlines for price and RSI diverging? | Price line up, RSI line down. | |
| Is there any other confirming price action (e.g., bearish candle)? | Look for reversal patterns like dojis or engulfing candles. |
By using this checklist, you move from just seeing a pattern to actively confirming it. This discipline is what separates consistently profitable traders from those who rely on guesswork.
Analyzing Real-World Chart Examples

Theory is one thing, but the real "aha!" moment comes when you see a bearish RSI divergence play out on a live chart. Knowing the textbook definition is fine, but watching how this pattern behaves in the messy, unpredictable world of actual markets is where the real learning happens. So, let's step away from the abstract and dive into a few mini case studies across different markets.
We'll look at some classic signals that gave traders a heads-up before a major drop, giving you a crystal-clear picture of what a good setup looks like. But just as important, we're going to dissect a failed signal. I think this is crucial. It helps build a realistic trading mindset, teaching you to respect the pattern's power while remembering that no signal is foolproof and risk management is non-negotiable.
Example 1: A Classic Stock Market Top
First up, let's look at a popular tech stock that was in the middle of a massive bull run. The price action was relentless, printing new all-time highs week after week and pulling in anyone with a fear of missing out.
On the daily chart, the stock shot up to a new peak in early February, and the RSI was screaming "overbought" way up past the 70 mark. A few weeks later, the stock rallied one more time, pushing to an even higher price. But a quick glance at the RSI oscillator showed momentum was telling a completely different story—it had carved out a much lower peak. That's your classic bearish divergence, right there in plain sight.
- Price Action: The stock made a clean higher high. To the naked eye, the uptrend looked perfectly healthy.
- RSI Indicator: The RSI printed a lower high, waving a red flag that the buying pressure was getting exhausted.
The confirmation we were waiting for came when the price finally cracked below a short-term rising trendline. Traders who spotted this and took action were positioned perfectly for the 15% correction that followed, wiping out months of gains in just a couple of weeks. It’s a textbook case of how divergence acts as an early warning system before the floor gives out.
Example 2: Volatility in the Cryptocurrency Market
We all know crypto markets are famous for their wild swings, which makes momentum tools like the RSI especially handy. Let's shift gears to a popular altcoin on a 4-hour chart, a favorite timeframe for crypto swing traders.
This coin went on an absolutely parabolic run, more than doubling in a very short time. It hit a sharp peak with the RSI deep in overbought territory. After a little consolidation, the price made one last, desperate push to a new high. But the RSI just couldn't keep up. It printed a significantly lower high.
A divergence like this in a hyper-volatile market is a critical signal to pay attention to. It’s the market’s way of saying that the explosive buying power is tapped out, leaving it vulnerable to a waterfall decline as traders rush to take profits.
And that’s exactly what happened. The result was a swift and brutal drop. The divergence was the perfect cue for long holders to get out or for aggressive traders to open a short position. In the days that followed, the price plummeted over 30%, proving just how effective this pattern can be in fast-moving markets.
Example 3: A Failed Signal in Forex
Now for a dose of reality. Not every divergence leads to a massive reversal. To give you the full picture, let’s look at a time when a bearish RSI divergence on a major forex pair completely failed.
On the daily chart, this currency pair was in an incredibly strong, fundamentally-driven uptrend. A picture-perfect bearish divergence formed over several weeks: price kept grinding out higher highs while the RSI was making lower highs. Based on the pattern alone, you’d be forgiven for thinking a big drop was right around the corner.
But the price never broke any meaningful support. Instead, it just chopped sideways for a few days, which effectively allowed the momentum to "reset" itself. Then, bam—it blasted off to new highs, resuming the primary trend with force. This failed signal drives home a critical rule: divergence is a warning, not a trigger. Without confirmation from the price itself—like a broken trendline or a lower low—you have to treat the signal with a healthy dose of skepticism. The underlying trend was simply too powerful for the weakening momentum to stop it.
How to Trade Bearish Divergence Signals
Spotting a bearish RSI divergence is like seeing smoke on the horizon—it’s a powerful warning sign, but it’s not the fire itself. The real skill lies in turning that observation into a well-executed trade with a clear plan. Too many traders make the mistake of jumping into a short position the second they see divergence. This is a quick way to get burned, as strong trends can often squeeze out one last push higher before finally rolling over.
The trick is to move from identification to execution with patience. A divergence tells you an uptrend is running out of steam; a price breakdown proves it. By waiting for confirmation from the price action itself, you build a much stronger case for a trade and seriously stack the odds in your favor.
Building a Complete Trading Plan
A professional trader never enters a position based on a single signal. They need a complete battle plan: an entry trigger, an exit point if they're wrong, and a target if they're right. Anything less isn't trading—it's gambling.
Here’s a simple framework to give your trades structure:
-
Wait for Price Confirmation: This is non-negotiable. Never act on the divergence alone. You need to see the price itself confirm that the bears are taking over. This could be a break below a recent swing low, a close below a key support level, or a sharp crack of a rising trendline.
-
Look for Candlestick Patterns: Bearish candlestick patterns appearing near the second price peak add a ton of weight to the signal. Keep an eye out for a shooting star, a bearish engulfing pattern, or an indecisive doji. These formations scream that buyers are exhausted right at a critical moment.
-
Define Your Risk with a Stop-Loss: Your stop-loss is your safety net. The most logical place to set it is just above the highest price peak in the divergence formation. This way, if the signal fails and the price rips to new highs, you're out with a small, manageable loss.
-
Set Logical Profit Targets: Know where you’re getting out before you get in. A common approach is to target the next major support level on the chart. You could also use tools like Fibonacci retracement levels or simply aim for a risk-to-reward ratio of at least 1:2, meaning your potential profit is at least double your potential loss.
A bearish divergence warns of a potential top, but price action confirms it. The most successful traders wait for both before pulling the trigger, turning a probable setup into a high-probability trade.
The Power of Confluence and Confirmation
Confluence is a core concept in trading. It's the idea that when multiple, independent signals all point to the same outcome, the odds of that outcome happening go way up. A bearish RSI divergence is a strong hint on its own, but when it’s combined with other factors, it becomes incredibly powerful.
And there's data to back this up. Statistical studies on RSI bearish divergence have shown it’s a reliable indicator in major markets. One analysis of S&P 500 data found that these signals came before price drops averaging 7-12% over the next 10-20 trading days roughly 68% of the time. Better yet, when the divergence was paired with a confirmation signal—like shrinking volume on the second peak or a trendline break—the success rate jumped above 70%. That's a real statistical edge.
Folding a bearish RSI signal into a broader, systematic framework is how professionals approach it. This data-driven mindset is the foundation of many quantitative investing strategies, where signals are never trusted in isolation and must be validated by multiple criteria before any capital is put at risk.
By following a structured approach, you stop treating the bearish divergence as a random observation and start using it as part of a complete, actionable trading strategy. You’ll have an entry based on confirmation, your capital protected by a stop-loss, and clear profit targets—giving you a professional edge from start to finish.
Common Mistakes to Avoid When Trading Divergence

Learning to spot a bearish RSI divergence feels like unlocking a new level in your trading game. But this is exactly where a lot of traders get into trouble. Seeing the pattern is one thing; avoiding the classic blunders that sink an otherwise perfect setup is another entirely.
Too many traders spot the divergence and immediately smash the "sell" button. Then they can only watch in agony as the price rips higher for one last squeeze.
The trick is to think defensively. Treat divergence not as a green light to go short, but as a flashing yellow light warning you that the trend might be changing. Flooring it through that intersection without checking for cross-traffic is a recipe for a wreck. By learning the most common errors, you can build a more robust strategy that protects your capital.
Mistake 1: Acting on the Signal Too Early
This is the big one. Hands down, this is the number one way traders blow up a divergence trade. A roaring uptrend can flash a bearish RSI divergence for a surprisingly long time before it finally runs out of steam. Jumping the gun based on the indicator alone is a classic rookie mistake.
An uptrend is an uptrend until the price—not the indicator—says otherwise.
Divergence is a warning, not a trigger. The pros always wait for the price chart to confirm what the RSI is whispering. Patience is your best friend here.
Before you even think about placing a short order, you need to see clear weakness in the price itself. This could be:
- A clean, decisive break below a key support level or a rising trendline.
- The price printing a lower low for the first time in the uptrend.
- A major bearish candlestick pattern, like a big red engulfing candle, that shows sellers are finally taking control.
Mistake 2: Treating Divergence as a Magic Bullet
Another critical error is seeing the bearish divergence RSI signal and getting tunnel vision. No single indicator is infallible, and divergence is no exception. It becomes exponentially more powerful when it lines up with other factors in a concept traders call confluence.
Relying on one signal is like trying to navigate a ship with just a compass; you might know which way is north, but you're blind to the currents, the weather, and the giant rocks just below the surface. To build a strong case for any trade, you need confluence.
Look for multiple, independent reasons that all point to the same conclusion. For instance, a bearish divergence becomes a high-probability setup if it forms just as the price slams into a major historical resistance level, and you see trading volume dying off on that final push higher. Every extra piece of evidence stacks the odds in your favor.
Mistake 3: Ignoring the Broader Market Context
Finally, it's easy to get so zoomed in on a single chart that you lose the forest for the trees. A bearish divergence on a 15-minute chart doesn't mean much if the daily and weekly charts are in a raging bull market. The larger trend is like a powerful ocean current; it can easily swallow up small, short-term signals.
Always start your analysis on a higher timeframe to get your bearings. If you’re eyeing a short trade based on a bearish divergence, ask yourself: Am I swimming with the current or against it? Fighting the primary trend can work, but it’s a much harder game that demands precision and carries far more risk. Respecting the bigger picture keeps you from picking fights you’re not likely to win.
Frequently Asked Questions
What Is the Best Timeframe for Bearish Divergence?
You'll spot bearish RSI divergence on just about any chart, from a 5-minute to a weekly. But here’s the key: the higher the timeframe, the more weight the signal carries. A divergence on a daily or weekly chart often flags a major, lasting trend reversal that you don't want to ignore.
Signals on lower timeframes can work for quick scalps or day trades, but they come with a lot more market noise and a much higher chance of failing. Think of it this way: a daily chart divergence is a loud warning bell, while a 5-minute one is more like a whisper.
Can Bearish Divergence Give False Signals?
Absolutely. Let's be crystal clear: no indicator is a crystal ball, and bearish divergence is no exception. It can definitely give you false signals. It's not uncommon to see a clear divergence form, only for the price to keep grinding higher, stopping out shorts along the way.
This is precisely why you never trade the divergence in isolation. It's a clue, not a command. Always wait for price action to confirm your suspicion—like a broken trendline or a nasty-looking bearish engulfing candle. Wait for the price to agree with the indicator.
How Is This Different from Bullish Divergence?
It’s the exact same concept, just flipped upside down to spot potential market bottoms. Bullish divergence shows up in a downtrend when a stock makes a new lower low, but the RSI indicator refuses to follow, instead printing a higher low.
This tells you that the sellers are getting exhausted. Even though the price has dropped, the downward momentum is fading fast, hinting that a bullish reversal could be just around the corner.
