A Swing Trade Strategy to Beat the Market
A swing trade strategy is all about holding a position for anywhere from a few days to a few weeks. The goal? To profit from those short- to medium-term price movements, or "swings," that happen all the time in the market.
It's a different beast from day trading. You're not glued to your screen all day, which makes it a much more flexible approach. Instead of trying to scalp tiny gains, you're focused on capturing a single, substantial price move. The entire game is about identifying a stock's likely next move and riding it for the bulk of the profit.
Decoding the Swing Trader's Mindset
Before you can build a system that consistently makes money, you have to get inside the head of a swing trader. This style sits in a sweet spot right between the frantic, high-frequency world of day trading and the slow, passive nature of long-term investing. It’s a game of patience, probability, and most of all, disciplined execution.
You’re not trying to catch every little dip and rip. A swing trader’s job is to spot a clear trend or a reliable pattern and stick with it for a good chunk of its journey. This takes a certain psychological toughness—you have to be comfortable holding positions overnight and disciplined enough to resist knee-jerk reactions to every bit of market noise.
Key Characteristics of Swing Trading
A solid swing trading strategy is built on a few core pillars. Knowing these will help you figure out if this style is a good fit for your personality and financial goals.
- Medium-Term Horizon: Trades typically last from two days up to several weeks. This gives a trend enough room to play out while still being short enough for you to stay nimble.
- Emphasis on Technical Analysis: While fundamentals have their place, swing traders live and die by the charts. Chart patterns, key technical indicators like Moving Averages and RSI, and volume analysis are your primary tools.
- Defined Risk Management: This is non-negotiable. Every single trade needs a pre-determined stop-loss to protect your capital. It's the one rule that keeps a single bad trade from wiping out a week's worth of gains.
- Favorable Market Conditions: Swing trading works best in markets with clear, defined trends. When the market is choppy and directionless, finding high-probability setups gets a whole lot tougher.
How Does It Compare to Other Styles?
To really understand swing trading, it helps to see how it stacks up against other popular approaches. It’s not about which style is "better"—it's about which one fits your life, your schedule, and how much risk you're willing to take.
This table gives a quick snapshot of the key differences.
Swing Trading vs Other Trading Styles
| Characteristic | Swing Trading | Day Trading | Long-Term Investing |
|---|---|---|---|
| Holding Period | Days to Weeks | Minutes to Hours | Months to Years |
| Time Commitment | Moderate | Very High | Low |
| Primary Analysis | Technical | Technical | Fundamental |
| Typical Goal | Capture one "swing" | Multiple small profits | Capital appreciation |
As you can see, swing trading offers a balanced middle ground that avoids the constant stress of day trading and the ultra-long horizons of investing.
This balanced approach can deliver some seriously impressive results when you stick to your plan. A comprehensive, decade-long study of a large-cap stock strategy really drives this home. The analysis showed annual returns ranging from 8% to 16%, with one peak year hitting 20% and an overall 65% win rate. The average trade in that strategy lasted about 30 days, which lands squarely in the swing trading timeframe. You can dig deeper into these kinds of performance metrics and see how factors like debt ranking impact swing trades at tickeron.com.
The Swing Trader's Edge: The real advantage is the risk-to-reward profile. By targeting larger price moves, a swing trader can set up trades where the potential profit is significantly larger than the potential loss. This means you don't have to win every trade to be profitable in the long run.
How to Build Your Trading Framework
A profitable swing trading strategy isn't something you just find online; it's something you build. It has to be a personal framework that actually fits your risk tolerance, your schedule, and even your personality. Without a clear set of rules, you’re not trading—you’re gambling, just reacting to market noise instead of executing a disciplined plan.
The whole point is to create a simple, repeatable process that kills the guesswork. This framework will define exactly what you’re looking for, when you get in, how you manage your risk, and when you take your money and run.
Let's build one from the ground up, piece by piece.
Selecting Your Core Technical Indicators
First things first: picking your tools. My advice? Less is more. A chart cluttered with a dozen indicators is a recipe for "analysis paralysis," where conflicting signals leave you frozen and unable to make a decision. A solid strategy relies on just a few reliable indicators that work together to tell a clear story.
For a robust starting point, I like a combination that covers trend, momentum, and confirmation.
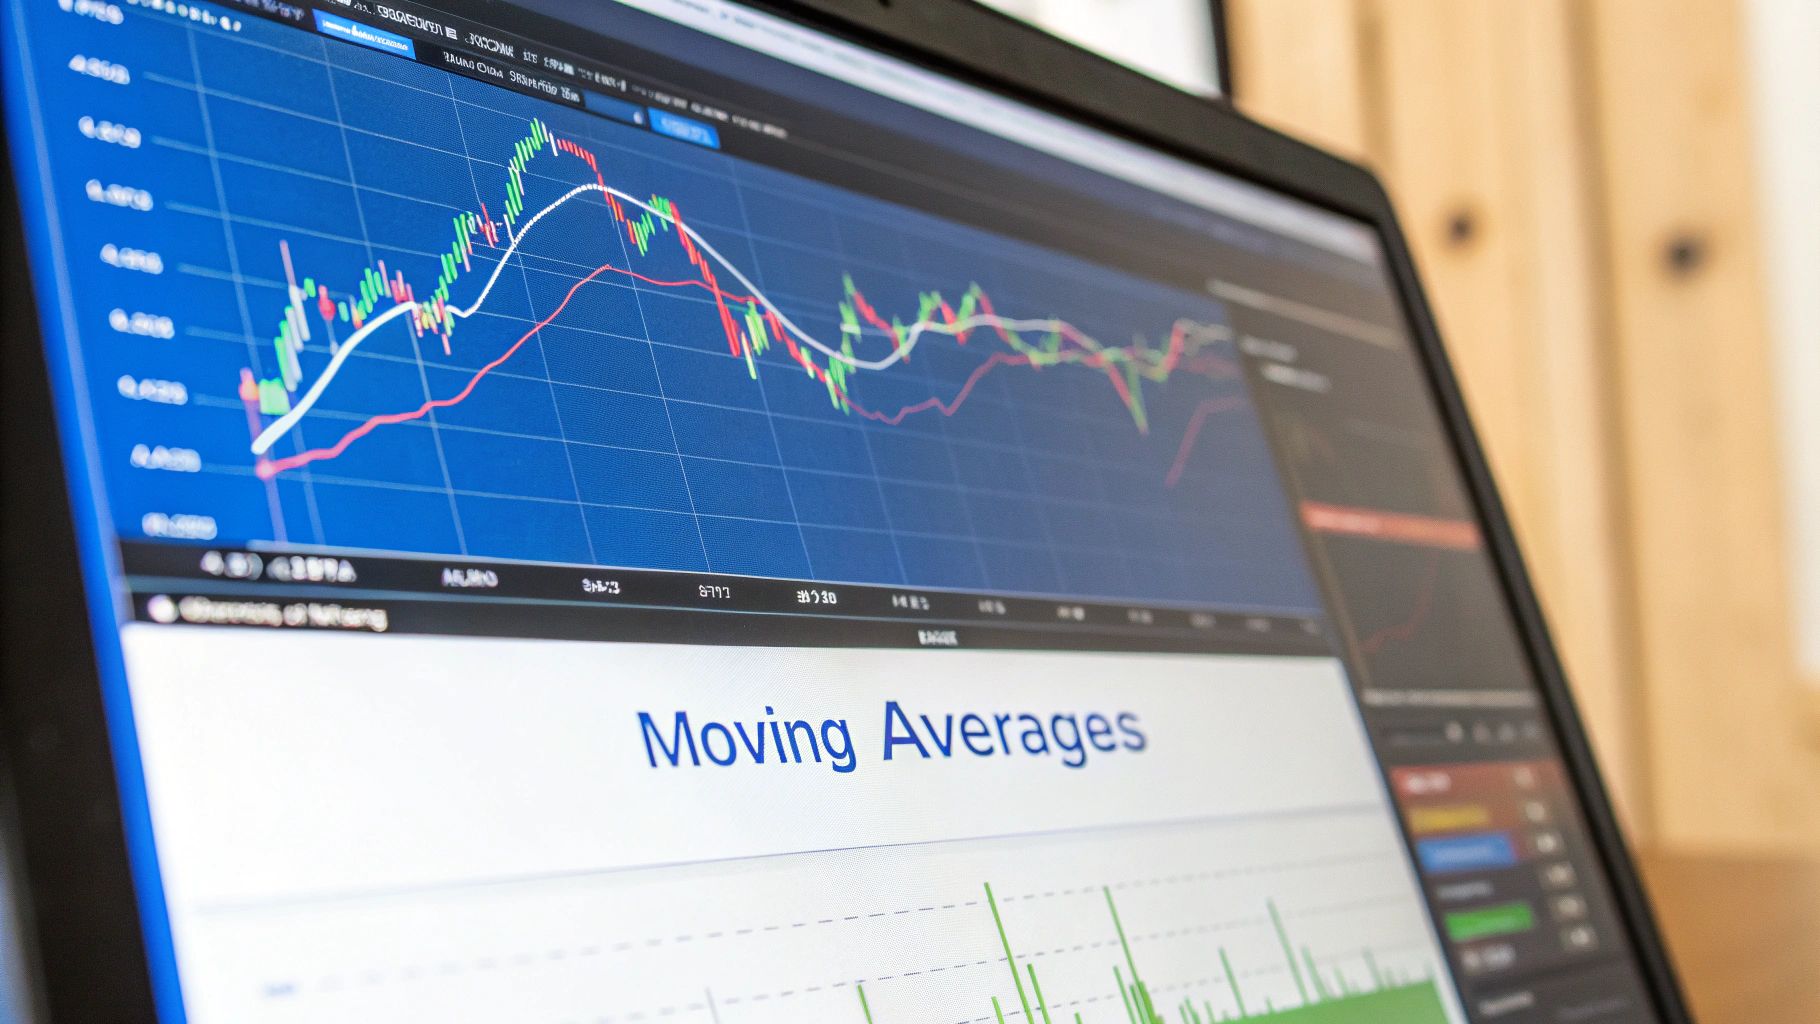
- Moving Averages (MAs): These are non-negotiable for identifying the trend. Using two MAs, like the 20-period and 50-period Simple Moving Averages (SMAs), gives you a quick visual on the short and medium-term trend. When the shorter-term MA crosses above the longer one, things are generally looking bullish, and vice-versa. It’s simple but effective.
- Relative Strength Index (RSI): This is my go-to for momentum. It helps gauge if a stock is getting overbought (usually above 70) or oversold (below 30). It’s perfect for timing entries on pullbacks. For example, in a strong uptrend, an RSI dip near the 40 or 50 level can signal a fantastic buying opportunity before the next leg up.
- Volume: Volume is your truth detector. It confirms the strength behind a price move. A breakout on massive volume is way more convincing than one on barely any interest. Always check if a move has real participation behind it.
This simple trio—trend, momentum, and volume—gives you a complete picture without overcomplicating things. It’s a clean foundation for any swing trading strategy.
Defining Your Entry and Exit Rules
Once your indicators are chosen, you need to set non-negotiable rules for getting in and out of trades. These rules have to be crystal clear, leaving zero room for emotion or second-guessing. They are the absolute heart of your trading framework.
Your trading rules are your contract with yourself. Breaking them is the fastest way to lose money. A disciplined trader follows their system, even when it feels uncomfortable.
Let's put our indicators to work and create a sample bullish entry rule:
- Entry Condition: The stock's price is trading above its 50-day SMA, confirming a healthy medium-term uptrend. The stock then pulls back to touch the 20-day SMA, while the RSI dips below 50 but holds above 40. This is confirmed by a bullish candlestick pattern that forms on above-average volume.
See how specific that is? It doesn’t just say "buy the dip." It gives you a precise checklist that must be satisfied before you risk a single dollar.
Your exit rules are just as critical, and they need to cover both scenarios: being right and being wrong.
- Stop-Loss Rule: Define your pain point before you enter the trade. A common method is placing your stop just below the most recent swing low or a key support level. This ensures that if you're wrong, the loss is small and manageable. No exceptions.
- Profit Target Rule: Know where you're going to get out when you're right. This could be based on a fixed risk-to-reward ratio (like aiming for a 2:1 or 3:1 return on your risk) or a technical level, like the next major resistance area on the chart.
This infographic breaks down the visual process for spotting a potential setup using these core ideas.
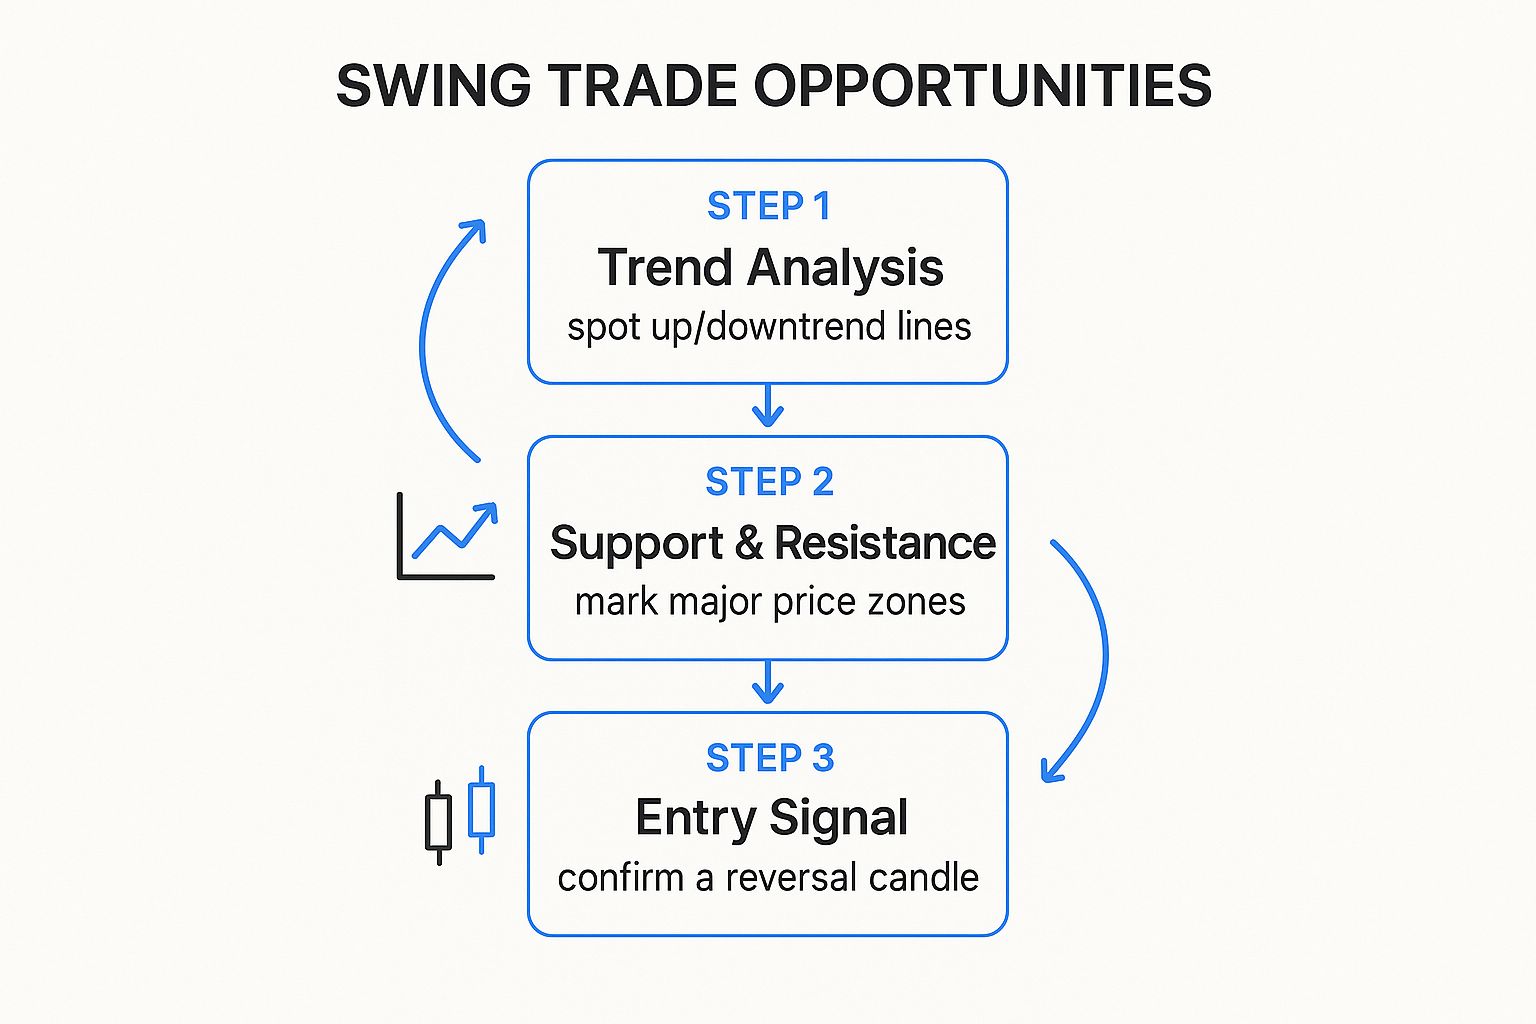
This three-step process—identify the trend, mark your levels, and wait for the signal—is the logical backbone of any repeatable strategy.
Turning Your Rules into Scannable Criteria
Now, manually hunting for stocks that meet these exact rules would take forever. This is where a powerful scanner like ChartsWatcher becomes your best friend. You can translate your trading rules directly into the scanner’s criteria and let the software do all the heavy lifting for you.
For the bullish setup we just designed, a scan in ChartsWatcher might look something like this:
- Price is greater than the 50-day SMA.
- Price is within 2% of the 20-day SMA.
- RSI (14) is between 40 and 50.
- Daily Volume is greater than the 50-day average volume.
Running this scan gives you an instant, curated list of stocks that perfectly match your entry criteria. It automates the discovery process, freeing you up to focus on analyzing the best candidates and managing your trades. That’s how you trade efficiently.
Finding High-Probability Setups with Market Scanners
A solid swing trade strategy is a beautiful thing, but it’s completely useless if you can't find stocks that actually fit your rules. Let's be real: manually flipping through thousands of charts every day isn't just a waste of time—it's a fast track to burnout and missed opportunities.
This is exactly why market scanners become a swing trader's best friend.
Think of a scanner as your personal research assistant, tirelessly filtering the entire market down to a small, manageable list of high-probability candidates. You translate your strategy's criteria into specific filters, and voila—you've automated the most tedious part of trading. Instead of hunting for setups, they're delivered right to you.
Building Scans for Bullish Conditions
When the market is trending up, the game plan is to find strong stocks that are taking a breather before their next leg higher. A classic, battle-tested swing trade is buying a pullback to a key moving average.
So, how do we translate that idea into a practical scan using a tool like ChartsWatcher? We’re essentially looking for fundamentally sound companies in a healthy uptrend that are offering us a slight discount.
Here’s what a sample scan for a bullish pullback might look like:
- Market Cap: Greater than $2 billion. This helps us stick with more stable, established companies.
- Average Daily Volume (30-Day): Over 500,000 shares. We need enough liquidity to get in and out of our trades without a fuss.
- Price Action: The current price is above the 50-day Simple Moving Average (SMA), confirming the medium-term trend is on our side.
- Pullback Condition: The price is trading within 3% of its 20-day SMA, which signals that short-term dip we’re looking for.
- Momentum: The Relative Strength Index (RSI) is between 40 and 60. This tells us the stock isn't overbought and has room to climb.
This scan doesn’t scream "buy now!" It gives you a high-quality watchlist of stocks that are worth a closer look. From that list, you do your real work: manually analyzing the charts for classic patterns like bull flags or bullish engulfing candles to nail your entry. You can learn more about fine-tuning these filters in our guide to using a stock screener for smart investing.
A scanner's job is to find the haystack. Your job is to find the needle. It narrows the universe of possibilities so you can apply your skill to the best candidates.
Adapting Scans for Bearish Markets
A truly comprehensive swing trade strategy works in both directions. When the market starts to show weakness, you simply flip your logic to find bearish opportunities, like shorting stocks that are breaking down from key support.
The setup is just the inverse of our bullish scan. Now, we’re hunting for weakness instead of strength.
A bearish breakdown scan might include criteria like this:
- Price Action: The current price is trading below the 50-day SMA.
- Breakdown Condition: The price has just closed below a key support level that you’ve identified on the daily chart.
- Volume Spike: The volume on the breakdown day is at least 150% of the 30-day average, confirming that sellers are in control.
This kind of focused scanning keeps you nimble, allowing you to adapt your swing trade strategy to whatever the market is throwing at you. To help find the right platforms for this kind of work, it's worth exploring the best stock market research tools out there.
Setting Realistic Expectations for Success
It’s absolutely critical to understand that no scanner or strategy will ever give you a 100% win rate. Professional trading is a game of probabilities, not certainties.
Experienced traders often report win rates between 35% and 50%. Success comes from making sure your winning trades, which might bring in returns of 12% to 45%, are significantly larger than your losses. This is why risk management is everything. The goal of scanning isn't to find flawless trades; it's to consistently find setups where your potential reward heavily outweighs your risk.
Executing and Managing Trades Like a Pro
Finding a killer setup with your scanner is a great start, but honestly, that's only half the battle. The real difference between a trader who makes consistent money and one who's always spinning their wheels comes down to what happens after you hit the buy button.
This is where the rubber meets the road—where your carefully crafted strategy has to survive contact with the live market. It’s all about turning your rules into real orders, protecting your capital when things get choppy, and having the guts to let your winners run. Without nailing this part, even the best-looking charts can turn into frustrating losses.
Setting Your Stop-Loss with Precision
Your stop-loss isn't just a random number; it's your shield. It’s what protects your account from that one big mistake. But placing it correctly is an art. Set it too tight, and you’ll get shaken out by normal market noise before the trade even has a chance to breathe. Set it too loose, and you’re just asking for a bigger-than-necessary loss.
The trick is to base your stop on the chart's structure, not on how much money you're willing to lose.
- For Long Trades: Tuck your stop-loss just underneath a recent, significant swing low or a clear support level. If the price breaks below that spot, your original reason for entering the trade is probably toast.
- For Short Trades: Do the opposite. Place your stop just above a recent swing high or a heavy resistance zone.
When you tie your stop to a technical level, you're letting the market tell you when you're wrong, which is a lot more reliable than letting your emotions do the talking.
Defining Logical Profit Targets
Just like you need an exit plan for when a trade goes against you, you absolutely need one for when it goes your way. Hopping into a trade without knowing where you’ll take profits is a classic recipe for greed to take over, convincing you to hold on for "just a little more" until the whole thing reverses.
A structured approach keeps you disciplined.
- Use Key Resistance Levels: Scan the chart for the next obvious hurdle. This might be a previous high, a major moving average, or a long-term trendline. These are natural places where sellers are likely to show up.
- Apply a Risk-Reward Ratio: A solid rule of thumb for swing trading is to shoot for a minimum risk-reward ratio of 1:2 or 1:3. In simple terms, for every $1 you're risking (the distance from your entry to your stop), you should be aiming to make at least $2 or $3 in profit.
Trader's Tip: Don't be afraid to take partial profits. You could, for instance, sell half your shares when you hit your first target (like a 1:2 risk-reward) and then slide your stop-loss up to your entry price. This move banks some cash and lets you ride the rest of the position for free.
The Power of the Trailing Stop
For those home-run trades that just keep going, a fixed profit target can leave a ton of money on the table. This is where the trailing stop becomes your best friend. Instead of being a static price, a trailing stop automatically moves up as the stock price climbs.
For example, you might set a trailing stop that always stays 10% below the stock's highest price since you got in. This method locks in your gains as the trade moves in your favor while still giving it room to run. It’s one of the most effective ways to squeeze every last drop out of your biggest winners.
To get a better handle on how your trades are performing across the board, using portfolio analysis tools can give you some serious insights into what's working and what isn't.
Mastering Trade Psychology
At the end of the day, your success really boils down to managing the person in the mirror. Fear and greed are the two biggest account killers, period. Fear makes you jump out of good trades too early, and greed convinces you to overstay your welcome or risk way too much.
The only real antidote is your trading plan. Your entry rules, your stop-loss, and your profit targets are a contract you make with yourself before you put any money on the line. Having the discipline to stick to that plan, especially when the market is going wild, is what truly separates the pros from the amateurs.
Validating Your Strategy With Backtesting
You've got a trading framework. You've dialed in your scanner. But how do you really know if your swing trading strategy has an edge before you risk a single dollar of your hard-earned capital?
The answer is simple but incredibly powerful: backtesting.

Backtesting is the process of unleashing your set of rules on historical market data to see exactly how it would have performed. Think of it as a time machine for your strategy. It gives you a data-driven preview of its potential strengths and, more importantly, its weaknesses.
Without this step, you’re just trading on hope. You're flying blind.
The Why Behind the Test
More than anything, backtesting is a confidence builder. It’s what transforms a theoretical set of rules into a system with tangible, measurable performance. By running your entry, exit, and risk management criteria through years of past price action, you stop guessing and start making decisions based on statistical probability.
But it’s not just about finding out if the strategy is profitable. It’s about understanding its personality. Does it thrive in trending markets but get chopped to pieces in sideways consolidation? How long are the inevitable losing streaks? These are the tough questions that historical testing answers, preparing you psychologically for the realities of live trading.
Backtesting is the closest thing a trader has to a flight simulator. It allows you to experience turbulence, navigate tough conditions, and learn from mistakes without ever leaving the ground.
Tools like the ChartsWatcher backtester automate this entire process, which is a massive time-saver. You can plug in your specific indicator settings and rules, choose a date range, and let the software crunch the numbers across thousands of historical bars in just minutes. This gives you the hard data you need to refine your approach.
If you're new to the concept, our guide offers a deep dive into how to backtest a trading strategy like a pro.
Interpreting the Results
Once the test is complete, you'll get a report packed with critical metrics. It’s so important to look beyond the total net profit. The real story of your strategy's character is in the details.
These are the key performance indicators (KPIs) that tell you what's really going on:
- Profit Factor: This is your gross profit divided by your gross loss. Anything over 1.0 means you're profitable, but a truly robust strategy should be aiming for 1.75 or higher.
- Win Rate: The percentage of trades that closed for a profit. While a high win rate feels great, it's far less important than the profit factor. A strategy with a 40% win rate can be a cash cow if the average winning trade is much larger than the average loser.
- Maximum Drawdown: This is a big one. It measures the largest peak-to-trough drop in your account equity during the test. It’s a vital indicator of risk and helps you mentally prepare for the worst-case scenario your strategy might face.
The table below breaks down the most essential backtesting metrics. These numbers reveal everything from your strategy's raw profitability to its risk profile.
Key Backtesting Metrics to Evaluate
| Metric | What It Tells You | Ideal Target |
|---|---|---|
| Net Profit | The bottom-line profitability over the entire testing period. | Should significantly outperform a buy-and-hold strategy. |
| Profit Factor | The ratio of gross profit to gross loss. Measures profitability efficiency. | > 1.75 |
| Win Rate (%) | The percentage of trades that were profitable. | Highly strategy-dependent; often 40%-60% for swing trades. |
| Avg. Win / Avg. Loss | The ratio of the average winning trade size to the average losing trade size. | > 2.0 (Your winners should be at least twice as big as your losers). |
| Max Drawdown (%) | The largest percentage drop from a peak in equity. A key risk metric. | < 20% is excellent, but depends on personal risk tolerance. |
| Total Trades | The number of trades taken. Ensures the sample size is statistically significant. | > 100 trades for a reliable result. |
Looking at these metrics in isolation isn't enough. They have to be viewed in the context of a benchmark. Swing traders are actively trying to beat the market, after all. Over the long run, the S&P 500 has historically returned an average of around 9.35% annually. A viable swing strategy needs to comfortably beat that number to justify the effort and risk.
By meticulously analyzing your backtesting results, you can spot the weak points and make data-backed adjustments. Maybe your stop-loss is consistently too tight, or your profit targets are too ambitious and you’re letting winners turn into losers. The data will point you to what needs fixing, allowing you to iterate and improve until you have a robust system you can execute with unwavering confidence.
Your Top Swing Trading Questions, Answered
Even with a killer strategy and a powerful scanner, you're going to have questions. Everyone does. The market is constantly throwing curveballs, and part of becoming a consistent trader is learning how to navigate the inevitable unknowns.
Let's dive into some of the most common questions I hear from traders who are dialing in their swing trading process. Think of this as your practical, no-nonsense guide for smoothing out the bumps you'll hit along the way.
My goal here is to give you straight answers to the real-world challenges you're going to face, from figuring out your starting bankroll to surviving your first (and second, and third) losing streak.
How Much Capital Do I Really Need to Start?
This is the big one, and the honest answer is probably more than you think. While you can technically open a brokerage account with just a few hundred bucks, it's next to impossible to run a proper swing trading strategy with that little cash.
Why? It all comes down to risk management. To keep your risk on any single trade to a survivable level—typically 1-2% of your total account—you need enough capital to eat a few losses without gutting your ability to keep trading. On a tiny account, one bad trade can blow a massive hole in your capital.
A Realistic Guideline: For anyone serious about swing trading, a more practical starting point is somewhere in the $5,000 to $10,000 range. This gives you enough breathing room to take meaningful position sizes while sticking to strict risk rules, giving your strategy a real chance to prove itself.
How Many Stocks Should I Trade at Once?
When your scanner is spitting out one great setup after another, it's tempting to want to trade them all. I get it. But this is a classic rookie mistake that leads to sloppy execution and unnecessary losses.
Spreading yourself too thin is a recipe for disaster. You simply can't manage a dozen open positions effectively and give each one the focus it deserves.
A better way to think about it is quality over quantity.
- If you're new to this: Stick to just 2-3 open positions at a time. This is more than enough to learn the ropes of managing live trades without getting overwhelmed.
- For seasoned traders: Even the pros rarely have more than 5-7 active swing trades running at once. The mental energy needed to track multiple stops, targets, and changing market conditions is no joke.
By limiting your concurrent trades, you force yourself to be more selective. You start passing on the "pretty good" setups and only commit capital to your absolute A+ opportunities. That discipline alone will work wonders for your P&L.
How Do I Handle a Losing Streak?
Losing streaks happen. To everyone. No matter how good you are, you will go through periods where nothing seems to work. They are a non-negotiable part of this business. The key isn’t trying to avoid them—it’s knowing how to manage them so they don’t wreck your account or your headspace.
The moment you realize you're in a slump, it's time to hit the brakes and figure out what's going on.
First, stop trading. Seriously. Take a day or two away from the screens. Let your emotions cool down and break the negative feedback loop.
Next, open your trading journal. Go back and dissect the losing trades. Were you actually following your plan? Did you chase an entry? Did you move your stop because you "felt" like it would turn around? More often than not, the problem isn't the strategy—it's a breakdown in discipline.
Finally, when you do come back to the market, cut your position size in half. This immediately lowers the financial and emotional stakes, making it easier to get back on track with a few small, confidence-building wins.
A losing streak feels personal, but it’s just feedback from the market. Treat it like a data set, find the lesson, and adjust your process. That’s how you build the resilience you need to stay in this game for the long haul.
Ready to stop guessing and start building a data-driven swing trade strategy? ChartsWatcher provides the advanced scanning, backtesting, and analysis tools you need to find high-probability setups and trade with confidence. Start your free trial today at chartswatcher.com.
